


Services on Demand
Article
 English (pdf)
 Article in xml format
 Article references
Indicators

Related links
-
 Cited by Google
 -
 Similars in Google
Share

 Permalink
South African Journal of Industrial Engineering
On-line version ISSN 2224-7890
Print version ISSN 1012-277X
S. Afr. J. Ind. Eng. vol.30 n.1 Pretoria May. 2019
http://dx.doi.org/10.7166/30-1-2037
GENERAL ARTICLES
Multiplicative LMDI approach to South Africa's industrial energy consumption
O.A. Olanrewaju*
Industrial Engineering Department, Durban University of Technology, South Africa
ABSTRACT
As a developing country, South Africa's manufacturing sectors have led to the country's present industrialisation. Where industrialisation occurs, energy plays a pivotal role. This study, therefore, focuses on analysing and understanding the contributing factors responsible for the energy consumed in South Africa's manufacturing sectors. The period under investigation is from 1970 to 2016. Two different modes of understanding the factors responsible for energy consumption are structural decomposition analysis (SDA) and index decomposition analysis (IDA). The latter was preferred for this study. The logarithmic mean divisia index (LMDI) was adapted for the analysis. The energy consumed by the manufacturing sector is decomposed into the activity, structure, and intensity effects. Results show that both intensity effects and structure effects contributed to the country's energy efficiency by 3.10 per cent and 1.73 per cent. On the other hand, activity effects contributed to the rise of industrial energy consumption by 8.04 per cent. The empirical findings of this study support initiatives in the form of policies to concentrate more on the industrial activity effects to complement energy efficiency strategies.
OPSOMMING
Suid-Afrika se vervaardigingsindustrie het gelei tot die huidige vlak van industrialisering. Energie speel 'n belangrike rol in so 'n geval. Hierdie studie fokus daarop om die bydraende faktore wat verantwoordelik is vir die energieverbruik in die Suid-Afrikaanse vervaardigingsindustrie te ontleed en te verstaan. Die tydperk van 1970 tot 2016 word by hierdie studie ingesluit. Twee verskillende metodes om die bydraende faktore te verstaan is strukturele ontbindingsanalise en indeks ontbindingsanalise. Die laasgenoemde is vir hierdie studie ingespan. Die logaritmiese gemiddelde verdelingsindeks (LMDI) is aangepas vir die analise. Die energie-verbruik van die vervaardigingsektor is opgedeel in die aktiwiteit-, struktuur- en intensiteit-effekte. Resultate toon dat beide die intensiteit- en die struktuur-effekte bydra tot die land se energie doeltreffendheid deur onderskeidelik 3.10 en 1.73 persent. Daarteenoor het aktiwiteit-effekte bygedra tot 'n 8.04 persent toename in industriële energieverbruik. Die empiriese bevindings in hierdie studie ondersteun beleidsinisiatiewe wat fokus op industriële aktiwiteite om sodoende energie doeltreffendheid aan te vul.
1 INTRODUCTION
Energy remains the greatest contributor to greenhouse gas emissions [1]. The demand for energy mostly comes from these main sectors: residential, industrial, transport, and a combination of commercial, government buildings, street lighting, etc. [2]. The role that energy plays is fundamental to resolving the crises of economic competitiveness, security, and sustaining the environment [3]. Manufacturing sectors give rise to industrialisation. Industrialisation in turn increases the consumption of energy due to the various industrial activities [4]. Industries have a tendency to consume between one-quarter and one-third of a country's energy [5]. Concerns from governments and international and local organisations, as well as private parastatals, have now prioritised addressing the matter of industrial energy saving. Thus, identifying the factors that contribute to energy consumption becomes necessary. As energy costs continue to escalate, together with concerns about climate change, energy efficiency seems to be the only solution to maintaining competition and reducing the impact of industrial activities [6]. However, to attain the objective of energy efficiency, the need to understand factors of energy use in the industrial setting is imperative. Understanding the industrial sectors' change in energy demand over time is crucial to the assessment of policies that are targeted to improve energy efficiency [7].
Understanding the various factors assists in elaborating on existing strategies to improve energy efficiency [8]. The present study is not far from this thought. An easy way of categorising a thing into pre-defined several factors is termed 'decomposition analysis' [9]. Decomposition analysis divides differences in research objects, such as the amount of energy consumed and the amount of carbon emission, into various factors [10]. Two remarkable modes of understanding the factors responsible for energy consumption are structural decomposition analysis (SDA) and index decomposition analysis (IDA). SDA was created as an input-output analysis of quantitative economics, whereas IDA was formulated on the basis of index number theory. The SDA technique has a upper hand over IDA through these characteristics: it distinguishes between technological and final demand effects; and it includes demands that are indirectly impacted, whereas IDA is only involved with direct effects [11]. The latter is preferred mostly by researchers, and for this study, because of its reduced data requirements [8]. IDA, because it is less complicated [12], has achieved fame in the literature [13, 14]. IDA has two types: the Divisia index and the Laspeyres index [15], with the former topping the list for researchers in the form of the logarithmic mean Divisia index (LMDI). The Laspeyres method has the advantage of solving zero-value situations, and is easily understood; but its decomposed results include a large proportion of residual terms [11]. LMDI, on the other hand, can be termed robust because of the following factors: consistent aggregation; flawless decomposition; flexibility; ease of use and result analysis; a strong theoretical base; and it solves residual and zero-value problems [16-19]. LMDI can be in either multiplicative or additive form. A stand-out characteristic of LMDI is that it allows no residual term [5]. The additive form tends to be found more in the SDA literature, whereas the multiplicative form is found more in classical index number theory [20]. Identifying the driving factors and their level of contribution to the consumption of energy had been successfully carried out by decomposition analysis. Various areas of application include the transportation sector [21], policies in the European Union [22], the economies of countries [23] [24] [25] [26] [27] [28] [29], the residential sector [30], secondary industries [31], and coal consumption [32].
A commitment from major energy users, companies, and associates to reducing global energy consumption was required during the world summit on sustainable development in South Africa in 2002 [33]. Among the mainly productive traditions of mitigating carbon dioxide emissions, expanding the safety of energy availability, and reviving industrial competition has undoubtedly brought an improvement in energy efficiency [34]. Greater energy efficiency could result in savings of between 10 and 20 per cent of current consumption, as estimated by the South African National Energy Association. This is believed to induce a rise of between 1.5 per cent and 3 per cent in GDP [33]. Various programmes and incentives have been implemented to promote industrial energy efficiency in South Africa. A notable industrial energy efficiency programme in the country is the demand side management (DSM) programme of Eskom (the South African power supplier) to alleviate supply shortages. Despite the efforts of the DSM, more effort would still be required to reduce the demand from industrial users. Incentives in place to promote industrial energy efficiency activities include rebates for applying energy efficiency and DSM interventions, and tax credits for both green field projects and energy efficiency interventions.
The aim of this study is to understand the factors that most influence energy consumption in the major manufacturing sectors (basic chemicals, non-metallic minerals, basic iron and steel, basic non-ferrous metals, and other manufacturing sectors) in South Africa. The multiplicative LMDI was adapted to analyse South African manufacturing industries over the period 1970-2016, identifying the factors and measuring their contributions in relation to energy consumed. The inclination of the multiplicative method towards classical index number theory decided its choice for this study. Following this introduction, a literature review is presented in section 2. Section 3 presents the data and methodology applied for this study's investigation. Section 4 details the results of this study, and Section 5 concludes it.
2 LITERATURE REVIEW
The literature has a few studies of industries employing IDA for their analysis [20] [6] [35] [36] [4] [1] [2]. Energy efficiency in the Korean manufacturing sector from 1981 to 2010 was examined through decomposition analysis. The analysis pictured a decrease of 85.85 per cent in energy intensity, with a 69.73 per cent increase in energy intensity due to structural change. Energy efficiency in the Korean manufacturing sector is focused on industrial structure [20]. Duran, Aravena and Aguilar [6] focused on finding out which sub-sectors in Chilean industry had the most potential to reduce the amount of energy consumed between 2005 and 2009. LMDI-1 quantified the factors responsible for energy consumption. The result indicated that, with constant energy consumption, energy intensity still increased. A few of the sectors considered in Duran, Aravena and Aguilar [6] accounted for more than 85 per cent of the total industrial energy consumption. China's non-ferrous metal industry was analysed empirically using the LMDI. The study decomposed the contributing factors to energy structure, energy intensity, industrial structure, labour productivity, and industrial scale effects from 2000 to 2014. As dominant as the energy intensity effect was in reducing China's energy consumption over the period of that study, it could not totally offset the increase that came about through the other factors in the study of Wang and Feng [35].
Hasanbeigi,Can and Sathaye [36] employed LMDI to understand the increase in industrial gross domestic product (GDP) in California in 2008. Seventeen industrial sub-sectors were considered, combining both energy-intensive and non-energy-intensive industries. The study considered the energy use between 1997 and 2008. Both intensity and structural effects were responsible for the reduction in energy use. Of the energy intensive industries, oil and gas extraction contributed most to the decrease in energy intensity, with a 15 per cent decrease in 1997 to 5 per cent of the total industry value added in 2008; whereas, for the non-energy-intensive industry of electric and electronic equipment manufacturing, it increased from 7 per cent in 1997 to 30 per cent of the total industry value added in 2008. Considering the energy use in Thailand's manufacturing industries from 1991 to 2011, Chontanawat,Wiboonchutikula and Buddhivanich [4] applied LMDI to understand the influencing factors. There was a great increase in energy intensity from 1991 to 2000, whereas a small decrease was observed for the remaining period. It was also observed that structural effect was responsible for that small decline in energy intensity. Shahiduzzaman and Alam [1] considered the Australian economy, focusing on two levels of disaggregation with eight sectors and 14 sub-sectors between 1978 and 2009. The study decomposed energy intensity into fuel mix, energy efficiency, and structural effects for both sector and sub-sector. Both energy efficiency and structural effects decreased Australia's energy intensity during the period of study. Martinez [2] described the development of energy efficiency in the industrial sectors of Germany and Colombia between 1998 and 2005. The decomposition results showed that both countries' aggregate energy intensity came from the energy-intensive sectors. Germany's efficiency improved because of both structural and intensity effects. On the other hand, the intensity effect dominated structural effects in the case of Colombia.
3 DATA AND METHODOLOGY
3.1 Data
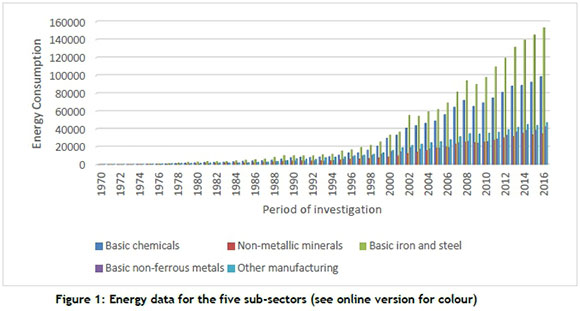
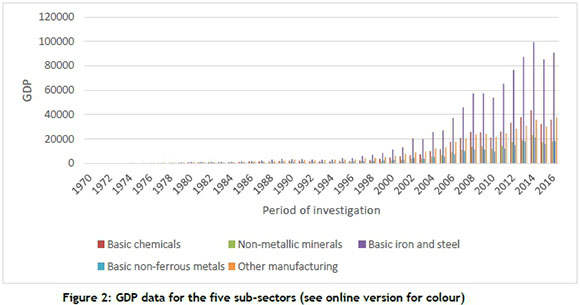
To identify the factors and measure their contributions in relation to energy consumed in the South African industrial sector, energy and GDP data from five industrial subsectors from 1970 to 2016 are analysed. These subsectors are basic chemicals, non-metallic minerals, basic iron and steel, basic non-ferrous metals, and other manufacturing. Figures 1 and 2 summarise the energy consumed and the GDP for the subsectors under investigation. Quantec, a private company in South Africa, provided the data. Production data is given in the form of GDP expressed in R million; current prices and energy are given in R millions per tonne. There is a close correlation between the energy consumed and the total GDP in the South African industrial sectors. This correlation is close to linearity, which is identified by the formula: energy = 19,135 + 2GDP, with a correlation coefficient of 0.9595. This confirms the nexus that exists between South African industrial energy consumption and GDP. The study considered mostly energy-intensive manufacturing, while a combination of the other manufacturing sectors is considered as another entity.
3.2 Methodology
The decomposition technique continues to be very important in energy and energy-related environmental assessments [37]. Different factors have been considered in various studies; however, the most common are activity, structure, and intensity [5]. Understanding the three factors will also help to track and evaluate the performance of industries when it comes to energy use. This study considered the most frequent components from LMDI studies: activity effect, structure effect, and intensity effect. The impact of energy consumption measured is as a result of changes in the total activity of the sector's level, which is referred to as 'activity effect'. Activity effect informs the changes in economic activities captured by output generated in an economy, which never remains the same between two periods. Both structure and intensity effects contribute to changes in the energy consumed through changes in the activity mix by sub-sectors (structure effect), which is the shift in the share of economic activities and from changes in their intensities [38].
Each of the respective terms - activity (the Q-term, which captures a given sector's contribution to the overall GDP), energy intensity (the I-term, which denotes the actual change in energy efficiency), and the structural effect (the S-term, which implies the various shifts in the mix of products or activities) represents how much of the change in energy consumption observed during the periods 0 to T can be assigned to changes in the respective variables.
The decomposition analysis variables are given below:
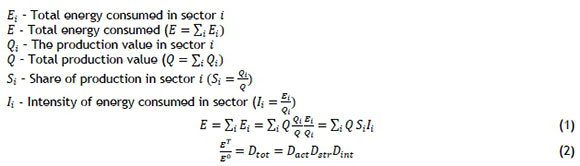
Dtotis Total energy, Dactis the activity (representing Q in equation1), Dstris the structure (representing 5; in equation 2) and Dintis the intensity change (representing /; in equation 1).
General formulae of LMDI
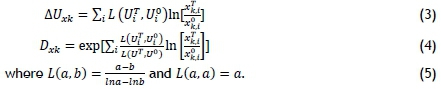
Assumption of aggregate U composed of m indicators (x1, - ,xm), i.e. U =ΣιUι and Ut = xi,i x2,i -xm,i- Assuming further that, from period 0 to T, the aggregate changes from U° to UT. The objective of IDA is to derive the contributions of the m factors to the change in the aggregate, which is expressed as
LMDI (Multiplicative)
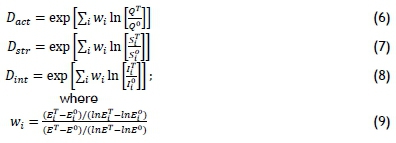
Having to choose between multiplicative and additive decomposition is practically insignificant; the fundamental concern is the ease of presenting and interpreting results, as reported by Fengling [39]. Based on experience, when decomposition is performed on a yearly basis using time-series energy and industrial production data, it is more convenient to use the multiplicative approach, as the results given in indices can be conveniently plotted over time. This study applied the multiplicative approach to the above data.
4 RESULTS
Execution of the multiplicative LMDI was carried out using Matlab (matrix laboratory) software, which is famous for numerical computation. According to Table 1 below, the manufacturing sectors' aggregate energy consumption increased by 3.55 per cent in the period 1970/71 to 2015/16. Only the activity effect was positive, contributing to an 8.04 per cent increase. This statement can be simply interpreted to mean that South Africa's manufacturing growth involved an 8.04 per cent increase ion the aggregate energy consumed. The Department of Minerals and Energy White Paper [40] that was first developed in 1998 attested to the fact that, before 1998, industries in South Africa had no idea of the need for energy savings and improved energy efficiency [41]. However, after the 1998 policy, it was noticeable that, after only four years, the consumption reached a reasonably low level. All activity effects are greater than 1 except for 2008-2009, 2009-2010, and 2014-2015. This is an indication that, during the periods studied (with the exception of those periods less than 1) activity effects promoted industrial energy consumption. On the other hand, both structure and intensity effects made negative contributions, leading to an increase in the aggregate energy consumption by 1.73 per cent and 3.10 per cent respectively. This indicates that the change in production structure (structure effect) led to a reduction in the aggregate consumption of energy. However, the changes in energy efficiency, given the possibility of improved or efficient technologies and possible changes in the energy mix, was crucial in the reduction of the aggregate energy consumed. Both structural and intensity effects have six times more of the periods less than 1 compared to the activity effect. With the combined contributions from the structure and intensity effects, their impact was not able to displace that of the activity effect. The increase in production experienced by South Africa's industries had a serious impact on the aggregate that the improved efficiency practiced, and the production structure failed to have a discernible impact.
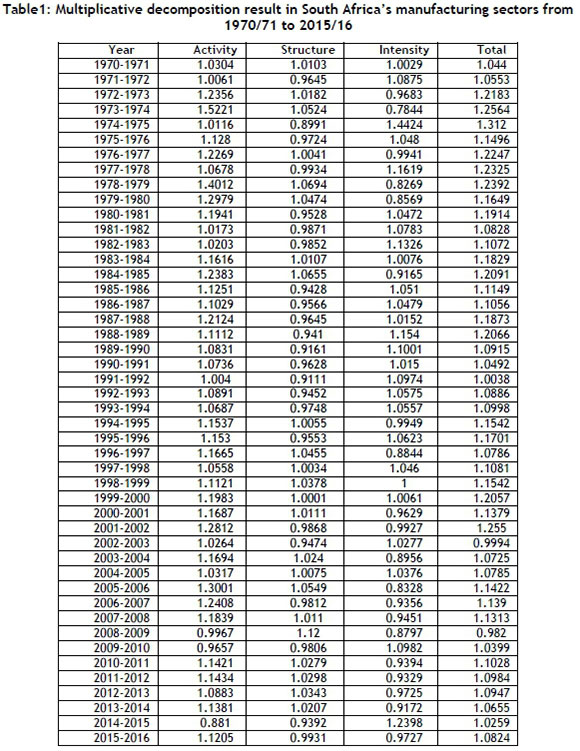
From Figure 3 below, referring to the activity effect, it took the opposite turn throughout the cycle when compared with the intensity effect. However, activity, structure, and the aggregate energy consumed followed the same pattern throughout the period. Whenever there was an increase in activity, both structure and aggregate energy increased; the same applied when there was a decrease.

A focus on South Africa's energy efficiency could give a huge boost to the country. Energy remains a fundamental basis of most of the challenges that countries face, whatever their stage of development [42]. Identifying the contributing factors is positive for industries, as they are able to identify how efficient they could be in their consumption, leading to reduced costs and improved profits [5]. Profit, a reduction in greenhouse gases, competition, and capital investment constraints are driving forces in the country's industrial energy efficiency [43]. With the implementation of energy efficiency techniques, as observed from the intensity effect, there is still more to do to overturn the increased consumption rate.
A policy mix needs to be introduced by the industries that will address industrial energy efficiency and activate the driving forces that can implement the various measures of energy efficiency. One of the driving forces is employee motivation, which will impact on industrial activity. The European Union has intensified more than half of its energy consumption since 2007 as a result of the decrease in industrial activity due to recession. From the result of this study, it is clear that a reduction in South Africa's industrial activity will definitely reduce its consumption; however, recession is not an option we should welcome. The country's efforts to improve energy efficiency is commendable. Of the clean development mechanism (CDM) projects in South Africa, that of energy efficiency contributed the most [41]. This is also evident from the result of the present study.
5 CONCLUSION
The successful application of the multiplicative LMDI form of IDA revealed and assessed the contributing factors responsible for the consumption of energy in South Africa's manufacturing industrial sectors. The assessment of the variation in the aggregate energy consumed considered the activity, structure, and intensity effects. The year 1974-1975 recorded the highest energy consumption. This could be attributed to the lack of energy policies at that time. Throughout the period under investigation, the energy consumption swing was largely influenced by economic activity, with structure playing the smallest role in influencing it. In this situation, a reform in activity in the country's manufacturing sectors is essential. The multiplicative LMDI has served as a fairly inexpensive policy tool that yields a lot of information with few or no problems. It can be said that policies targeting energy efficiency are most likely going to be indifferent to activity when it comes to affecting energy consumption. This, however, needs to be reconsidered for the future of the country's energy use.
Where efforts towards energy efficiency have been offset by the activity effect, an intense and holistic approach to promoting the conservation of energy is needed, simply to address the effects that make a marginal contribution to improved energy conservation. This study proposes that an adjustment to the economy, as well as to the economic growth trend, be implemented. This is achievable through planning adjustment by various sectors, upgrading the industries, and controlling energy consumption.
This study has confirmed that the activity effect played a critical role in understanding the energy increase in South African manufacturing industries from 1970/71 to 2015/16. IDA has proved its relevance in assisting with policy designs and evaluation in the areas of energy analysis. Various policies exist in South Africa, ranging from the White Paper, the National Energy Efficiency Strategy, the Energy Efficiency Accord, and the National Climate Change Response Green Paper, to tackle the country's energy crisis. The aftermath of their implementation is commendable; however, more is still expected. It is advisable that policies devote more attention to the industrial activity effect from now on. It is worth noting that greenhouse gas issues are not greatly separate from energy issues, which will require an improved environmental protection criterion. With the author's focus more on energy-intensive manufacturing, the information gathered will go a long way to preserving the country's air from the emission of greenhouse gases coming from the industries' combustion emissions and production processes.
REFERENCES
[1] Shahiduzzaman, M. and K. Alam, Changes in energy efficiency in Australia: A decomposition of aggregate energy intensity using logarithmic mean Divisia approach. Energy Policy, 2013. 56: p. 341-351. [ Links ]
[2] Martinez, C.I.P., Energy efficiency developments in the manufacturing industries of Germany and Colombia, 1998-2005. Energy for Sustainable Development, 2009. 13: p. 189-201. [ Links ]
[3] Ang, B.W., A.R. Mu, and P. Zhou, Accounting frameworks for tracking energy efficiency trends. Energy Economics, 2010. 32: p. 1209-1219. [ Links ]
[4] Chontanawat, J., P. Wiboonchutikula, and A. Buddhivanich, Decomposition analysis of the change of energy intensity of manufacturing industries in Thailand. Energy, 2014. 77: p. 171-182. [ Links ]
[5] Gonzalez, P.F., M. Landajo, and M.J. Presno, Tracking European Union CO2 emissions through LMDI (Logarithmic-mean Divisia Index) decomposition. The activity revaluation approach. Energy, 2014. 73: p. 741-750. [ Links ]
[6] Duran, E., C. Aravena, and R. Aguilar, Analysis and decomposition of energy consumption in the Chilean industry. Energy Policy, 2015. 86: p. 552-561. [ Links ]
[7] Norman, J.B., Measuring improvements in industrial energy efficiency: A decomposition analysis applied to the UK. Energy, 2017. 137: p. 1144-1151. [ Links ]
[8] Achour, H. and M. Belloumi, Decomposing the influencing factors of energy consumption in Tunisia transportation sector using LMDI method. Transport Policy, 2016. 52: p. 64-71. [ Links ]
[9] Lin, B. and K. Du, Understanding the change of energy intensity in China: a comprehensive decomposition frame. World Econ (In Chinese), 2014. 4: p. 69-87. [ Links ]
[10] Wang, Q., Y. Wang, P. Zhou, and H. Wei, Whole process decomposition of energy-related SO2 in Jiangsu Province, China. Applied Energy, 2017. 194: p. 679-687. [ Links ]
[11] Wang, M. and C. Feng, Decomposing the change in energy consumption in China's nonferrous metal industry: An empirical analysis based on the LMDI method. Renewable and Sustainable Energy Reviews, 2018. 82: p. 2652-2663. [ Links ]
[12] Lyu, W., Y. Li, D. Guan, H. Zhao, Q. Zhang, and Z. Liu, Driving forces of Chinese primary air pollution emissions: an index decomposition analysis. Journal of Cleaner Production, 2016. 133: p. 136-144. [ Links ]
[13] Hoekstra, R. and J.J.C.J.M. van den Bergh, Comparing structural and index decomposition analysis. Energy Economics, 2003. 25(1): p. 39-64. [ Links ]
[14] Tan, R. and B. Lin, What factors lead to the decline of energy intensity in China's energy intensive industries? Energy Economics, 2018. 71: p. 213-221. [ Links ]
[15] Ang, B.W. and F.Q. Zhang, A survey of index decomposition analysis in energy and environmental analysis. Energy, 2000. 25: p. 1149-1176. [ Links ]
[16] Mendiluce, M., I. Perez-Arriaga, and C. Ocana, Comparison of the evolution of energy intensity in Spain and in the EU 15. Why Spain different? Energy Policy, 2010. 38(1): p. 639-645. [ Links ]
[17] Ang, B.W. and F.L. Liu, A new energy decomposition method:perfect in decomposition and consistent in aggregation. Energy, 2001. 26: p. 537 - 548. [ Links ]
[18] Ang, B.W., Decomposition analysis for policymaking in energy: which is the preferred method? Energy Policy, 2004. 32(9): p. 1131 - 1139. [ Links ]
[19] Ang, B.W. and F.Q. Zhang, A survey of index decomposition analysis in energy and environmental studies. Energy, 2000. 25(12): p. 1149-1176. [ Links ]
[20] Choi, K.-H. and W. Oh, Extended Divisia index decomposition of changes in energy intensity: A case of Korean manufacturing industry. Energy Policy, 2014. 65: p. 275-283. [ Links ]
[21] Achour, H. and M. Belloumi, Investigating the causal relationship between transport infrastructure, transport energy consumption and economic growth in Tunisia. Renewable and Sustainable Energy Reviews, 2016. 56: p. 988-998. [ Links ]
[22] Cruz, L. and J. Dias, Energy and CO2 intensity changes in the EU-27: Decomposition into explanatory effects. Sustainable Cities and Society, 2016. 26: p. 486-495. [ Links ]
[23] Timma, L. and D. Blumberga, Index decomposition analysis for energy sectors in Latvia. Energy Procedia, 2014. 61: p. 2180-2183. [ Links ]
[24] Ma, C. and D.I. Stern, China's changing energy intensity trend: a decomposition analysis. Energy Economics, 2008. 30: p. 1037-1053. [ Links ]
[25] Zhao, X., C. Ma, and D. Hong, Why did China's energy intensity increase during 1998-2006: decomposition and policy analysis. Energy Policy, 2010. 38: p. 1379-1388. [ Links ]
[26] Wang, W., X. Liu, M. Zhang, and X. Song, Using a new generalized LMDI (Logarithmic Mean Divisia Index) method to analyse China's energy consumption. Energy, 2014. 67: p. 617-622. [ Links ]
[27] Bruno, G.P., I. Staffell, and K.-A. Adamson, Current energy landscape in the Republic of South Africa.International Journal of Hydrogen Energy, 2015. 40: p. 16685-16701. [ Links ]
[28] Torrie, R.D., C. Stone, and D.B. Layzell, Understanding energy systems change in Canada: 1. Decomposition of total energy intensity. Energy Economics, 2016. 56: p. 101-106. [ Links ]
[29] Shahiduzzaman, M. and K. Alam , Changes in energy efficiency in Australia: A decomposition of aggregate energy intensity using logarithmic Mean Divisia approach. Energy Policy, 2013. 56: p. 341-351. [ Links ]
[30] Zhang, M., Y. Song, P. Li, and H. Li, Study on affecting factors of residential energy consumption in urban and rural Jiangsu. Renewable and Sustainable Energy reviews, 2016. 53: p. 330-337. [ Links ]
[31] Zhang, W., K. Li, D. Zhou, W. Zhang, and H. Gao, Decomposition of intensity of energy-related CO2 emission in Chinese provinces using the LMDI method. Energy Policy, 2016. 92: p. 369-381. [ Links ]
[32] Chong, C., L. Ma, Z. Li, W. Ni, and Song, S, Logarithmic Mean Divisia Index 9LMDI) decomposition of coal consumption in China based on the energy allocation of coal flows. Energy, 2015. 85: p. 366-378. [ Links ]
[33] Govender, S., Energy Savings Mechanisms in the Mining Industry: A case study of switching off non-essential power. 2008, Masters thesis, University of Stellenbosch. [ Links ]
[34] Zhou, P., B.W. Ang, and D.Q. Zhou, Measuring economy-wide energy efficiency performance: A parametric frontier approach. Applied Energy, 2011. in press. [ Links ]
[35] Wang, M. and C. Feng, Decomposing the change in energy consumption in China's non-ferrous metal industry: An empirical analysis based on the LMDI method. Renewable and Sustainable Energy reviews, 2018. 82: p. 2652-2663. [ Links ]
[36] Hasanbeigi, A., S.d.l.R.d. Can, and J. Sathaye, Analysis and decomposition of the energy intensity of California industries. Energy Policy, 2012. 46: p. 234-245. [ Links ]
[37] Zha, D., D. Zhou, and N. Ding, The contribution degree of sub-sectors structure effect and intensity effect on industry energy intensity in China from 1993 to 2003. Renewable and Sustainable Energy reviews, 2009. 13: p. 895-902. [ Links ]
[38] Ang, B.W. and X.Y. Xu, Tracking industrial energy efficiency trends using index decomposition analysis. Energy Economics, 2013. 40: p. 1014-1021. [ Links ]
[39] Fengling, L., Decomposition Analysis Applied to Energy: Some methodological issues. A thesis submitted for the degree of Doctor of Philosophy, in Industrial and Systems Engineering. 2004, National University of Singapore. [ Links ]
[40] DME, White Paper on the Energy Policy of the Republic of South Africa. 1998, Department of Minerals and Energy: Pretoria. [ Links ]
[41] Nhamo, G. and A. Bimha, Energy efficiency in South Africa: policy perspectives and the path to low carbon growth. WIT Transactions on Ecology and the Environment, 2011. 144: p. 389-401. [ Links ]
[42] Lima, F., Nunes, M.L., J. Cunha, and A.F.P. Lucena, Driving forces for aggregate energy consumption: A cross-country approach. Renewable and Sustainable Energy reviews, 2017. 68: p. 1033-1050. [ Links ]
[43] Fawkes, H. , Energy efficiency in South African industry. Journal of Energy in Southern Africa 2005. 16(4): p. 18-25. [ Links ]
Submitted by authors 29 Aug 2018
Accepted for publication 13 Mar 2019
Available online 29 May 2019
* Corresponding author oludolapoo@dut.ac.za

