


Services on Demand
Article
 English (pdf)
 Article in xml format
 Article references
Indicators

Related links
-
 Cited by Google
 -
 Similars in Google
Share

 Permalink
South African Journal of Industrial Engineering
On-line version ISSN 2224-7890
Print version ISSN 1012-277X
S. Afr. J. Ind. Eng. vol.30 n.1 Pretoria May. 2019
http://dx.doi.org/10.7166/30-1-1945
GENERAL ARTICLES
Diagnostic assessment of service delivery health in South Africa: a systematic literature review
Department of Industrial & Systems Engineering, University of Pretoria, South Africa
ABSTRACT
Access to cost-effective, high-quality and speedy public services is a legitimate requirement and expectation of all South Africans. However, despite massive increases in successive budgets and grants to the public sector, the economy continues to witness frequent unrest that is typically tagged as being about 'service delivery'. To deal effectively with this conundrum, an evidence-driven, goal-oriented diagnosis of the health of service delivery in South Africa is required. This is even more important as service delivery deficits and backlogs have continued to grow and widen since democratisation. It is therefore pertinent that a diagnostic tool with a sound and rigid theoretical foundation, and rigorously evaluated against key performance metrics, be developed as part of efforts to close service delivery gaps. This paper explores the necessary criteria for a diagnostic tool to contribute effectively in closing service delivery gaps in South Africa.
OPSOMMING
Toegang tot koste effektiewe, hoë gehalte en vinnige publieke dienste is 'n geldige vereiste en 'n verwagting van alle Suid-Afrikaners. Ten spyte van massiewe toenames in opeenvolgende begrotings en toelaes aan die publieke sektor, word die ekonomie steeds blootgestel aan gereëlde onrus wat tipies aan swak dienslewering toegeskryf word. Om effektief met hierdie strikvraag te werk te gaan is 'n doelgerigte diagnose van die toestand van dienslewering in Suid-Afrika benodig. Dit is selfs belangriker soos dienslewering tekortkominge en agterstande toegeneem en versprei het sedert demokrasie in Suid-Afrika. Dit is daarom belangrik dat 'n diagnostiese instrument met 'n stewige teoretiese fondament ontwikkel en deeglik getoets word teen sleutel vertonings-maatstawwe in 'n poging om dienslewering tekortkominge aan te spreek. Hierdie artikel ondersoek die nodige kriteria vir so n diagnostiese instrument om sodoende noemenswaardig by te dra tot die verbetering van dienslewering in Suid-Afrika.
1 INTRODUCTION
As far back as 1997, in recognition of the need to run an effective and efficient public service, the South African government adopted the White Paper on Transforming Public Service Delivery (WPTPSD), generally referred to as the Batho Pele [1] White Paper. Although this policy clearly outlines the processes, procedures, behaviours, and systems required to deliver cost-effective, high-quality public service, Mdlongwa [2] argues that the public service still struggles with the basics. That is, it is unable to map out, standardise, optimise, assess, and monitor its services to ensure consistently speedy, affordable, and high-quality services. Although his argument is not supported by any scientific methods, a study by the Public Service Commission (PSC) [3] supports his claim to a considerable extent. The PSC study, which tries to understand how well Batho Pele policy has been adopted and implemented by national and provincial governments, indicates that many public officers and users of public services do not even know about the policy. Several examples are given in the PSC study [3]: (1) At the Department of Home Affairs, 99% of users of public services do not know of any efforts by the department to promote openness and transparency; (2) 90% are unaware of value for money efforts; and (3) 86% don't know about any redress mechanisms. On a positive note, 61% praised the department's efforts on information dissemination [3].
However, this review by the PSC was a discrete event without any clearly defined metrics for each area interrogated in the questionnaire. The review was similar to the General Household Survey (GHS) [4] of Statistics South Africa (StatsSA), which assessed the state of public services such as education, housing, and related services such as electricity/water supply and sanitation. Drawing conclusions that drive government policy and decision-making on the basis of traditional statistical surveys such as these is problematic, incomplete, and non-sustainable, since Tirivangasi and Mugambiwa [5] contend that, notwithstanding the studies, service delivery gaps continue to be a problem, leading to protests that paint a negative picture of South Africa both locally and internationally.
While it may be argued that there are other driving forces in the configuration of these protests, such as the prevailing economic and political situations and the triple challenge of poverty, inequality, and unemployment, a diagnostic assessment of the health of service delivery is required to determine the extent of its contribution to the unrest, among other things. Thus this paper explores, through a systematic literature review (SLR), the criteria for such diagnosis to be effective and efficient.
1.1 Background
Having adopted its policy on service delivery improvements, government has set up and designated a few oversight departments to monitor its programmes, projects, and services. These include the Public Service Commission (PSC) [6, 7], the Department of Public Service and Administration (DPSA) [8, 9], the Department of Planning, Monitoring and Evaluation (DPME) [10], and a Chapter 9 institution, the Office of the Auditor General [11]. Backed by relevant laws and many national policy frameworks, these oversight institutions adopt many tools and performance assessment methodologies to carry out their various mandates. The DPMe, for instance, is backed by the National Evaluation Policy Framework, the Medium Term Strategic Framework, the National Evaluation System, etc. Regarding service delivery, a notable and creditable effort by the department is the Frontline Service Delivery Monitoring (FSDM) programme, developed to monitor the quality or performance of service delivery at specific points of service (PoS). The programme entails using standard questionnaires like those of the PSC and StatsSA to survey certain service delivery qualitative parameters.
Apart from the wastefulness of these overlaps, duplications, and repetitions by government organs, a review of the tools and surveys reveals that they are not theoretically grounded, scientifically evaluated, or proven to lead to any improvements in service delivery. A change of paradigm, an innovative approach, and a different way of diagnosis are therefore needed, given the magnitude and socio-economic impact of these service delivery disturbances.
1.2 Problem validation and statement
Service delivery unrest has become commonplace in South Africa. While over the years government has put in place many strategic plans, policy frameworks, programmes, and systems to assess and monitor service delivery performance with the aim of improving it, unrest, arising from service delivery gaps, continues [7, 12]. Although some authors have proposed certain ways by which government might solve this problem, we believe that any solution without a proper diagnosis is short-sighted - i.e., a diagnostic tool that is well-defined, rigorously tested, and theoretically grounded is required before any sustainable solutions can be developed and applied. We agree with Makanyeza [13] that one of the ways to improve service delivery is to have a way to assess and monitor its health.
Tirivangasi and Mugambiwa [5] estimated that up to one thousand incidents of service-related unrest took place in one month during 2014, while the Institute for Security Studies (ISS) [14] reviewed 2,880 cases of public unrest between 2013 and 2015, about 34 per cent of which it ascribed to service delivery issues. On the content of this 34 per cent, Runciman et al. [15] identified issues such as electricity and water and sanitation, while ISS included housing, health, and education. Figure 1 presents Runciman et al.'s [15] inferences.

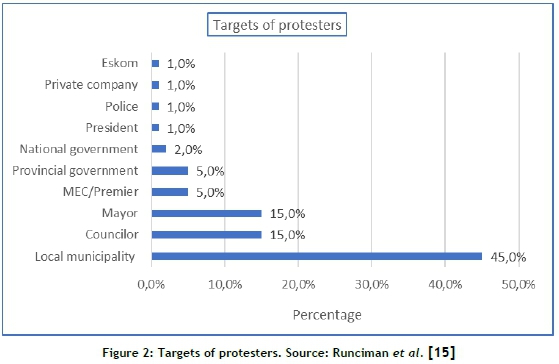
A further analysis by Ruciman et al. [15] reveals who these protests are targeted at. As shown in Figure 2, only one per cent (1%) is targeted at private entities, which strengthens the notion that government needs to have a way to diagnose the health of service delivery that can inform corrective actions, learning, and continuous improvement.
Because of the crippling effect that service delivery gaps and associated disturbances have on our society, government and many authors have focused attention on how the issues might be resolved. It is interesting, however, that only a few studies have focused on assessing the health of service delivery in a scientific way. Of the few assessment tools available - typically, traditional questionnaires - the diagnostic metrics have not been well defined - i.e., there is no evidence of how diagnostic metrics are developed. Their theoretical basis and methodology are absent, and the validation processes that were used before accepting the metrics are missing. Yet this type of rigour is desirable for a problem of this magnitude.
Shaidi [16], Alexander [17], Thompson [18], Nleya [19], and Mdlongwa [2] all investigated the causes of service delivery failures without developing any tools or metrics to assess service delivery health on an on-going basis. Makanyeza [13], who conducted a survey that indicated that the regular assessment and monitoring of service delivery health (as an early warning system to trigger corrective actions) is desirable, did not develop any methodology or measures to do the assessment. In the same way, Sibanda [20] advocated for the quality assessment of service delivery health using International Organization for Standardization (ISO) standards, international benchmarking, and balanced scorecards. However, she did not develop any quality metrics beyond a formula for calculating perceived quality.
A methodology is needed to understand what really matters in measuring and identifying qualifying key performance indicators that are appropriate to a particular service delivery context. In government, the FSDM assessment framework scores eight key performance areas (KPAs), but the metrics and ratings used are broad, vague, and subjective. One of the KPAs, for instance, is queue management and waiting times; but this KPA is not scored against any queueing model, standards, or baselines. The same applies to the remaining seven KPAs.
Taking an international perspective, the World Bank report [21] on accountability in South Africa's public services confirms that one of the major reasons for service delivery issues is inadequate assessment (including monitoring and feedback) of the health of service delivery. The reason for this, according to Pricewaterhouse Coopers [22], may be that the public sector does not easily lend itself to the kind of shareholder return metrics that the private sector is used to. There is therefore an urgent need to develop techniques and tools to assess the health of the public service in South Africa; but first, the criteria that such techniques and tools must satisfy to achieve the desired result should be clearly defined.
1.3 Research question and study objectives
A clear definition of the research question is necessary to guide the entire literature review process [23]. Based on the challenges defined above, the research question is:
What criteria must a diagnostic tool satisfy to effectively support the closing of service delivery gaps?
The SLR will explore the following three objectives:
• Objective 1: Identify diagnostic service performance assessment (DSPA) tools in general. Rationale: The existing literature may already offer knowledge about effective SDPA tools that may be applicable to the South African context.
• Objective 2: Discover criteria that may be considered for DSPA tools to be effective. Rationale: The existing literature may already provide initial criteria for selecting an appropriate DSPA tool for a particular context.
Because of the many public unrest incidents in South Africa, in which people demand better service delivery, the term 'service delivery' is now loosely (wrongly, carelessly, and erroneously) used by the press. For that reason, and given that the term is not universally defined, we acknowledge the South African context and vernacular, and define ' service delivery' as the purveying of services (intangibles), goods (tangibles), and socio-economic dynamism (amenities, infrastructure, employment etc) by government and state-owned enterprises that enable the citizenry to live sustainably and to prosper.
2 RESEARCH METHODOLOGY
This study explores and extracts useful criteria for a service performance diagnostic tool in general, and specifically within the service delivery domain, by systematically reviewing the literature. The review is guided to a considerable extent by the eight-step guide to conducting a systematic literature review by Okoli and Schabram [24]. According to them, a systematic literature review (SLR) is a systematic, structured, all-inclusive effort to critically assess, extract, and integrate empirical evidence that meets pre-defined eligibility criteria in a complete, scientifically rigorous, and reproducible way. Their definition is supported by Kwan [25] and Tranfield et al. [26]. To date, no systematic review of the relevant criteria for a service delivery diagnostic tool has been published. Given government expenditure on service delivery, and the continued deficit with its consequential impact, it is timely that a considered effort be made to put together in a systematic way all works published around the subject. This study does exactly that by reviewing all published works in relevant academic journal databases and in some secondary information repositories. Table 1 outlines the steps followed in conducting the review.

The review's objectives are stated in Section 1.3 above. Although used mostly in the medical field, the Preferred Reporting Items for Systematic Reviews and Meta-Analysis (PRISMA) [27] checklist guided this review protocol. Table 2 summarises the protocol, elaborating on the execution of Steps 2 and 3 in Table 1.

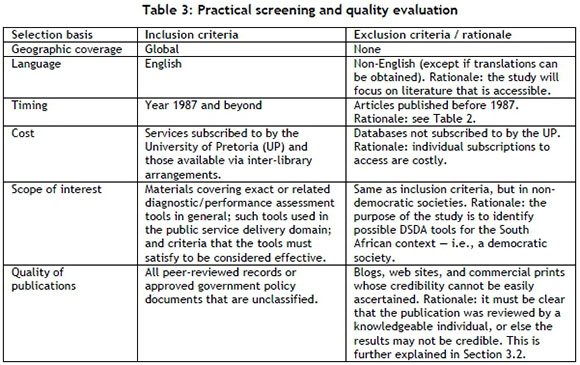
Table 3 shows the search scope and inclusion/exclusion criteria, elaborating on the execution of Steps 4 and 5 in Table 1.
For the execution of Steps 6 and 7 in Table 1, we used ATLAS.ti to extract data from the knowledge repositories and table the results in accordance with the three main objectives of the study.
3 RESULTS
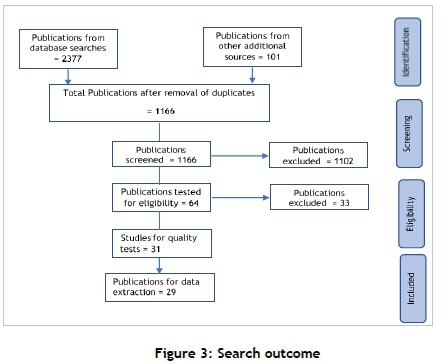
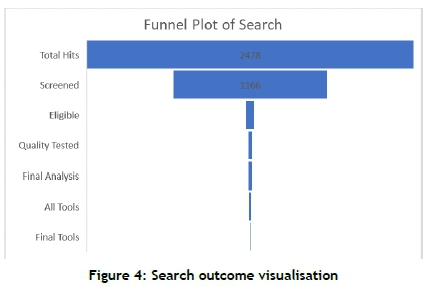
A total of 2377 publications were found, of which only 64 were evaluated for eligibility. Out of the eligible 64, only 29 made it to the final inclusion stage. However, not one of the included materials deals with the focus of this research: A systematic literature review of the criteria that a diagnostic tool must satisfy to be considered effective in closing service delivery gaps. Although there is a plethora of published works on (public) service delivery in general, there is a dearth of investigations into the criteria that an assessment tool must possess for it to diminish service delivery deficits.
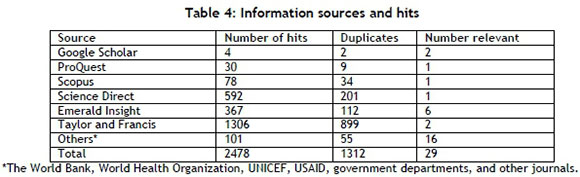
Figures 3 and 4 and Table 4 outline the initial counts of publications from some well-known databases, from inception to data extraction. Boolean logical operators were used to link the search terms in a way that ensures focus.
The search criteria required to address Objectives 1 and 2 of the study are:
["diagnostic tools" NOT ("health" OR "hospital")] AND "for assessing public service delivery".
Synonym phrases for "diagnostic tools" are also considered: "survey tools", "survey mechanisms", "survey models", "survey methodologies", "survey frameworks", "survey systems", "survey approaches", etc.
Some databases and search engines vary in the way that words and phrases are nested, but the inclusion and exclusion logic (the use of Boolean operators) remains generally the same. The challenge is that, to obtain the qualifying criteria of a service delivery assessment tool, the tool must have been empirically tested, evaluated, and validated by its developers (or others) for certain performance criteria. This is lacking in all but seven of the diagnostic/ survey tools covered, 13 of which focus on public services, four on the general service industry, and two on the manufacturing sector (included because of their closeness to service quality and performance assessments). Although there are many related service quality assessment tools (e.g., the ESQ model [28], the antecedents & mediator model [29], the INTSERVQUAL model [30], the DEA model [31], the IT-based model [32], etc.), SERVQUAL [33] meets the initial eligibility criteria for inclusion - first, because in addition to general quality metrics, it measures service performances; second, because it is widely applied in the public sector; and finally, because most other service assessment tools discovered are a variation or adaptation of SERVQUAL. It is deemed to be the most widely applied, followed by PETS and QSDS [34] of the World Bank Research Group. SERVQUAL, which has been modified/customised to form other assessment tools, serves as a diagnostic methodology to uncover wide areas of an organisation's quality and performance deficits. It has been applied extensively in many services sectors: public service delivery [35-43], public transportation [44-49], public and private healthcare [50-55], information systems [56-60], education [61-66], and hospitality [67-72]; and in many countries of the world: South Africa [44, 66, 73-75], Bangladesh [72], India [69, 71], Croatia [70], the United States and the United Kingdom [76], Thailand [64], Russia [63], Ghana [48, 49, 51], Malaysia [41], Egypt [37], and Cyprus [36], to mention only a few.
To ensure that the search strategy delivers quality outcomes for study objectives 1 to 3, a complementary search, using the snowballing procedure outlined by Wohlin [77], was adopted. This led to multiple iterations and the exclusion of 1135 publications, streamlining the final publications for data extraction.
Table 4 outlines the search hits by databases, duplicate counts, and the number considered to be relevant in the context of this study.
In summary, literature sources have been excluded (or included) based on the criteria defined in Table 2 (eligibility criteria) and Table 3 (timing, scope, etc.) and in Section 3.2 (quality assessment for tools eligibility).
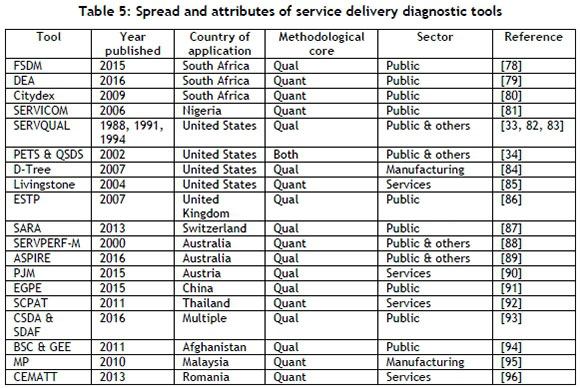
3.1 Spread and attributes of tools
Table 5 gives an indication of the distribution and spread of the tools included, addressing Objective 1 of this study, and clustering the tools according to their methodological core (i.e., quantitative, qualitative, or both).
3.2 Quality assessment for tools' eligibility
In this section we highlight the additional quality assessment criteria that were identified to select eligible tools for the study context. A tool was only short-listed if it met all the quality criteria. We applied the following quality assessment criteria:
1. Has the tool been tested in real life? Rationale: we make the assumption that tools that have been used by practitioners will have been refined, increasing their usability.
2. Has the tool been evaluated against key performance metrics? Rationale: we assume that the process of evaluation would have helped to improve the performance of the tool before it was used to assess the health of service delivery.
3. Are the performance metrics clearly defined? Rationale: ambiguous performance metrics will have a negative effect on the reliability of the measurement outcome.
4. Is the evaluation outcome documented? Rationale: authors occasionally allude to evaluations they have conducted without publishing the full outcome. Transparent evaluation outcomes are vital.
5. Are independent persons (not only the tools developers) involved in the tool's evaluation? Rationale: the criterion should eliminate potential bias in the evaluation of the tool.
Seven eligible tools meet the above five quality criteria: ESTP (extended service template process) [86], ASPIRE (area for evaluation, set goals, performance indicators, information sources, report results, evaluate) [89], BSC and GEE (balanced score card and generalised estimating equation) [94], CSDA (city service delivery assessment) [93], PJM (performance journey mapping) [90], EGPE (external government performance evaluation) [91], and the MP (manufacturing performance) tool [95].
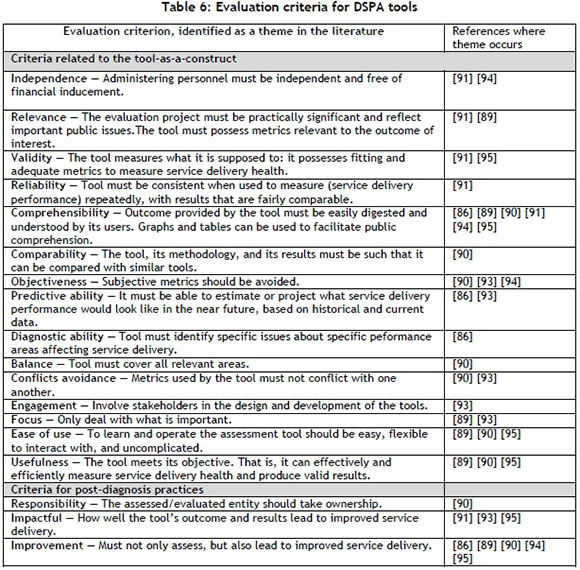
3.3 Evaluation criteria for effective tools
For Objective 2 of this study, we intended to discover criteria that DSPA tools must satisfy to be considered effective. Table 6 provides a summary of the criteria that we extracted from the literature.
4 DISCUSSION
In accordance with Objective 1 of the study, we identified 19 DSPA tools that may be useful for service delivery assessment. Furthermore, we identified five quality assessment criteria to reduce the list of identified DSPA tools as possible alternatives to consider in the South African context.
Addressing Objective 2, we extracted a list of 18 criteria from the literature that could serve as a starting point to compare the seven DSPA tools. The 18 criteria were clustered into two main categories: (1) Criteria related to a tool as a construct; and (2) criteria for post-diagnosis practices. The rationale for the categories is that some criteria relate to the built-in construction of the software tool, whereas others do not pertain to software construction, but rather to methodological practices that are associated with service delivery assessment. It is possible to perform a further prioritisation of the 18 criteria, based on the number of citations - e.g., Table 6 indicates that the most subscribed criterion is 'comprehensibility' (the outcome or results of DSPA tools must be easily understood, simple, and uncomplicated) - followed by 'improvement' (must not only assess, but also lead to improved service delivery).
An easy explanation would be that, typically, diagnostic tools are too complicated for the average user, and they are often not proven to lead to improved service delivery. Yet we propose that the criteria should rather be expanded and prioritised via a participative process, involving participants who know the particular service delivery context. Figure 5 presents a conceptual design of a decision-making process that incorporates the 18 criteria as a starting point for selecting a suitable DSPA tool.

5 CONCLUSION AND RECOMMENDATIONS
Despite the acknowledged service delivery surveys/assessments in South Africa, service delivery deficits and related unrest continue unabated [5]. Given the magnitude of this deficiency and its socio-economic impact, a new way/technique of diagnosis, grounded in relevant theories, evaluated for appropriate performance metrics, and tested for fitness of purpose, is urgently needed. To contribute to meeting this need, this study explored the literature in a systematic way to uncover any work by authors and researchers on that topic. A total of 2377 publications were identified during a broad search driven by the criteria defined in Section 3. Applying further eligibility criteria (Table 2) and inclusion/exclusion criteria (Table 3), only 29 made it to the final analysis stage. Notwithstanding these 29 papers, it is interesting to note that none dealt with the focus of this study. In the final analysis, and in line with the study objectives (Section 1.3), eight DSPA tools criteria were extracted. We propose that the eight criteria should be expanded and prioritised via a participative process, involving participants who know the particular service delivery context.
REFERENCES
[1] Skweyiya, Z. 1997. Transforming public service delivery. Pretoria: Department of Public Service and Administration. [ Links ]
[2] Mdlongwa, E.T. 2014. Local government at the heart of poor service delivery. Rhodes journalism review, 2014(34), p. 39. [ Links ]
[3] Public Service Commission. 2012. Report on the assessment of the effectiveness of the Batho Pele Policy in public service delivery. Public Service Commission publication, Arcadia, Pretoria. [ Links ]
[4] Stats SA. 2016. General household survey. Statistical release P0318, Pretoria, South Africa. [ Links ]
[5] Tirivangasi, H.M. and Mugambiwa, S.S. 2016. Citizenship crisis or xenophobia? A critical analysis of service delivery protest in South Africa. SAAPAM 5th Annual Conference Proceedings, pp. 41-48 [ Links ]
[6] Public Service Commission. 2014. The constitutional and legislative mandate of the Public Service Commission explained. Pretoria, South Africa. [ Links ]
[7] Public Service Commission. 2015. Service delivery improvement plan (SDIP): 2016/2017 - 2018/2019 financial years. Pretoria, South Africa. [ Links ]
[8] Pillay, G. 2016. HR challenges facing HR planning, management and development in the public sector in SA. Department of Public Service and Administration. Pretoria, South Africa. [ Links ]
[9] DPSA. 2016. Abridged DPSA service delivery charter 2016/2017. Department of Public Service and Administration. Pretoria, South Africa. [ Links ]
[10] Madale, C. 2014. DPME strategic plan 2015-2020. Department of Planning, Monitoring and Evaluation. The Presidency, Pretoria, South Africa. [ Links ] .
[11] Makwetu, K. 2017. General report on national and provincial audit outcomes. Auditor-General South Africa (AGSA). Pretoria, South Africa. [ Links ]
[12] NPC-SA. 2011. Diagnostic Overview of the National Planning Commission. National Planning Commission. Pretoria, South Africa. [ Links ]
[13] Makanyeza, C., Kwandayi, H.P. and Ikobe, B.N. 2013. Strategies to improve service delivery in local authorities. International Journal of Information Technology and Business Management, 15(1), pp. 1-11. [ Links ]
[14] Lancaster, L. 2016. At the heart of discontent: Measuring public violence in South Africa. Institute of Security Studies (ISS) South Africa. Paper 292. [ Links ]
[15] Runciman, C., Maruping, B. and Moloto, B. 2016. South Africa's rebellion of the poor: An overview. University of Johannesburg, South Africa. [ Links ]
[16] Shaidi, E.W. 2013. Investigation into causes of service delivery protests in municipalities: A case study of Nelson Mandela Bay Municipality. Nelson Mandela Metropolitan University, South Africa, p. 112 [ Links ]
[17] Alexander, P. 2010. Rebellion of the poor: South Africa's service delivery protests - A preliminary analysis. Review of African Political Economy, 37(123), pp. 25-40. [ Links ]
[18] Thompson, L. and Nleya, N. 2010. Community activisim and protest in Khayelitsha, Cape Town. African Centre for Citizenship and Democracy, University of the Western Cape, South Africa. 4(4), p.11. [ Links ]
[19] Nleya, N. 2011. Linking service delivery and protest in South Africa. Africanus, 50(1), pp.3-13. [ Links ]
[20] Sibanda, M.M.M. 2012. Monitoring customer focused quality service delivery in Local Government: Conceptual issues and perspectives for consideration. Africa's Public Service Delivery and Performance Review, 1(1), pp. 1-20. [ Links ]
[21] The World Bank. 2015. Access to Electricity (% of Population). Sustainable energy for All (SE4ALL). Available at: https://data.worldbank.org/indicator/EG.ELC.ACCS.ZS [Accessed: 5 February 2018] [ Links ]
[22] PWC. 2013. Improving public sector productivity through prioritisation, measurement and alignment. New approaches for how the public sector improves productivity, PricewaterhouseCoopers, Australia. [ Links ]
[23] Kitchenham, B. and Charters, S. 2007. Guidelines for performing systematic literature reviews in software engineering. Joint Report of Keel University and Durham University, pp. 6-30 [ Links ]
[24] Okoli, C. and Schabram, K. 2012. A Guide to conducting a systematic literature review of information systems research. Sprouts: Working papers on information systems, pp. 10-26. [ Links ]
[25] Kwan, B.S.C. 2006. The schematic structure of literature reviews in doctoral theses of applied linguistics. English for specific purposes, 25(1), pp. 30-55. [ Links ]
[26] Tranfield, D., Denyer, D. and Smart, P. 2003. Towards a methodology for developing evidence-informed management knowledge by means of systematic review. British Journal of Management, 14(3), pp. 207-222. [ Links ]
[27] Moher, D., Liberati, A., Tetzlaff, J. and Altman, D.G. 2009. Preferred reporting items for systematic reviews and meta-analysis protocols (PRISMA-P), Systematic reviews, 4(1). [ Links ]
[28] Santos, J. 2003. E-service quality: a model of virtual service quality dimensions. Managing Service Quality, 13(3), pp. 233-246. [ Links ]
[29] Dabholkar, P.A., Shepherd, C.D. and Thorpe, D.I. 2000. A comprehensive framework for service quality: an investigation of critical conceptual and measurement issues through a longitudinal study. Journal of Retailing, 76(2), pp. 139-173. [ Links ]
[30] Frost, F.A. and Kumar, M. 2000. INTSERVQUAL - an internal adaptation of the GAP model in a large service organisation. Journal of Services Marketing, 14(5), pp. 358-377. [ Links ]
[31] Soteriou, A.C. and Stavrinides, Y. 1997. An internal customer service quality data envelopment analysis model for bank branches. International Journal of Operations & Production Management, 17(8), pp. 780789. [ Links ]
[32] Zhu, F.X., Wymer, W. and Chen, I. 2002. IT-based services and service quality in consumer banking. International Journal of Service Industry Management, 13(1), pp. 69-90. [ Links ]
[33] Parasuraman, A., Zeithaml, V.A. and Berry, L.L. 1988 SERVQUAL: a multiple-item scale for measuring consumer perceptions of service quality. Journal of Retailing, 64(1), pp. 12-40. [ Links ]
[34] Reinikka, R. and Svensson, J. 2002. Assessing Frontline Service Delivery. World Bank/Development Research Group, Washington DC, 20433. [ Links ]
[35] Mik, W. 2001. Using SERVQUAL to assess customer satisfaction with public sector services. Managing Service Quality: An International Journal, 11(6), pp. 380-388. [ Links ]
[36] Iyikal, O.C. and Celebi, A. 2016. Investigating a quality of services in the public sector: evidence from northern Cyprus. Journal of Economic and Social Development, 3(2). [ Links ]
[37] Ali, M.A. and Yaseen, E.A. 2014. Service quality in public services - A study in urban Egypt. German University in Cairo, Cairo Egypt. [ Links ]
[38] Alexandria, B. and Adrienne, C. 2001. Service improvements in public services using SERVQUAL: Managing Service Quality: An International Journal, 11 (6) pp. 389-401. [ Links ]
[39] Ramseook-Munhurrun, P. and Lukea-Bhiwajee, S.D. 2010. Service quality in the public service. International Journal of Management and Market Research, 3(1), pp. 37-50. [ Links ]
[40] Martinovic, M., Pavlic, I. and Tolic, M.S. 2017. Measurement of local Public service's quality using SERVQUAL: The case of Dubrovnik. University of Dubrovnik, Croatia. [ Links ]
[41] Ilhaamie, A.G.A. 2010. Service quality in Malaysian public service: Some findings. International Journal of Trade, Economics and Finance, 1(1) pp. 40-45. [ Links ]
[42] Prodromos, C., Dimitrios, C., Eftichia, V. and Eleni, L. 2014. Measuring citizen satisfaction using the SERVQUAL approach: The case of the Hellenic Post. Procedia Economics and Finance, 9(Supplement C), pp. 349-360. [ Links ]
[43] Brysland, A. and Curry, A. 2011. Service improvements in public services using SERVQUAL. Managing Service Quality: An International Journal, 11 (6), 389-401. [ Links ]
[44] Luke, R. and Heynes, G. 2017. Measuring commuters perceptions of service quality of selected public bus services in the City of Johannesburg. 36th Southern African Transport Conference, CSIR ICC, Pretoria, South Africa. [ Links ]
[45] Randheer, K., AL-Motawa, A.A. and Prince, V.J. 2011. Measuring commuters' perception on service quality using SERVQUAL in public transportation. International Journal of Marketing Studies, 3(1), pp. 2134. [ Links ]
[46] Muthupandian, K.S. and Vijayakumar, C. 2012. Measurement of passengers' service quality in public transportation: Servqual analysis. Business Plus, 1(5), pp. 1-9. [ Links ]
[47] Barabino, B., Deiana, E. and Tilocca, P. 2012. Measuring service quality in urban bus transport: a modified SERVQUAL approach. International Journal of Quality and Service Sciences, 4(3), pp. 238-252. [ Links ]
[48] Ojo, T.K., Mireku, D.O., Dauda, S. and Nutsogbodo, R.Y. 2014. Service quality and customer satisfaction of public transport on Cape Coast-Accra Route, Ghana. Developing Country Studies, 4(18), pp. 142-149. [ Links ]
[49] Sam, E.F., Hamidu, O. and Daniels, S. 2017. SERVQUAL analysis of public bus transport services in Kumasi metropolis, Ghana: Core user perspectives. Case Studies on Transport Policy, 6(1), pp. 25-31 [ Links ]
[50] Purcãrea, V.L., Gheorghe, L.R. and Petrescu, C.M. 2013. The Assessment of perceived service quality of public health care services in Romania using the SERVQUAL Scale. Procedia Economics and Finance, 6(Supplement C): p. 573-585. [ Links ]
[51] Peprah, A.A. and Atarah, B.A. 2014. Assessing patient's satisfaction Using SERVQUAL model: A case of Sunyani regional hospital, Ghana. International Journal of Business and Social Research, 4(2): pp.133-143. [ Links ]
[52] Butt, M.M. and Cyril de Run, E. 2010. Private healthcare quality: applying a SERVQUAL model. International Journal of Health Care Quality Assurance, 23(7), pp. 658-673. [ Links ]
[53] Kalaja, R., Myshketa, R. and Scalera, F. 2016. Service quality assessment in health care sector: The case of Durres public hospital. Procedia - Social and Behavioral Sciences, 235 (Supplement C), pp. 557-565. [ Links ]
[54] Pekkaya, M., Imamoglu, O.P. and Koca, H. 2017. Evaluation of healthcare service quality via Servqual scale: An application on a hospital. International Journal of Healthcare Management, pp. 1-8. [ Links ]
[55] Chakraborty, R. and Majumdar, A. 2011. Measuring consumer satisfaction in health sector: The applicability of SERVQUAL. Journal of Arts, Science & Commerce, 11(4) pp. 149-160. [ Links ]
[56] Leyland, F.P., Richard, T. W. and Kavan, C. B. 1995. Service quality: A measure of information systems effectiveness. MIS Quarterly, 19(2), pp. 173-187. [ Links ]
[57] James, J.J., Gary, K., Parolia, N. and Li, Y. 2012. An Analysis of Three SERVQUAL variations in measuring information system service quality. The Electronic Journal Information Systems Evaluation, 15(2), pp. 149-162. [ Links ]
[58] Whitten, D. 2004. Information systems service quality measurement: The evolution of the SERVQUAL instrument. Journal of International Technology and Information Management, 13(3), pp. 181-192. [ Links ]
[59] Landrum, H., Prybutok, V., Zhang, X. and Peak, D. 2009. Measuring IS system service quality with SERVQUAL: Users' perceptions of relative importance of the five SERVPERF dimensions. Informing Science: The International Journal of an Emerging Transdiscipline, 12, pp. 17-35. [ Links ]
[60] Roses, L.K., Hoppen, N., Ballaz, B. and Freire, k. 2016. Quality Evaluation in Information Systems Outsourcing. Lecture Notes in Informatics (LNI)-Proceedings, pp. 268-280. [ Links ]
[61] Donlagic, S. and Fazlic, S. 2015. Quality assessment in higher education using the SERVQUAL Model. Management, 20(1), pp. 39-57. [ Links ]
[62] Krsmanovic, M., Horvat, A. and Ruso, J. 2014. Application of SERVQUAL model in high education. 11th International conference "Standardization, protypes and quality: A means of balkan countries' collaboration", Belgrade, Serbia. [ Links ]
[63] Galeeva, R.B. 2016. SERVQUAL application and adaptation for educational service quality assessments in Russian higher education. Quality Assurance in Education, 24(3), pp. 329-348. [ Links ]
[64] Yousapronpaiboon, K. 2014. SERVQUAL: Measuring higher education service quality in Thailand. Procedia - Social and Behavioral Sciences, 116 (Supplement C), pp. 1088-1095. [ Links ]
[65] Abili, K., Thani, F.N. and Afarinandehbin, M. 2012. Measuring university service quality by means of SERVQUAL method. Asian Journal on Quality, 13(3), pp. 204-211. [ Links ]
[66] Green, P. 2014. Measuring service quality in higher education: A South African case study. Journal of International Education Research, 10(2). [ Links ]
[67] Mei, A.W.O., Dean, A.M. and White, C.J. 1999. Analysing service quality in the hospitality industry. Managing Service Quality: An International Journal, 9(2) pp. 136-143. [ Links ]
[68] Al-Ababneh, M.M. 2017. Service quality in the hospitality industry. Journal of Tourism & Hospitality, 6(1). [ Links ]
[69] Kalotra, A.K. and Sharma, N. 2017. Measuring service quality using SERVQUAL in hospitality industry: A study of Delhi. International Journal of Emerging Research in Management &Technology, 6(1). [ Links ]
[70] Markovi'c, S. and Raspor, S. 2010. Measuring perceived service quality using Servqual: A case study of the Croatian hotel industry. Management, 5(3). [ Links ]
[71] Amballoor, R.J. 2015. Servqual model: An analysis of hospitality sector in Goa. Asian Journal of Managerial Science, 4(1), pp. 23-26. [ Links ]
[72] Mazumder, S. and Hasan, A.B.M.R. 2014. Measuring service quality and customer satisfaction of the hotels in Bangladesh: A study on national and international hotel guests. Journal of Tourism and Hospitality Management, 2(1), pp. 95-111. [ Links ]
[73] Van der Wal, R.W.E., Pampaiiis, A. and Bond, C. 2002. Service quality in a cellular telecommunications company: a South African experience. Managing Service Quality, 12(5), pp. 323-335. [ Links ]
[74] Pitt, L., Berthon, P., Prendegast, G. and Nei, D. 2015. On the reliability and validity of the Servqual instrument in South Africa. Proceedings of the 1996 Academy of Marketing Science (AMS) Annual Conference, Phoenix, Arizona. pp. 164-164. [ Links ]
[75] Simpson, A.P. and Caiitz, A.P. 2015. Adapted SERVQUAL for evaluating the provision of information as an agricultural extension service in South Africa. South African Journal of Agricultural Extension, 43(2). [ Links ]
[76] Lai, J.Y. 2006. Assessment of employees' perceptions of service quality and satisfaction with e-business. International Journal of Human-Computer Studies, 64(9), pp. 926-938. [ Links ]
[77] Wohiin, C. 2014. Guidelines for snowballing in systematic literature studies and a replication in software engineering. Embedded Applications Software Engineering, Proceedings of the 18th International Conference on Evaluation and Assessment in Software Engineering, Article No. 38, England, United Kingdom. [ Links ]
[78] DPME. 2015. Frontline service delivery monitoring assessment framework. Department of Planning, Monitoring and Evaluation, Pretoria, South Africa. [ Links ]
[79] Brettenny, W. and Sharp, G. 2015. Efficiency evaluation of urban and rural municipal water service authorities in South Africa: A data envelopment analysis approach. Nelson Mandela Metropolitan University, South Africa. [ Links ]
[80] Steven, H. 2009. Service Delivery Index. Economic Empowerment Rating Agency, Johannesburg, South Africa. [ Links ]
[81] SERVICOM. 2006. The Service Compact with All Nigerians. National Information Technology Development Agency. Available at: https://nitda.gov.ng/nit/servicom/. [Accessed: 5 February 2018] [ Links ]
[82] Parasuraman, A., Zeithami, V.A. and Berry, L.L. 1991. Refinement and reassessment of the SERVQUAL scale. Journal of Retailing, 67(4) pp. 420-450. [ Links ]
[83] Parasuraman, A., Zeithami, V.A. and Berry, L.L. 1994. Alternative scales for measuring service quality: a comparative assessment based on psychometric and diagnostic criteria. Journal of Retailing, 70(3), pp. 201-230. [ Links ]
[84] Waiiace, J.H., Seyed, M.R.I. and Shou, B. 2007. A diagnostic tree for improving production line performance. Production and Operations Management, 16(1), pp. 77-92. [ Links ]
[85] Siamak, T. and Xuehong, S. 2004. Inference techniques for diagnosis based on set operations. American Institute of Aeronautics and Astronautics, 1(1), pp. 1-8. [ Links ]
[86] Wiiiiams, C.S., and Saunders, M. 2007. Improving service quality in the new public sector. The Routledge Companion to Nonprofit Marketing, pp. 389-402. [ Links ]
[87] O'Neiii, K., Takane, M., Sheffei, A., Abou-Zahr, C. and Boerma, T. 2013. Monitoring service delivery for universal health coverage: the Service Availability and Readiness Assessment (SARA). Bulletin of the World Health Organization, 91(12), pp. 923-931. [ Links ]
[88] Fogarty, G., Catts, R. and Foriin, C. 2000. Identifying shortcomings in the measurement of service quality. Journal of Outcome Measurement, 4(1), pp. 425-447. [ Links ]
[89] Uy, J., Lizarondo, L. and Atias, A. 2016. ASPIRE for quality: a new evidence-based tool to evaluate clinical service performance. BMC Research Notes, 9(306). [ Links ]
[90] 90.Höber, A., Pergier, E., Weitianer, D. and Grahsi, H. 2015. Performance journey mapping: a service performance assessment framework. The Total Quality Management Journal, 27(2), pp. 231-246. [ Links ]
[91] Yu, W. and Ma, L. 2016. External Government Performance Evaluation (EGPE) in China: Evaluating the Evaluations. Public Performance & Management Review, 39(1), pp. 144-171. [ Links ]
[92] Banomyong, R. and Supatn, N. 2011. Developing a supply chain performance tool for SMEs in Thailand. Supply Chain Management: An International Journal, 16(1), pp. 20-31. [ Links ]
[93] Ross, I., Scott, R., Biackett, I. and Hawkins, P. 2016. Fecal sludge management: Diagnostics for service delivery in urban areas - summary report. World Bank Group - Water and Sanitation Program, Balikpapan, Indonesia. [ Links ]
[94] Edward, A., Kumar, B., Kakar, F., Saiehi, A.S., Burnham, G. and Peters, D.H. 2011. Configuring balanced scorecards for measuring health system performance: Evidence from 5 years' evaluation in Afghanistan. PLoS Medicine, 8(7). [ Links ]
[95] Amrina, E. and Yusof, S.M. 2010. Manufacturing Performance Evaluation Tool (MPET) for Malaysian automotive small and medium sized enterprises. International Journal of Business and Management Science, 3(2), pp. 195-213. [ Links ]
[96] Aiexa, V., Kiss, I. and Ratiu, S. 2013. Diagnostic analysis - Tool in research and innovation. International Journal of Engineering, 11(4). [ Links ]
Submitted by authors 15 /Mar 2018
Accepted for publication 28 Jan 2019
Available online 29 /May 2019
* Corresponding author. u16404808@tuks.co.za
# The author was enrolled for a PhD degree in the Department of Industrial and Systems Engineering, University of Pretoria, South Africa

