


Services on Demand
Article
 English (pdf)
 Article in xml format
 Article references
Indicators

Related links
-
 Cited by Google
 -
 Similars in Google
Share

 Permalink
South African Journal of Industrial Engineering
On-line version ISSN 2224-7890
Print version ISSN 1012-277X
S. Afr. J. Ind. Eng. vol.29 n.4 Pretoria Dec. 2018
http://dx.doi.org/10.7166/29-4-1670
CASE STUDIES
Structural model to assess the relationship of manufacturing practices to delivery time in supply chains
L. Avelar-SosaI, *; M. MataveliII; J.L. García-AlcarazI
IDepartment of Industrial Engineering and Manufacturing, Autonomous University of Ciudad Juarez, Mexico
IIEconomics and Business Department, University of La Rioja, Spain
ABSTRACT
The literature suggests that companies today evaluate the delivery time of their products/services to improve their performance in supply chains, which has great importance due to the global competition and trends in the current markets. In response, this paper analyses the effects that manufacturing practices have on the delivery time in a supply chain. A survey was conducted relating to the export activities applied in maquiladoras companies located in Ciudad Juarez (Mexico). In the form of a questionnaire that was distributed to managers, supervisors, and operators. The questions were associated with manufacturing practices dimensions: 1) just in time (JIT), 2) total productive maintenance (TPM), 3) total quality management (TQM), along with a fourth dimension of delivery time. Five hypotheses were raised to determine the causal relationships between the dimensions analysed in a structural equation model (SEM) and tested using the partial least squares (PLS) technique integrated into the WarpPLS 4.0 software. The findings revealed that JIT has a positive and strong effect on delivery time. In addition, TQM and TPM have positive effects on JIT, enabling the timely delivery of products and better customer satisfaction. Additionally, respondents considered the implementation of manufacturing practices in the processes to be appropriate.
OPSOMMING
Die literatuur toon dat maatskappye deesdae die lewertyd van hulle produkte of dienste beoordeel om sodoende hul voorsieningsketting vertoning te verbeter. Dit is baie belangrik as gevolg van globale mededinging en tendense in die markte. Hierdie artikel analiseer die effek wat vervaardigingspraktyke op die lewertyd in 'n voorsieningsketting het. 'n Peiling is van stapel gestuur na die uitvoeraktiwiteite van maatskappy in Ciudad Juarez (in Meksiko). Die meningspeiling is aan bestuurders, toesighouers en operateurs versprei. Die vrae is geassosieer met vervaardigingspraktyke, naamlik 1) net-in-tyd, 2) totale produktiewe instandhouding, 3) totale gehaltebestuur tesame met lewertyd as n vierde dimensie. Vyf hipotese is geformuleer om die oorsaaklike verhoudings tussen die vier dimensies te bepaal. Die dimensies is met behulp van n strukturele vergelykingmodel analiseer en getoetse met die parsiële kleinste vierkante tegniek wat in die WarpPLS 4.0 sagteware geïntegreer is. Die bevindings toon dat net-in-tyd n sterk positiewe invloed op lewertyd het. Verder het beide totale gehalte bestuur en totale produktiewe instandhouding n positiewe invloed op net-in-tyd. Dit bewerkstellig die tydige lewer van produkte en verbeterde kliëntbevrediging. Verder het respondente die implementering van vervaardigingspraktyke as gepas gereken.
1 INTRODUCTION
Competitiveness in the environment of globalisation highlights the importance of becoming more efficient in the implementation of operational and administrative processes to improve customer service levels, lead times, and quality in products or services, and to optimise resources [1]. Nowadays, companies from different economic sectors adopt manufacturing strategies focused on continuous improvement to achieve positive changes in productivity and product quality and in managing their supply chains [2]. For example, these manufacturing strategies were essential for the Toyota production system to achieve the efficient use of resources by reducing waste in different areas. These included the reworking of defects, unnecessary steps in the process, unnecessary material and personnel movements, waiting time, excess inventory, and overproduction [3]. This approach has become a key factor for organisations in the adoption of tools and practices to improve their competitiveness in the market.
The manufacturing practices currently used to integrate and manage the supply chain for inbound and outbound logistics include: 1) total quality management (TQM), 2) just in time (JIT), 3) total productive maintenance (TPM), 4) Kaizen, 5) single-minute exchange of die (SMED), 6) 5s, 7) Kanban, 8) Poka Yoke, and 9) Six Sigma, among others [3, 4].
JIT is defined as a manufacturing approach, first used in Japan, that emphasises the importance of achieving continuous improvement in all phases of production, and includes the participation of all involved parties in the supply chain from an intra- and inter-organisational point of view [4, 5]. JIT is focused on increasing customer satisfaction, and is a key tool to achieving better results in the operational and financial performance of companies [6]. JIT is also applicable to different industrial sectors in which substantial benefits in enterprises are obtained: by implementing JIT, companies can respond to customer needs, promote perfect production activities, and conduct adequate levels of quality, cost, and delivery [7]. Due to the high level of importing and exporting materials in Ciudad Juárez and the characteristics of the maquiladoras in this region (a maquiladora is a company that imports products with ranceles and preferential customs tariffs, whose product is sold in the country of origin of the raw material), it is possible to apply the JIT philosophy in its processes. This would be vitally important to improving the productive processes and supply chain effectiveness. Ciudad Juárez had 321 maquiladoras in December 2016, giving direct employment to 266,251 workers; so this is the motivation for analysing these aspects of manufacturing in the maquiladoras in this region of Mexico.
Total quality management (TQM) is a firm-wide management philosophy of continuously improving the quality of products, services, and processes by focusing on the customers' needs and expectations in order to enhance customer satisfaction and the firm's performance. There are mixed results concerning the relationship between TQM practices and performance [[8]]. TQM is responsible for organisational management, and focuses on the quality and activities of all members of the organisation to achieve success through customer satisfaction [9]. TQM is also used to integrate business operations and create products or services with the best possible quality. To be successful in the future, a global marketer must develop excellent quality management systems that can impress consumers by fulfilling on-time deliveries and continuously providing excellent quality products in the 21st century [10].
The objective of the maintenance of machines and equipment is to achieve a certain level of availability of production with the highest quality, at the lowest cost, and with maximum security for those who use it. Maintenance in machines and equipments is a breeding programme that establishes a system of comprehensive Total Productive Maintenance (TPM) throughout the life of the equipment used in the processes, and it covers everything related with the team and the participation of employees. The purpose of TPM is to achieve rapid improvement in manufacturing processes to reduce failures and to integrate machines and equipment with people [11]. It also ensures the effectiveness of the equipment and production facilities, reduces the necessary investment in them, and increases the flexibility of the productive system.
TQM, JIT, and TPM all strive for continuous improvement, reduced waste, and improved performance in an organisation [12]. By combining these techniques, a comprehensive and consistent set of manufacturing practices can be derived to improve a firm's performance. Therefore many manufacturing firms consider a simultaneous implementation of these improvement programmes in order to achieve synergy [11]. Several studies on TQM, JIT, and TPM explore these improvement programmes and their relationship with performance [9, 13-16]. Some works have empirically investigated the existing relationships between different improvement programmes [12, 17].
However, some research approaches try to identify conceptually the value of the simultaneous implementation and stimulation of different improvement programmes [17]. The purpose of this empirical study is to identify the effects of the respective programmes' application on manufacturing firms, and to analyse the results in operational performance - i.e., in delivery. In particular, this study analyses the relationships with two basic objectives: 1 ) to identify the topic to be studied and to contribute a criterion for defining the usefulness and success of these practices in the field; and 2) to discuss the contribution of implementing these practices in order to point out any gaps for future research. The data set is constructed from the responses of a regional sample of manufacturing employees, and is assessed for dimensionality, validity, and reliability. The technique used is a conventional path analysis and partial least squares (PLS).
The study is divided into four parts, with this first part devoted to the introduction. The second part provides details on the theoretical background and conceptual framework. The third part discusses the methodology followed to accomplish the research objectives. Finally, in the fourth part, the results are discussed with reference to the contributions, industrial implications, and gaps found in the model. Conclusions are provided, together with the challenges that future research will have to address, and the implications of the findings for management.
2 THEORICAL BACKGROUND AND CONCEPTUAL FRAMEWORK
2.1 TQM context and hypotheses
Currently, there is no consensus about, or a universal definition for TQM [18,19]; but it can be defined as "an approach that focuses on improving the organisation's effectiveness, efficiency and responsiveness to customer's and other stakeholder's needs by actively harnessing people's skills and competencies in the pursuit of achieving sustained improvements to organisational performance" [20]. Some earlier empirical studies have emphasised the role of TQM in previous decades. In the area of operations management research, TQM has been an important subject for study and development, and it is currently considered a methodology for implementing JIT. According to Teeravaraprug, Kitiwanwong and SaeTong [21], TQM should be implemented before lean production, and it correlates with JIT. They found that TQM and JIT improve supply chain management and the response to customers' needs. Most previous studies show a positive relationship between TQM practices and business performance [22-24], while other studies report only a partial correlation between the two [25, 26].
Therefore, two hypotheses are proposed regarding TQM:
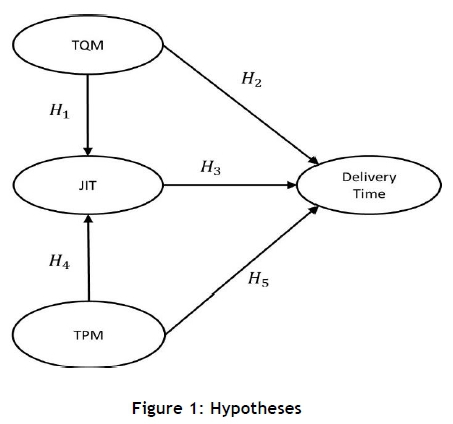
H1 : The application of a total quality management programme has a direct and positive effect on just in time.
H2: The good practice of a total quality management programme has a direct and positive effect on the reduction of delivery time.
2.2 JIT context and hypotheses
In order to reduce lead times or eliminate waste in the supply chain, a series of reengineering strategies have been implemented by companies since the early 1980s with the implementation of JIT. The process began with reducing the lead time, and then a simplified and integrated approach to materials planning was developed, integrating the vendor. JIT in the production system refers to the adoption of practices aimed at reorganising the shop floor and streamlining production flows into plants [27]. JIT allows for the better integration of the entire supply chain (marketing, distribution, customer service, purchasing, and production functions) into one controlled process. With waste elimination, the production process is simplified, allowing for a reduction in set-up times, controlling material flows, and emphasising preventive maintenance to improve supply chain management. JIT is one of the bundles of lean manufacturing and it is required to improve business performance [28, 11]. Research indicates that the implementation of JIT has a positive relationship with a reduction in delivery time, allowing companies to improve their delivery performance significantly [14].
The hypothesis that arises from this implication is the following:
H3: The good practice of a just in time system has a direct and positive effect on the reduction of delivery time.
2.3 TPM context and hypotheses
A TPM programme is a comprehensive improvement programme that originates from the concept of zero defects in TQM, and that is applied to control equipment performance [13]. TPM's objective is to achieve a reliable manufacturing system [29] by maximising overall equipment effectiveness [30]. McKone et al. [31] analysed the relationship between TPM and business performance using lean production as a mediator variable. The results showed that TPM has a positive and significant direct relationship, through lean production, on improving costs, quality, and delivery time. TPM programmes are significantly supported by TQM for improving business performance, as mentioned by Konecny and Thun [11] and Teeravaraprug et al. [21], who studied the relationship between TQM and TPM, finding that these should be implemented before lean production. From these findings, two hypotheses can be established:
H4: The good practice of TPM has a direct and positive effect on just in time.
H5: Appropriate TPM management has a direct and positive effect on delivery time.
Considering the previous context and studies of these subjects, the proposed model and hypotheses are shown in Figure 1, where the relationships between the analysed variables can be observed, identifying the values between them.
3 METHODOLOGY
3.1 Motivation and studied variables
A survey method was used in this study to obtain the data used in the empirical model. Some authors argue that survey methods can provide better reliability than qualitative approaches [32, 33], and thus they are often adopted to discuss organisational issues. The focus of the analysis in this study is on the relationships among TQM, JIT, TPM, and delivery time within the supply chain.
Maquiladoras are foreign companies in Mexico that are focused on importing raw material, transforming them into finished products on Mexican territory, and then exporting them to their country of origin. This kind of company has increased over the years as a consequence of the North American Free Trade Agreement (NAFTA) [34]. In Ciudad Juárez (Mexico), there were 321 active maquiladoras in December 2016, giving direct employment to more than 266 people, with 251 being local [35, 36]. This is an important factor in the economic development of the region. Historically, the manufacturing industry has accounted for 20 per cent of the Mexican gross domestic product (GDP), and the manufacturing activities have represented between eight and ten per cent of employment nationally [35, 37].
The performance of the manufacturing sector has been able to improve the economic growth of the country, particularly of the region studied here; and for this reason, the manufacturing sectors are highly relevant in the Mexican labour market.
Manufacturing practices in maquiladoras are very important because they belong to global supply chains, with customers in many countries. To discover the relationships proposed in Figure 1, it is necessary to know the current status of the use of these techniques; this explains the interest in the maquiladora sector, because the practical aspects of implementing these tools are not known, or have not been studied yet.
3.2 Sampling and data collection
For the survey, simple random sampling was used to consider all the active export manufacturing firms operating in Ciudad Juarez; 320 companies were identified. Later, a stratified sampling that focused on companies that have implemented JIT, TQM, and TPM, and have delivery product activities, was used.
The companies were contacted through the Association of Maquiladoras of Ciudad Juarez (AMAC) - now named Index Juarez -, through their monthly meeting, and through electronic mails. Subsequently, the survey was directed to 516 persons working in the supply chain areas of the maquiladoras, including purchasing and supplier planners, supervisors, engineers, managers, and directors of operations, because they have more reliable information about these issues [38]. After three months, 225 persons answered the survey electronically on a specialised survey platform, and by personal email; and their level of participation was satisfactory.
3.3 Measurement
The measurement approach for each theoretical construct in the proposal model is described in the subsections below. A multi-item scale and five-point response formats were used to operationalise all items. The survey was answered on a Likert scale, with values between 1 and 5 [41], as this has been used in similar studies [17, 39, 40]. The initial survey was given to 25 engineers in manufacturing industries who worked in a manufacturing production process and had collaboration activities in the supply chain; this test was applied to provide validation. All the items forming the constructs were adapted from a scale by Bhatnagar and Sohal [42], and, in some cases, were validated from other authors.
3.3.1 Total quality management: TQM
The TQM construct refers to the use (by the company) of certain tools in the manufacturing processes, to integrate the operational quality in the processes. This construct was formed by three items taken from, and used by, Bhatnagar and Sohal [40] and Soin [42]:
TQM43: Our company always applies statistical process control.
TQM44: Our company always applies quality audit processes.
TQM45: Our company always applies the Six Sigma methodology in its processes.
3.3.2 Just in time: JIT
The JIT dimension was aimed to identify waste elimination and its adoption as a philosophy in the production process. This construct has two items adapted from the studies of Bhatnagar and Sohal
[42] and Soin [40]:
JIT46: Our company uses the just in time philosophy in all manufacturing processes.
JIT47: Our company is always focused on inventory reduction.
3.3.3 Total productive maintenance: TPM
The TPM dimension was made up of three items that focused on identifying the use of TPM programmes in companies to find their contribution to the production system. This construct was adapted from Bhatnagar and Sohal [42] and Bhatnagar et al. [43]:
Maint48: Our company offers preventive and predictive maintenance programmes.
Maint49: The performance of the preventive and predictive maintenance programmes is effective.
Maint50: Rapid changes in the processes within the company are effective and efficient.
3.3.4 Delivery time: Delivery
This construct has two items, and is characterised by evaluating the timely deliveries achieved by the company in order to accomplish customers' requirements. It was included to analyse a fragment of supply chain performance, and was adapted from Bhatnagar and Sohal [42] and Bhatnagar et al. [43].
Delivery54: Deliveries of our products are made using the just in time philosophy.
Delivery55: The company always provides complete orders.
3.4 Collected information and validation
The collected information was captured and analysed using SPSS software to find the measures of central tendency and position, and to detect outliers and missing values. A standardised value greater than four was considered an extreme value [44-46]. The average variance extracted (AVE) was used as an indicator of discriminant validity and convergent validity assessment, considering recent studies in supply chain surveys [17, 39]. For this case, the correlations between variables were evaluated with a cutoff value of 0.50, as recommended by Kock [47] and Green et al. [48]. Internal consistency was evaluated by examining the composite reliability and Cronbach's alpha index of each construct, with values above 0.70 being accepted [17, 67]. Since it is possible to have collinearity among constructs, the variance inflation factor (VIF) was used to detect it, with the rule that this value should be less than 3.3 in every construct [68, 69, 70]. Parametric predictive validity was measured using the R2 and R2 adjusted, but the Q2 was used as a nonparametric measure [66, 70].
3.5 Structural equation model
Since the latent variables in the proposed model are integrated with other observed variables to find the relationships among them, the structural equation model technique (SEM) was used because it is recommended for a small sample size and non-normal and ordinal data - as in this case [49]. SEM was used by Green et al. [48] for finding the association between JIT and supply chain performance. García et al. [17] evaluated the factors to be considered in JIT implementation. Other authors also used SEM to study different aspects of logistics polices on supply chain performance [39] and of regional infrastructure and services on supply chain performance.
Relationships between variables, shown as hypotheses in Figure 1, were validated using WarpPLS 4.0 [46]. Four model fit indices were evaluated: (1) the average R2 (ARS), (2) the average path coefficient (APC), (3) the average variance inflation factor (AVIF), and (4) the Tenenhaus goodness of fit (GoF), which looks for values larger than 0.36 [47] according to recommendations [50]. For the APC and ARS, the P-values are analysed to determine the efficiency of the model, with a maximum cutoff P-value of 0.05. The null hypothesis being tested is that APC and ARS are zero, against the alternative hypothesis that they are different from zero.
Three effects among the variables were estimated next:
• Direct effects were measured to validate the proposed hypotheses (see Figure 1 ), displayed with lines and arrows. These effects indicated a direct relationship between the constructs. Every kind of effect was validated, considering the following hypotheses:
• Indirect effects occur when a construct has an effect on other constructs, but uses a third variable - a mediator - and using two or three segments. That is to say, some constructs can have an indirect effect on others/ For example: TPM indirectly affects delivery time through JIT.
• The total effects between the constructs are the sum of the direct and indirect effects. Every effect is measured using the hypotheses stated in equations (1 ) and (2), with a 95 per cent confidence level.

4 RESULTS
4.1 Information analysis and sample description
After completing the data collection process, 225 questionnaires were considered to be representative samples for the study. Table 1 shows the industrial sector and the gender of the respondents; 156 people were male and only 58 female. For the industrial sector, 54 persons were working in electronics, 39 in medical, and 67 in automotive. 11 people did not specify their sector and/or gender.
For the workforce and experience shown in Table 2, it can be observed that this includes 50 respondents who were planners, 24 technicians, 40 supervisors, and 54 managers. Only three respondents were operations directors. Eleven people did not answer the questionnaire, and 20 people did not answer about their experience. The results also indicated that more than 50 per cent of the respondents (136 persons) have more than four years of experience in their job, which is relevant because they provide reliable information in this field.

4.2 Data validation
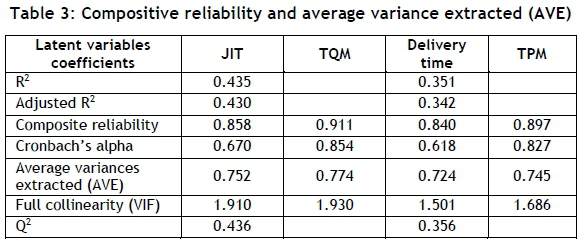
The construct validation is shown in Table 3, indicating that all values for composite reliability and Cronbach's alpha were greater than 0.7, which is above the minimum acceptable value [17, 67]. The values for VIF, used for collinearity, were all less than 3.3, indicating abscent of collinearity in the constructs. AVE values for these variables are about 0.70, so discriminant validity is greater than 0.5, as suggested by Kock [47]. Finally, R2, the adjusted R2, and Q2 values are greater than zero, with the conclusion that there is good predictive validity for the constructs.
4.3 Effects between constructs
4.3.1 Direct effects
The proposed evaluated model can be observed in Figure 2, where a dependence measurement value (expressed by β, with the P-value for their significance tests in parentheses) appears for each relationship between the constructs. In this case, it is observed that all relationships are significant, with P-values less than 0.01.

The interpretation of the relationships is, for example, that the relationship between TQM and JIT has β = 0.431 and P<0.01, which means that when the first construct increases its standard deviation by one unit, the second one goes up by 0.431 units. A similar interpretation is made of the other relationships between the variables. It should be appreciated that the largest β value occurs between TQM and JIT; this result demonstrates that a TQM programme is a very important factor for a JIT system within a company to improve supply chain performance.
The dependent variables that are explained from other independent variables have an R2 value. Here, the construct delivery time has an R2=0.351, which indicates that 35.1 per cent of its variance is explained by TQM, JIT, and TPM; but also that JIT is explained for 43.5 per cent (R2=0.435) by TQM and TPM.
4.3.2 Indirect effects
The sum of the indirect effects for two or more segments appears in Table 4, where it can be observed that the sum of the indirect effect of TQM to delivery time is 0.135, with this value being obtained by multiplying the direct effect of TQM on JIT (a value of 0.431 ) by the direct effect of JIT on delivery time (a value of 0.314). There is another indirect effect between TPM and delivery time of 0.096, which is small but statistically significant, because the p values are smaller than 0.05.

4.3.3 Total effects
The total effects are the sum of the direct and indirect effects obtained between the constructs. These effects and their P-values are shown in Table 5, where it is possible to see that all effects are significant for at least a 99 per cent confidence level, according to the associated p-value. Thus one can say that the total effect of TQM on delivery time is 0.330; this is because the sum of the values of the indirect effect of 0.135 (Table 4) and the direct effect of 0.195 (Figure 2) is 0.330 (0.195+0.135). Another relationship that has a total effect that is different from the direct effect is between TPM and delivery, because this is an indirect effect. A similar interpretation is applied to other relationships.
5 CONTRIBUTION OF THE STUDY
This study contributes to the study of the supply chain domain. First, it has applied structural equation modelling to incorporate the manufacturing aspects in a supply chain relationship, integrating important different theories into it. Second, the model can interpret the relationships between, and assess the aspects of, JIT, TQM, and TPM as antecedents in order to visualise the actual results in delivery elements. Few existing studies assess other aspects that include these kinds of variables in empirical analyses of maquiladoras, particularly with an international border between countries such as the United States and Mexico. In future research, the goal will be to continue this study by adding other aspects of manufacturing practices to the questionnaire, and to evaluate other tools implemented in manufacturing companies. It would also be beneficial to obtain information from other cities and in different industrial sectors in order to compare it with the results of this model. And it would be good to include other variables of company performance in the supply chain, such as flexibility and agility. This analysis includes the perceptions of respondents, so it is limited to interpreting the information through the proposed relationships between variables.
6 CONCLUSIONS AND INDUSTRIAL IMPLICATIONS
Nowadays, JIT is a philosophy that is known around the world and applied in globalised markets. Using JIT can allow firms to present a lean style in all manufacturing processes, including supply chain management [17]. According to the dependency arrows shown in Figures 1 and 2, it is possible to reach the following conclusions:
H1: There is enough statistical evidence to declare that the application of a total quality management programme has a direct and positive effect on just in time, because when the first construct increases its standard deviation in one unit, the second one goes up by 0.431 units. The industrial implication is that maquiladoras should implement programmes of TQM to achieve better results in the JIT system, which is a focused philosophy to reduce waste and improve processes from a lean perspective. The expected improvement in results includes reducing inventories and reducing rework costs as a result of increased product quality.
H2: Similarly, for H2, H3, H4 and H5 there is enough statistical evidence to accept the proposed relationships.
We can declare that the good practice of a total quality management programme has a direct and positive effect on delivery time, because when the first construct increases its standard deviation in one unit, the second one goes up by 0.195 unit. This indicates that TQM allows greater control of the agreed specifications for the product, and thus achieves the deliveries. There is consensus that the smaller the errors in the processes, the better the product quality and precision in delivery time. The current climate of competitiveness requires the delivery of quality products at low cost, on time, and in the agreed quantities.
H3: In the same way, the good practice of a just in time system has a direct and positive effect on delivery time, because when the first construct increases its standard deviation in one unit, the second one goes up by 0.314 units. This hypothesis is considered the most important implication for the manufacturing industry, because it indicates the importance of implementing a JIT system in companies. JIT is necessary because of the current competition between the efficiency of supply chains, so that, to achieve the timely delivery of finished product to customers, in exactly the right quantities, just when they are required, and at the required quality, JIT is a key element in achieving better results in a company's performance. JIT, in turn, requires the involvement of all the departments and hierarchical levels of the organisation to attain favourable results. A company that manages JIT complies with the requirements of its customers by making efficient use of all the resources available to carry out the transformation of raw materials into finished products.
H4: For this hypothesis, the good practice of TPM has a direct and positive effect on just in time, because when the first construct increases its standard deviation in one unit, the second one goes up by 0.305 units. The industrial application for this hypothesis is that it represents the importance of programmes for preventive and predictive maintenance in maquiladoras to obtain favourable results in the JIT system. This strategy has the benefits of reduced downtime in the processes and rapid changes in tooling and equipment. A total productive maintenance programme can properly manage the production times of machines to reduce any delays in production.
H5: Finally, the appropriate TPM management has a direct and positive effect on delivery time, because when the first construct increases its standard deviation in one unit, the second one goes up by 0.185 units. This result implies that participating in maintenance programmes is very important to avoiding production delays caused by break-downs in the machines or by unplanned changes in equipment, etc. This means that good control in the maintenance programme can provide benefits to the delivery of finished products and avoid delays in shipments, and thus reduce costs.
All of these findings contribute to studies in the manufacturing area. The responders took into consideration that, first, the companies where they work use the manufacturing practices proposed in the model in order to achieve better supply chain performance for the timely delivery of finished products; and second, the internal supply chain is part of the global supply chain, and so companies need to fit in with supply chain needs by applying other engineering tools and incorporating support departments to integrate both chains.
ACKNOWLEDGMENTS
The authors thank those companies that facilitated our work and the professionals who contributed to this study by answering the questionnaire. Their information was useful in achieving important findings on manufacturing practices that are implemented and used in this industrial sector.
REFERENCES
[1] Rodríguez-Méndez, R., Sanchez-Partida, D., Martínez-Flores, J.L. and Arvizu-Barron, E. 2015. A case study: SMED & JIT methodologies to develop continuous flow of stamped parts into AC disconnect assembly line in Schneider Electric Tlaxcala Plant. IFAC-PapersOnLine, 48(3), pp. 1399-1404. [ Links ]
[2] Moyano-Fuentes, J. and Sacristán-Díaz, M. 2012. Learning on lean: A review of thinking and research. International Journal of Operations & Production Management, 32(5), pp. 551-582. [ Links ]
[3] Evans, J.R. and Lindsay, W.M. 2014. An introduction to Six Sigma and process improvement. Cengage Learning. Stamford, CT, USA. [ Links ]
[4] Shah, R. and Ward, P.T. 2007. Defining and developing measures of lean production. Journal of Operations Management, 25(4), pp. 785-805. [ Links ]
[5] Olhager, J. and Prajogo, D.I. 2012. The impact of manufacturing and supply chain improvement initiatives: A survey comparing make-to-order and make-to-stock firms. Omega, 40(2), pp. 159-165. [ Links ]
[6] Inman, R.A., Sale, R.S., Green, K.W. and Whitten,D. 2011. Agile manufacturing: Relation to JIT, operational performance and firm performance. Journal of Operations Management, 29(4), pp. 343-355. [ Links ]
[7] Amasaka, K. 2008. Strategic QCD studies with affiliated and non-affiliated suppliers utilizing new JIT. Encyclopedia of Networked and Virtual Organizations, 3, pp. 1516-1527. [ Links ]
[8] Sadikoglu, E. and Zehir, C. 2010. Investigating the effects of innovation and employee performance on the relationship between total quality management practices and firm performance: An empirical study of Turkish firms. International Journal of Production Economics, 127(1), pp. 13-26. [ Links ]
[9] Topalovic, S. 2015. The implementation of total quality management in order to improve production performance and enhancing the level of customer satisfaction. Procedia Technology, 19, pp. 1016-1022. [ Links ]
[10] Amasaka, K. 2014. New JIT, new management technology principle: Surpassing JIT. Procedia Technology, 16, pp. 1135-1145. [ Links ]
[11] Konecny, P.A. and Thun, J.-H. 2011. Do it separately or simultaneously: An empirical analysis of a conjoint implementation of TQM and TPM on plant performance. International Journal of Production Economics, 133(2), pp. 496-507. [ Links ]
[12] Cua, K.O., McKone-Sweet, K.E. and Schroeder, R.G. 2006. Improving performance through an integrated manufacturing program. The Quality Management Journal, 13(3), pp. 45. [ Links ]
[13] Seth, D. and Tripathi, D. 2005. Relationship between TQM and TPM implementation factors and business performance of manufacturing industry in Indian context. International Journal of Quality & Reliability Management, 22(3), pp. 256-277. [ Links ]
[14] Danese, P., Romano, P. and Bortolotti, T. 2012. JIT production, JIT supply and performance: Investigating the moderating effects. Industrial Management & Data Systems, 112(3), pp. 441-465. [ Links ]
[15] Agus, A. 2011. Enhancing production performance and customer performance through total quality management (TQM): Strategies for competitive advantage. Procedia-Social and Behavioral Sciences, 24, pp. 1650-1662. [ Links ]
[16] Digalwar, A.K., Jindal, A. and Sangwan, K.S. 2015. Modeling the performance measures of world class manufacturing using interpreting structural modeling. Journal of Modelling in Management, 10(1), pp. 422. [ Links ]
[17] García-Alcaraz, J.L., Maldonado, A., Iniesta, A., Robles, G. 2014. A systematic review/survey for JIT implementation: Mexican maquiladoras as case study. Computers in Industry, 65(4), pp. 761-773. [ Links ]
[18] Rungtusanatham, M., Forza, C., Koka, B.R., Salvador, F., Nie, W. 2005. TQM across multiple countries: Convergence hypothesis versus national specificity arguments. Journal of Operations Management, 23(1), pp. 43-63. [ Links ]
[19] Kull, T.J. and Wacker, J.G. 2010. Quality management effectiveness in Asia: The influence of culture. Journal of Operations Management, 28(3), pp. 223-239. [ Links ]
[20] Porter, L. and Tanner, S. 2012. Assessing business excellence. Routledge. New York, NY, USA. [ Links ]
[21] Teeravaraprug, J., Kitiwanwong, K. and SaeTong, N. 2011. Relationship model and supporting activities of JIT, TQM and TPM. Sonklanakarin Journal of Science and Technology, 33(1), pp. 101. [ Links ]
[22] Chang, C., Chiu, C. and Chen, C. 2010. The effect of TQM practices on employee satisfaction and loyalty in government. Total Quality Management, 21(12), pp. 1299-1314. [ Links ]
[23] Gunday, G., Ulusoy, G., Kilic, K. and alpkan, L. 2011. Effects of innovation types on firm performance. International Journal of Production Economics, 133(2), pp. 662-676. [ Links ]
[24] Miyagawa, M. and Yoshida, K. 2010. TQM practices of Japanese-owned manufacturers in the USA and China. International Journal of Quality & Reliability Management, 27(7), pp. 736-755. [ Links ]
[25] Salaheldin, I.S. 2009. Critical success factors for TQM implementation and their impact on performance of SMEs. International Journal of Productivity and Performance Management, 58(3), pp. 215-237. [ Links ]
[26] Arumugam, V., Ooi, K.-B. and Fong, T.-C. 2008. TQM practices and quality management performance: An investigation of their relationship using data from ISO 9001: 2000 firms in Malaysia. The TQM Journal, 20(6), pp. 636-650. [ Links ]
[27] Furlan, A., Dal Pont, G. and Vinelli, A. 2011. On the complementarity between internal and external justin-time bundles to build and sustain high performance manufacturing. International Journal of Production Economics, 133(2), pp. 489-495. [ Links ]
[28] Ahmad, M., Zakuan, N., Jusoh, A. and Takala, J. 2012. Relationship of TQM and business performance with mediators of SPC, lean production and TPM. Procedia-Social and Behavioral Sciences, 65, pp. 186191. [ Links ]
[29] Ahuja, I.P.S. and Khamba, J.S. 2008. Total productive maintenance: Literature review and directions. International Journal of Quality & Reliability Management, 25(7), pp. 709-756. [ Links ]
[30] Ahuja, I.P.S. and Khamba, J.S. 2008. Assessment of contributions of successful TPM initiatives towards competitive manufacturing. Journal of Quality in Maintenance Engineering, 14(4), pp. 356-374. [ Links ]
[31] McKone, K.E., Schroeder, R.G. and Cua, K.O. 2001. The impact of total productive maintenance practices on manufacturing performance. Journal of Operations Management, 19(1), pp. 39-58. [ Links ]
[32] Navid, B. and Ismaeli, S. 2012. Analyzing effective elements in agile supply chain. Management Science Letters, 2(1), pp. 369-378. [ Links ]
[33] Rindfleisch, A.,Malter, A.J., Ganesan, S. and Moorman, C. 2008. Cross-sectional versus longitudinal survey research: Concepts, findings, and guidelines. Journal of Marketing Research, 45(3), pp. 261-279. [ Links ]
[34] Avelar-Sosa, L., García-alcaraz, J.L., Vergara-Villegas, O.O.Maldonado-Macias, A.A. and Alor-Hernández, G. 2015. Impact of traditional and international logistic policies in supply chain performance. The International Journal of Advanced Manufacturing Technology, 76(5-8), pp. 913-925. [ Links ]
[35] National Institute of Statistics Geography and Informatics (INEGI). 2015. National Statistical Yearbook. Available from: http://www.inegi.org.mx. [ Links ]
[36] National Institute of Statistics Geography and Informatics (INEGI). 2016. National Statistical Yearbook Available from: http://www.inegi.org.mx. [ Links ]
[37] Siller, P. and Nunez, P. 2015. Economic report of the maquiladora: BASE Bank economic analysis [cited 2015]. Available from: http://indexjuarez.org/news/reporte-economico-maquiladoras. [ Links ]
[38] Foster Jr, S.T., Wallin, C. and Ogden, J. 2011. Towards a better understanding of supply chain quality management practices. International Journal of Production Research, 49(8), pp. 2285-2300. [ Links ]
[39] Avelar-Sosa, L., García-alcaraz, J.L., Cedillo-Campos, M.G. and Adarme-Jaimes, W. 2014. Effects of regional infrastructure and offered services in the supply chains performance: Case Ciudad Juarez. Dyna, 81(186), pp. 208-217. [ Links ]
[40] Soin, S.S. 2004. Critical success factors in supply chain management at high technology companies. Ph. Doctoral Thesis. University of Southern Queensland, Queensland, AU. [ Links ]
[41] Likert, R. 1932. A technique for the measurement of attitudes. Archives of Psychology, 22 (140), pp. 55. [ Links ]
[42] Bhatnagar, R. and Sohal, A.S. 2005. Supply chain competitiveness: Measuring the impact of location factors, uncertainty and manufacturing practices. Technovation, 25(5), pp. 443-456. [ Links ]
[43] Bhatnagar, R., Jayaram, J. and Phua, Y.C. 2003. Relative importance of plant location factors: A cross national comparison between Singapore and Malaysia. Journal of Business Logistics, 24(1), pp. 147-170. [ Links ]
[44] Kaiser, H.M. and Messer, K.D. 2011. Mathematical programming for agricultural, environmental and resource economics. John Wiley and Sons, Inc. Hoboken, NJ, USA. [ Links ]
[45] Giaquinta, M. and Modica, G. 2010. Mathematical analysis: An introduction to functions of several variables. Springer Science & Business Media. [ Links ]
[46] Hair, J.F.,Sarstedt,M., Pieper, T.M., Ringle, C.M. 2012. Applications of partial least squares path modeling in management journals: A review of past practices and recommendations for future applications. Long Range Planning, 45(5-6), pp. 320-340. [ Links ]
[47] Kock, N. 2013. WarpPLS 4.0 User Manual, Script Warp Systems, Laredo Texas. Available at http://cits.tamiu.edu/WarpPLS/UserManual_v_6_0.pdf (Accessed 12.10.14). [ Links ]
[48] Green, K.W., Inman, R.A., Birou, L.M. and Whitten, D. 2014. Total JIT (T-JIT) and its impact on supply chain competency and organizational performance. International Journal of Production Economics, 147, pp. 125-135. [ Links ]
[49] Williams, L.J., Vandenberg, R.J. and Edwards, J.R. 2009. Structural equation modeling in management research: A guide for improved analysis. The Academy of Management Annals, 3(1), pp. 543-604. [ Links ]
[50] Henseler, J. and Sarstedt, M. 2013. Goodness-of-fit indices for partial least squares path modeling. Computational Statistics, 28(2), pp. 565-580. [ Links ]
Submitted by authors 12 Oct 2016
Accepted for publication 17 Sep 2018
Available online 10 Dec 2018
* Corresponding author liliana.avelar@uacj.mx

