


Services on Demand
Article
 English (pdf)
 Article in xml format
 Article references
Indicators

Related links
-
 Cited by Google
 -
 Similars in Google
Share

 Permalink
South African Journal of Industrial Engineering
On-line version ISSN 2224-7890
Print version ISSN 1012-277X
S. Afr. J. Ind. Eng. vol.29 n.4 Pretoria Dec. 2018
http://dx.doi.org/10.7166/29-4-1821
GENERAL ARTICLES
Some aspects of the use and usefulness of quantitative risk analysis tools in project management
F.D. Hugo#; L. Pretorius*; S.J. Benade
Graduate School of Technology Management, Department of Engineering and Technology Management, University of Pretoria, South Africa
ABSTRACT
Central to project management is risk management - and the need to develop better and more specific tools to manage risk. This is driven by the desire to reduce uncertainty and risk on projects. Quantitative tools such as Monte Carlo simulation are sometimes used to analyse risk, but it is not clear how widespread, accepted, or useful such tools are for practising project personnel. This research was undertaken to gain feedback from practising project and risk management personnel about the use of risk management tools. Special attention was given to the levels of use of quantitative risk management tools and the benefits gained from their use. A conceptual framework was created linking the factors that affect tool use to the actual tool use levels, and ultimately to project performance. Research questions reported on in this paper addressed levels of tool use, factors that affect tool usage, and the benefit aspect of tool use on project performance. Data were gathered via an on-line questionnaire that was statistically analysed, and a number of hypotheses were tested. The results of this study show that the levels of use of both qualitative and quantitative risk management tools are low compared with general project management tools. Correlations were found between a number of factors that affect tool use.
OPSOMMING
Sentraal tot projekbestuur is risikobestuur - en die behoefte om beter en meer spesifieke metodes te ontwikkel om risiko beter te bestuur. Dit word gedryf deur onsekerheid en risiko op projekte te verminder. Kwantitatiewe tegnieke, word soms gebruik om risiko te analiseer, maar dit is nie duidelik hoe wydverspreid, aanvaar, en nuttig sulke tegnieke is vir die beoefening deur projekpersoneel nie. Hierdie studie is onderneem om terugvoer te verkry van praktiserende projek- en risikobestuurspersoneel ten opsigte van die gebruik van risikobestuursmetodes. Spesiale aandag is gegee aan die benuttingsvlakke van kwantitatiewe risikobestuursmetodes en die voordeel daarvan. 'n Konseptuele raamwerk is geskep wat faktore wat die gebruik van hulpmiddels skakel met die werklike vlakke vir die gebruik van instrumente, en uiteindelik skakel met projekprestasie. Navorsingsvrae waaroor in hierdie artikel verslag gelewer word, het betrekking op die gebruiksvlakke van instrumente en metodes, faktore wat die gebruik van instrumente en metodes beïnvloed, en die voordele-aspek van die gebruik van instrumente en metodes op projekprestasie beïnvloed. Data is ingesamel via 'n aanlyn vraelys, statisties ontleed, en 'n aantal hipoteses is getoets. Die resultate van hierdie studie toon dat die benutting vlakke van beide kwalitatiewe en kwantitatiewe risikobestuurinstrumente en metodes laag is in vergelyking met algemene projekbestuursinstrumente.
1 INTRODUCTION
The application of project management has grown in popularity over the last few decades into a management practice that is applied across many industries [1]. This has driven the need to develop better project management standards, techniques, and practices. One example of such a standard that is widely known is the Guide to the Project Management Body of Knowledge (PMBOK® Guide) [2], which serves as a standard for implementing project management. It provides a framework that combines project processes with specific knowledge areas.
In the context of this paper some tools and techniques may be found to be more popular and useful in practice than others and, over time, some may be used to a larger extent than others. Project and risk managers, due to the nature of their roles and responsibilities, have to take a practical approach to the use of tools and techniques.
In a study carried out by Raz Shenhar and Dvir [3], it was found that risk management tools are underused, and that practitioners question the helpfulness of such tools. Furthermore, it was determined that only a small number of projects actually make use of available risk management processes and tools; and where such tools were used, they appeared to be related to project success [3].
In a study to determine the gaps that exist in the project management standards, Prpic [4] concluded that the standards have some shortcomings, and that this should be noted by practitioners making use of the standards as a tool. Rodney et al. [5] stated that project management and risk management are still being applied independently rather than as an integrated management approach. Rodney et al. [5] illustrated the lack of risk integration capability of current project and risk management tools. Breysse et al. [6], as quoted by Rodney et al. [5], stated that the majority of project risk management tools are only applicable to a part of the project risk management process.
From this it can be concluded that, although much work has been done in the field of project risk management, there are still some gaps. These gaps seem to relate to the possible non-integrated management of risk within project management, and to the mismatch of tools to handle project risk management in an integrated approach.
A widely known approach to quantitative analysis is through Monte Carlo simulation. Applications are found in both cost and schedule management. Examples of these are schedule risk analysis [7] and, more recently, integrated cost-schedule risk analysis [8] and a similar approach called integrated project management and control [9], also referred to as dynamic scheduling [10].
Raz et al. [3], in a study on risk management and project success, concluded that risk management still needs to develop better and more specific tools to manage risk more effectively, especially on larger and more complex projects. Since that study was done some 15 years ago, new tools have been developed in the project and risk management field.
Purnus and Bodea [11] noted that project quantitative risk analysis is the hardest part of project risk management and that, although many software solutions to implement risk management methods have been developed, these are usually not used or are improperly applied.
In order to carry out the risk analysis activity efficiently and effectively, an appropriate tool should be used. To determine this, feedback from practising project and risk managers is required. The aim of the research presented in this paper was to provide information from industry in order better to understand the use and usefulness of the current tools.
The remainder of this paper is structured as follows: the ensuing subsections address the research problem context of risk management tools; the research objectives are then explained in relation to the practical use of these tools. The second section of the paper addresses the development basis for a conceptual method in relation to the factors affecting the use of risk management tools. Thereafter the choice of research methodology is motivated and discussed. In section 4 some empirical results for a total of eight hypotheses, addressing three research questions, are presented and discussed. Lastly, some conclusions are presented about, for example, the use of quantitative risk analysis tools that have been investigated in a broader project management environment.
1.1 Research problem statement
Uncertainty and risk are central to all projects. The knowledge area of risk management is concerned with reducing uncertainty in projects and thus reducing the risks related to time, cost, and performance [12]. Quantitative tools such as Monte Carlo simulation are sometimes used to predict cost and schedule durations on large projects. A number of risk management tools are available in the market; however, it is not clear how widespread, accepted, or useful these quantitative tools are for practising project and risk managers. It also seems to be unclear what the effort and reward relationship is when making use of these tools. These are some of the problem areas addressed in this paper.
1.2 Research objectives
The objective of the research was to determine the practical level of use of quantitative risk management tools on projects. There is a special interest in larger projects, but the results are not limited to large projects. A secondary objective was to determine the usefulness of quantitative tools in project and risk management, expressed in terms of the benefit to the project. The research questions broadly addressed the following: (1) the level of use of risk management tools; (2) tool use and the basis of their use; and (3) benefit from tool use and its relation to project performance.
2 CONCEPTUAL METHOD
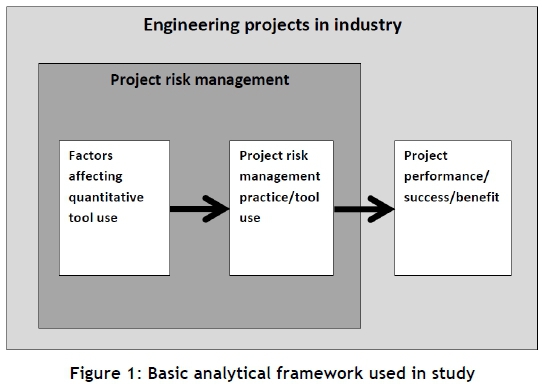
The analytical framework was developed to divide the conceptual method into three distinct areas. The first area of the framework is related to factors affecting the use of tools. The second area is related to the project risk management practices that are followed and the tools used. The third area addresses project performance or project success, and the benefits derived from use of the tools. The variables contained in this model are part of, or result from, the framework measuring the behaviour, opinions, beliefs, attitudes, and attributes of project personnel operating in project organisations. The basic framework was developed from insights described, inter alia, in the literature review, and is depicted in Figure 1.
2.1 Factors affecting tool use
The identification and selection of factors that might affect the use of tools was compiled from sources reviewed during the literature study, and from practical experience. Some of these factors are more general in nature, relating to aspects of project and risk management. Others are more specific, relating to the use of quantitative risk management analysis tools and the associated issues that arise when implementing quantitative risk management within projects. The factors were also drawn from different levels of risk management - for instance, from the organisational level, project framework, and process level. Several resources were used to consolidate and verify the list of factors applicable to this research. The critical success factors for project risk management, as described in the practice standard for project risk management [13], are the factors listed in Na Ranong and Phuenngam [14], in Gibson [15], in Hulett [7], and in Labuschagne et al. [16]. The factors analysed in this research are listed below:
• Size of the project in terms of cost, duration, resources, and in relation to other projects in industry;
• Resources available for and dedicated to risk management (money, time, software, and other resources);
• Skill level, training, and experience of project and risk management staff;
• Orientation of project and risk management staff towards risk management, and specifically towards quantitative risk management activities;
• Integration of risk management with project management practice;
• Organisational risk framework and policy, culture of risk management, value placed in risk management, and commitment to risk management;
• The qualities that affect the rate of diffusion/adoption, such as the relative advantage of tools, compatibility with existing values and practices, complexity/simplicity and ease of use and learning effort required, trial-ability of quantitative tools, observability of results, identifying user segments, and peer network exposure and awareness of risk management activities and tools;
• Appropriate and accurate risk models;
• Interaction between qualitative and quantitative risk analysis;
• Quality and sources of data used; and
• Correlation and bias issues in quantitative risk data.
2.2 Project risk management practice and project performance
The use of tools was also linked to the different phases of the project life cycle - i.e., concept, pre-feasibility, feasibility, delivery, and operation, as described in Cooper et al. [17]. The project performance or success rates of projects were measured. This includes general project performance and success measurements, and the measurement of the benefits gained from making use of tools in projects. These include tools for project management in general, schedule management, cost management, investment management, risk management and, specifically, quantitative risk management.
2.3 Links to conceptual model and hypotheses
The analytical framework was used to link the three areas of the conceptual model. The basic concept is that certain factors affect the use of tools, and some tools are then used to a certain extent, which results in a specific project performance or project success. In order to link the variables, a number of hypotheses were formulated. This allowed for the stated relationships to be tested in a systematic and statistical way. These results were evaluated, and research conclusions were then drawn. The hypotheses were grouped together to address the respective research questions (RQ1-3) stated below, and generally formulated to support the null hypothesis format:
RQ1 - Use of quantitative tools:
• Hypothesis H1 - The level of use of quantitative risk analysis tools in project risk management is low.
RQ2 - Basis for quantitative tool use:
• Hypothesis H2 - Quantitative risk analysis tool use is unrelated to project size.
• Hypothesis H3 - Quantitative risk analysis tool use is unrelated to available risk management resources allocated to projects.
• Hypothesis H4 - Quantitative risk analysis tool use is unrelated to individual project team members' competence in risk management.
• Hypothesis H5 - Quantitative risk analysis tool use is unrelated to organisation's formal risk management approach.
• Hypothesis H6 - Quantitative risk analysis tool use is unrelated to individual project team members' attitude towards project management, risk management, or quantitative risk management.
RQ3 - Benefit of quantitative tool use:
• Hypothesis H7 - Quantitative risk analysis tool use is unrelated to project performance.
Not all of the identified factors were incorporated into hypotheses, although most of the factors were surveyed and statistically evaluated as part of the research results presented in this paper. These include the qualities that affect the rate of adoption/diffusion and the use of tools across knowledge areas and project phases. Thus a frequency and a qualitative insight into the objectives of the study could be obtained. The links between the research objectives, research questions, hypotheses, and variables are shown in Table 1.
3 RESEARCH DESIGN AND METHODOLOGY
The research for this paper was carried out in a project management environment. Although the research was conducted from South Africa, participants from Southern Africa and international participants contributed to this study. Since project management cuts across industries, project managers, risk managers, and other project personnel working in related project management fields were also included in the study.
The philosophical approach taken in this research was one of positivism. The construction of knowledge has gone from theory to hypothesis, followed by a quantitative survey-based research design, and on to data collection and analysis. Thus a deductive approach was taken to the creation of knowledge.
The research study contains elements of a quantitative nature, and a linear research path was followed. The research study began with an appropriately detailed literature review. This was followed with substantiated field research via a survey (on-line questionnaire). The survey questionnaire mainly followed a structured approach, and was based on the research questions and hypotheses presented in a previous section. The data from the returned surveys were analysed via descriptive and inferential statistical methods, and finally presented as part of this paper.
The dimension and major types or categories of research described in Neuman [18] were used to give an overview of the proposed research study. The research was aimed at an applied use audience with an explanatory purpose. It followed an across-case approach at a single point in time. Empirical primary data were collected.
The logic for following a quantitative survey-based research design was that feedback from practising project personnel was required to address the research objectives and questions, also in a quantitative manner. Since the research population was estimated to be fairly large, a questionnaire-based design made sampling from the population practically feasible. Analysis of the data collected in this way was then used to test formulated hypotheses. Subsequent statistical analysis showed correlations in the data that could then be used to explain behaviour observed in practice. This made it possible to make inferences about the population, based on patterns seen in the sample data.
The questionnaire consisted of about 30 main questions, some with several sub-questions within each main question section. This was a self-administered, self-assessed questionnaire in which the respondents answered questions based on their own assessment of the matters related to the questions. For example, matters such as project success were reported from the respondent's unique context and from their own view and assessment of the success of their projects. It is, however, recognised that project success should more generally be evaluated by all project stakeholders. This is then considered a limitation of this research, where primary data were gathered online via a questionnaire from respondents who based their answers on their project contexts. Furthermore, a question based on personal competency, for example, was based on a definition of the concept including, for instance, skill level, training, experience, and exposure. Some definitions of constructs measured in the survey are also provided where appropriate in the results section, for clarification.
Most of the questions in the questionnaire are Likert-type items that were combined into Likert scales. However, some of the questions were single Likert-type items. In this case, the data analysis was based on modes or medians and frequencies. For Likert scale items, data analysis was based on mean and standard deviation. Combining Likert-type data into a scale allowed for analysis to be handled like interval-level data [19]. The statistical procedures used for this were as suggested in Boone and Boone [19]. These procedures include medians, means, frequencies, standard deviations, correlation coefficients (Pearson's r), t-tests, regression analysis, and p-values. The appropriate conditions in which these Likert scale items can be used for more detailed statistical analysis are clearly described in Boone and Boone [19]. These assumptions and conditions are also taken care of in the analyses, and the results are presented in this paper. Descriptive statistics was used to describe the group profiles. As far as possible, the assumption of normality was made.
In this research, the following possible threats to internal validity were considered and addressed: (1) selection - since the response to the survey was voluntary, it is possible that only certain types of individuals completed the questionnaire; (2) statistical significance; and (3) design contamination - it is possible that certain respondents in the survey did not want to share correct and true information - for example, to keep a competitive advantage over other organisations operating in the same industry.
4 RESULTS
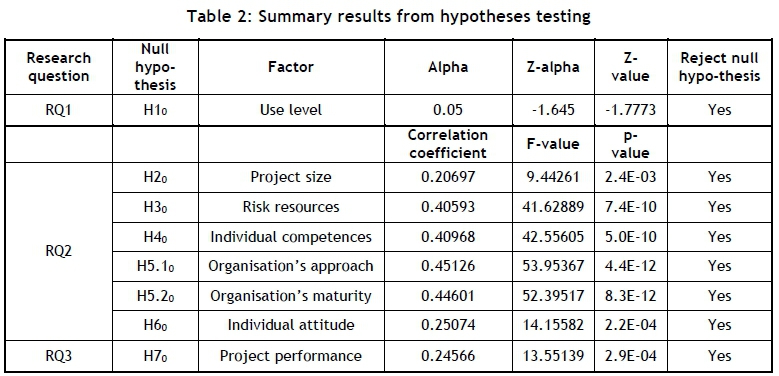
The data were gathered during the period from 07 March 2017 to 21 May 2017, with 213 completed surveys obtained from a total of 446 respondents. Only 213 of these respondent questionnaires could be used because the rest had large sections that were incomplete, indicating a possible time issue for the respondents. About 65 per cent of these respondents came from the construction, engineering, and mining environment. However, this research did not attempt to study the effect of specific project types at this stage. A total of eight hypotheses were formulated that addressed three research questions. The hypotheses and research results are discussed in the subsections that follow, and a summary of the results can be seen in Table 2 at the end of section 4.7.
4.1 Hypothesis H1 (RQ1) - Level of use of quantitative tools
The hypothesis states that the level of use of quantitative risk analysis tools in project risk management is low. It was found that 120 of the 213 respondents reported that they use quantitative tools on less than 50 per cent of the projects on which they work. The hypothesis test was carried out on a population proportion in accordance with the method set out in Montgomery and Runger [20], at α = 0.05 and Za= 1.645, and resulted in z* < -Za: -1.777 < -1.645.
The null hypothesis, H1o : p = 0.5, is rejected, and the alternative hypothesis, H1a : p < 0.5, is plausible. Thus it cannot be assumed that the level of quantitative tool use is at least at 50 per cent, but it is plausible that it is lower.
This indicates that quantitative tool use is low, as assumed.
4.2 Hypothesis H2 (RQ2) - Project size
The proposition was made that quantitative risk analysis tool use is unrelated to project size. In order to determine a possible association between the size of the project and the use of quantitative risk management tools, both the correlation coefficient and linear regression were calculated for the variables in the survey. The size of the project was assessed on a Likert scale constructed to measure this aspect in terms of cost, duration, and resources, and relative to other projects in the participant's industry. The hypothesis test for a regression slope was done, with Y = B0 + B1*X. The hypothesis can be stated as follows:
Null hypothesis: H20: B1 = 0 (the slope of the regression line is equal to zero)
Alternative hypothesis: H2a: B1 ‡ 0 (the slope of the regression line is not equal to zero)
It was found that there is a positive correlation of approximately 0.207, which is low, but significant with a p-value of 0.0024. If the hypothesis H20: B1 = 0, it is most unlikely that it is true, and should be rejected. The t-value from the t-distribution table is t{0.025;«} = 1.960. With te > t (3.0729 > 1.960), H20 is rejected. The alternative hypothesis H2a: B1 t 0 is plausible.
In other words, there is a correlation between the use of quantitative tools and the size of a project. The regression model shows that 4.3 per cent of the variation in the use of quantitative tools is explained by project size, which is very low. The regression model's F-value is high (9.44), which indicates that the model is significant.
The conclusion is that, although the results are significant, the correlation is low, which indicates that the relationship is weak, but still positive.
4.3 Hypothesis H3 (RQ2) - Risk management resources
The proposition was made that quantitative risk analysis tool use is unrelated to available project risk management resources. In order to determine some association between the available project resources and the use of quantitative risk management tools, both the correlation coefficient and linear regression were calculated for the variables in the survey. The hypothesis test for a regression slope was done, with Y = B0 + B1*X. It was found that there is a positive correlation of 0.406. This is a fair but low correlation, although with an extremely low p-value. If the hypothesis H30: B1 = 0, it is most unlikely that it is true and should be rejected. With t0 > t (6.4520 > 1.960), H30 is rejected. The alternative hypothesis H3a: B1 ‡ 0 is plausible.
There is thus a correlation between the use of quantitative tools and the available resources on a project. The regression model shows that 16.5 per cent of the variation in use of risk management tools can be explained by the risk management resources, which is low. The regression model's F-value is high (41.6289), which indicates that the model is significant.
The conclusion is that, although the results are significant, the correlation is in the low to fair region, which indicates that the relationship is fair.
4.4 Hypothesis H4 (RQ2) - Individual competences
The proposition was made that quantitative risk analysis tool use is unrelated to individual project team members' competence in risk management. Here the definition of 'competence' was based on skill level, training, experience, exposure, etc. In order to determine some possible association
between the competences of project members and the use of quantitative risk management tools, both the correlation coefficient and linear regression were calculated for the variables in the survey. The hypothesis test for a regression slope was done, with Y = Bo + Bi*X. It was found that there is a positive correlation of 0.4097. This is a fair but low correlation; however, it is significant with an extremely low p-value. If the hypothesis H4o: Bi = 0, it is most unlikely that it is true and should be rejected. With to > t (6.5235 > 1.960), H4o is rejected. The alternative hypothesis H4a: Bi ‡ 0 is plausible.
Stated differently, there is a correlation between the use of quantitative tools and the competence of the individuals working on a project. The regression model also shows that 16.8 per cent of the variation in the use of risk management tools is explained by individual competence, which is low. The regression model's F-value is high (42.56), indicating that the model is significant.
The conclusion is then that, although the results are significant, the correlation is in the low to fair region, which indicates that the relationship is fair.
4.5 Hypothesis H5 (RQ2) - Organisational approach to risk management
The proposition was made that quantitative risk analysis tool use is unrelated to an organisation's formal risk management approach. In order to determine the possible association between the parent organisation's formal approach to risk management and the use of quantitative risk management tools, both the correlation coefficient and linear regression were calculated. The hypothesis test for a regression slope was done, with Y = B0+ B1*X. Hypothesis H5 is split up into two sub-hypotheses, where H5.1 targets research variables that relate directly to the organisation's formal approach, while H5.2 deals with the rated maturity level of the organisation in terms of project management and risk management.
For hypothesis H5.1, it was found that there is a positive correlation of 0.4513, which is a fair correlation and significant with an extremely low p-value. If the hypothesis H5.10: B1 = 0, it is most unlikely that it is true, and should be rejected. With t0 > t (7.3453 > 1.960), H5.10 is rejected. The alternative hypothesis H5.1a: B1 ‡ 0 is plausible.
Therefore there is a correlation between the use of quantitative tools and an organisation's approach to project and risk management. The regression model shows that 20.3 per cent of the variation in an organisation's approach to project and risk management is explained by the use of risk management tools. The regression model's F-value is high (53.95). This indicates that the model is significant.
The conclusion for hypothesis H5.1 is that, although the results are significant, the correlation is in the low to fair region, which indicates that the relationship is fair.
For hypothesis H5.2, it was found that there is a positive correlation of 0.4460, which is a fair correlation and significant with an extremely low p-value. If the hypothesis H5.20: B1 = 0, it is most unlikely that it is true, and should be rejected. With t0 > t (7.2385 > 1.960), H5.20is rejected. The alternative hypothesis H5.2a: B1 ‡ 0 is plausible.
Stated another way, there is a correlation between the use of quantitative tools and the maturity of an organisation's project and risk management processes. The regression model shows that 19.9 per cent of the variation in the use of risk management tools is explained by an organisation's maturity level in project and risk management. The regression model's F-value is high (52.40), which indicates that the model is significant.
The conclusion for hypothesis H5.2 is, therefore, that although the results are significant, the correlation is in the low to fair region, which indicates that the relationship is fair.
4.6 Hypothesis H6 (RQ2) - Individual attitude
The proposition was made that quantitative risk analysis tool use is unrelated to individual project team members' attitude towards project management, risk management, and quantitative risk management. The definition of 'attitude' used and measured in the survey was based on a rating of the importance and usefulness of project, risk, and quantitative risk management; the importance of integration between project, risk, and quantitative risk management; and the importance of good tools for project, risk, and quantitative risk management. In order to determine a possible association between these attitudes and the use of quantitative risk management tools, both the correlation coefficient and linear regression were calculated. The hypothesis test for a regression slope was done, with Y = Bo+ Bi*X. It was found that there is a positive correlation of 0.2507, which is a low correlation, but significant, with a fairly low p-value. If the hypothesis H6o: Bi = 0, it is most unlikely that it is true, and should be rejected. With to > t (3.7624 > 1.960), H6o is rejected. The alternative hypothesis H6a: B1 ‡ 0 is plausible.
In other words, there is a correlation between the attitude towards project, risk, and quantitative risk management and the use of quantitative risk management tools. The regression model shows that 6.3 per cent of the variation in the use of risk management tools is explained by the overall attitude score, which is low. The regression model's F-value is high (14.16), which indicates that the model is significant.
The conclusion is that, although the results are significant, the correlation is low, which indicates that the relationship is not that strong.
4.7 Hypothesis H7 (RQ3) - Project performance
The proposition was made that quantitative risk analysis tool use is unrelated to project performance. In order to determine the possible association between project performance or project success and the use of quantitative risk management tools, both the correlation coefficient and linear regression were calculated. The hypothesis test for a regression slope was done, with Y = Bo + B1*X. It was found that there is a positive correlation of 0.2457, which is a low correlation, but significant with a fairly low p-value. If the hypothesis H7o: B1 = o, it is most unlikely that it is true, and should be rejected. With t0 > t (3.6812 > 1.960), H7o is rejected. The alternative hypothesis H7a: B1 ‡ 0 is plausible.
In other words, there is a correlation between overall project success and the use of quantitative risk management tools. The regression model shows that only 6.03 per cent of the variation in the use of risk management tools is explained by the overall project success, which is low. The regression model's F-value is high (13.55), which indicates that the model is significant.
The conclusion is that, although the results are significant, the correlation is low, which indicates that the relationship is not that strong.
4.8 Factors related to tool use
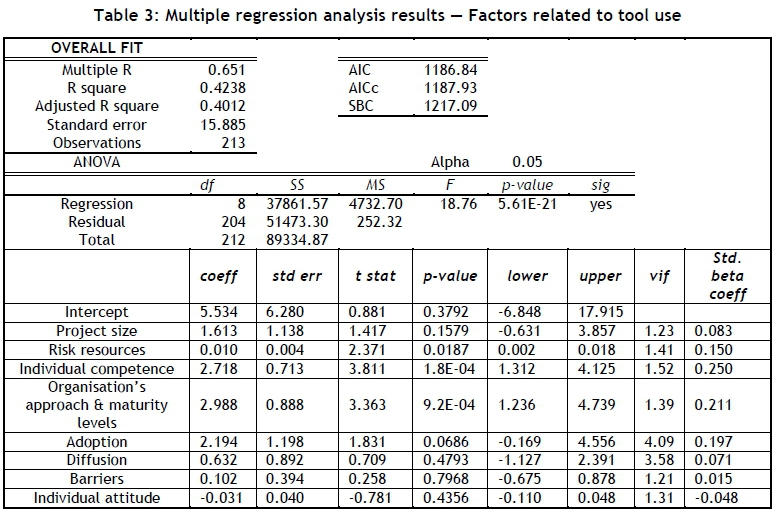
In order to relate the identified factors that might affect tool use, a representative score was calculated for each participant per factor group. This gave values for each of the nine factor groups per participant. A tool-use score based on weighting and calculated for each participant considered the participants' rating of their use-habits of different tools. These scores were calculated by combining Likert-type data into a scale that, in this case, allowed the regression data to be handled like interval-level data. This is also as motivated in Boone and Boone [19]. In order to get a better understanding of the interaction of the factors and tool use, a multiple regression model was constructed that included eight factors. In this model, the aspects of tool adoption, diffusion, and barriers to use were also included. From this analysis it was found that about 40 per cent of the variation in tool use can be explained by the model. Although this percentage is on the low side, the model was found to be significant. The analysis further indicates that some factors that possibly could affect the tool use might not be included in the current model.
The ranking of the individual coefficients, based on their standardised beta coefficients, is as follows: (1) individuals' competence; (2) organisation's approach and maturity levels; (3) adoption; (4) available resources; (5) size of project; (6) diffusion; (7) individuals' attitude, which is negative; and (8) barriers to use. Only three of the factor coefficients had p-values lower than 0.05. These were (in increasing order): (1) individuals' competence; (2) organisation's approach and maturity levels; and (4) available resources. The remaining factors are not regarded as significant in the model. The results from the regression analysis can be seen in Table 3.
From these analyses, the conclusion for the sampled population is that the factors that have been identified in the literature study have positive correlations to tool use, but also that these relationships are fairly weak; and although the results for the model are significant overall, many of the individual factors do not contribute significantly to the model.
4.9 Tool use related to project performance
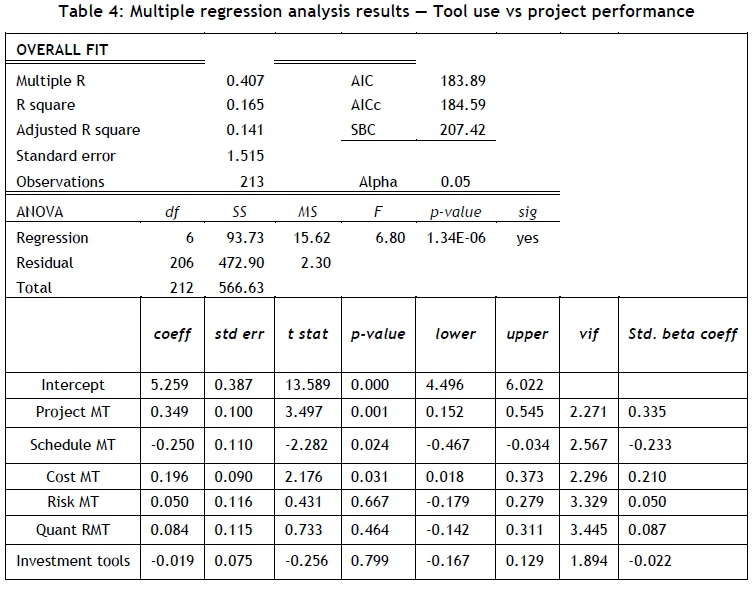
In order to relate the use of tools to project performance or project success, the individual tool use levels for each type of tool were related to the total project performance score for each participant. These data were then used to carry out a multiple regression analysis, and it was found that the adjusted R square value is about 14 per cent, which means that only 14 per cent of the variation in total project performance can be explained by the use of the different types of tools. This result is surprisingly low, and indicates that other factors related to project performance might be missing from the model. However, the correlation coefficient is in the order of 40 per cent, and the regression model is also significant. The individual coefficients for risk management, quantitative risk management, and investment tools have high p-values (above 0.05). This indicates that these coefficients are not significant in the model. This also indicates that general project management tool use and the use of tools such as scheduling and cost management tools have a higher influence on project performance. From the standardised beta coefficients it can be seen that project management tools, in general, have the highest influence on the model, followed by schedule and cost management tools. Surprisingly, the direction of the relationship of schedule management tools is negative. This could also be a subject for further research. The results of the multiple regression analysis can be seen in Table 4. In this table MT refer to Management Tools and RMT Risk Management Tools respectively.
Although these results may seem a bit disappointing in terms of the strength of the relationship between tool use and project performance, at least from a risk and quantitative risk management perspective they indicate that other factors not identified in this study may play a larger part in project performance. This will need further research.
5 CONCLUSIONS AND RECOMMENDATIONS
This research contributed to the field of project risk management by investigating aspects related to tool use, the factors affecting tool use, and the effect that tool use has on project performance. More specifically, the use of quantitative risk analysis tools was investigated in a broader project management environment. It was found that quantitative risk management with its corresponding tool use remains quite low. The estimated quantitative tool use level is in the order of 37 per cent, whereas project management tool use in general is in the order of 68 per cent, measured on the same scale.
In this study, tool use was linked to several factors that had been identified during the literature study. Although all of the factors show a positive correlation to tool use, the relationships are fairly weak, and it is clear from the analyses that other factors not identified in this study have to be included in future research. Some of the factors were found to be not significant. The factors that were found to be significant were individuals' competence, the parent organisation's approach and maturity levels, and available resources for project and risk management. Project size, adoption and diffusion, barriers to use, and individuals' attitude towards project and risk management were found to be not significant for the sampled population.
And although positive correlations between tool use and project performance were also found, tool use levels in general had a relatively small part to play in project performance. The study showed that there is benefit in tool use and, at the same time, that more needs to be done to improve the use of tools.
With a view to improving the use of risk management tools, and specifically the use of quantitative risk management tools, the following recommendations are made, based on the knowledge that was gained in this research study:
• Focus on the factors that were identified as significant in affecting tool use:
o Improve individuals' risk management competence via training, exposure, etc.
o Align the parent organisation's approach to risk management with projects, and strive to improve the organisation's maturity levels in project and risk management processes.
o Make available the required resources, both human and software, to carry out risk management, both for qualitative and quantitative risk management.
• More effort needs to be spent on the quantitative aspect of risk management, as it seems from the research that there are misconceptions in practice in terms of certain aspects of quantitative risk analysis models.
With a view to future research on this topic, the recommendations are:
• Consider having a structured interview approach with risk personnel to understand the specific issues related to quantitative risk analysis and models in a follow-up study.
• Perform trials with specific software products to understand better the software tools that are currently in the market. This is to understand the adoption and use issues in implementing models fully.
• The questionnaire used in this research contained some questions from which additional data (such as to indicate the percentage of time spent in each step of a typical risk management process) that were not used in this paper were gathered. This data can be analysed as part of a future research paper to address the timing issue of risk management tool use.
• Another aspect that was omitted in this research at this stage was the market drive by clients for their risk management requirements. In some of the project management fields - for instance, in consulting engineering - the client dictates the time and effort spent on risk management, and to what extent risk management is applied. This includes applying only qualitative risk management, or applying both qualitative and quantitative risk management.
• Additional factors that affect tool use have to be identified, as the factors identified in this research do not seem to account fully for all of the variation seen in the analyses. The effect of project type on tool use may thus also be a factor to be considered in future empirical research.
REFERENCES
[1] Zidane, Y.J.-T., Johansen, A. and Ekambaram, A. 2013. Megaprojects - Challenges and lessons learned. Procedia-Social and Behavioral Sciences, 74: pp. 349-357. [ Links ]
[2] Project Management Institute Inc. (PMI). 2013. A guide to the project management body of knowledge (PMBOK® Guide). 5th ed. Newtown Square: Project Management Institute, Inc. [ Links ]
[3] Raz, T., Shenhar, A.J. and Dvir, D. 2002. Risk management, project success, and technological uncertainty. R&D Management, 32(2): pp. 101-109. [ Links ]
[4] Prpic, J. Project Risk Management Incorporating Knight, Ellsberg & Kahneman. 2015. In Proceedings of the 49th Annual Hawaii International Conference on System Sciences. Kauai, Hawaii: Computer Society Press. [ Links ]
[5] Rodney, E., Ducq, Y., Breysse, D. Ledoux, Y. 2015. An integrated management approach of the project and project risks. IFAC-PapersOnLine, 48(3): pp. 535-540. [ Links ]
[6] Breysse, D., Tepeli, E., Khartabil, F., Taillandier, F. and Morand, D. 2013. Project risk management in construction projects: Developing modelling tools to favor a multidisciplinary approach. In Proceedings of the 11th International Conference on Safety, reliability, risk and life-cycle performance of structures and infrastructures, pp. 173-180: CRC Press [ Links ]
[7] Hulett, D.T. 2009. Practical schedule risk analysis. Farnham: Gower Publishing, Ltd. [ Links ]
[8] Hulett, D.T. 2011. Integrated cost-schedule risk analysis. Farnham: Gower Publishing, Ltd. [ Links ]
[9] Vanhoucke, M. 2015. On the use of schedule risk analysis for project management. The Journal of Modern Project Management, 2(3): pp. 109-117. [ Links ]
[10] Vanhoucke, M, 2013. Project management using dynamic scheduling: Baseline scheduling, risk analysis and project control. The Measurable News, 2: pp. 45-50. [ Links ]
[11] Purnus, A. and Bodea, C.-N. 2013. Considerations on project quantitative risk analysis. Procedia - Social and Behavioral Sciences. 74: pp. 144-153. [ Links ]
[12] Nicholas, J.M. and Steyn, H. 2012. Project management for engineering, business and technology. 4th ed. Abingdon: Routledge. [ Links ]
[13] Project Management Institute Inc. (PMI). 2009. Practice standard for project risk management. 1st ed. Newtown Square: Project Management Institute, Inc. [ Links ]
[14] Na Ranong, P. and Phuenngam, W. 2009. Critical success factors for effective risk management procedures in financial industries: A study from the perspectives of the financial institutions in Thailand, Umeâ University, Dissertation. Retrieved from http://urn.kb.se/resolve?urn=urn:nbn:se:umu:diva-25815 [ Links ]
[15] Gibson, M.D. 2012. Critical success factors for the implementation of an operational risk management system for South African financial services organisations, University of South Africa, Pretoria, Dissertation. Retrieved from http://hdl.handle.net/10500/5967 [ Links ]
[16] Labuschagne, L., Marnewick, C., Eloff, M., Steyn, H. and Tobin, P. 2013. Prosperus report - The African edition: Project management maturity versus project outcomes in Africa. Johannesburg: Project Management South Africa. [ Links ]
[17] Cooper, D.F., Bosnich, P., Grey, S., Purdy, G., Raymond, G., Walker, P., and Wood, M.J.., 2014. Project risk management guidelines: Managing risk with ISO 31000 and IEC 62198. 2nd ed. Chichester: Wiley. [ Links ]
[18] Neuman, W.L. 2014. Social research methods: Quantitative and qualitative approaches. 7th ed. (New International). Harlow: Pearson Education Ltd. [ Links ]
[19] Boone Jr, H.N. and Boone, D.A. 2012. Analyzing Likert data. Journal of Extension, 50(2): p. 5. [ Links ]
[20] Montgomery, D.C. and Runger, G.C.,2007. Applied statistics and probability for engineers. 6th ed. John Wiley & Sons. [ Links ]
Submitted by authors 14 Aug 2017
Accepted for publication 9 Oct 2018
Available online 10 Dec 2018
* Corresponding author leon.pretorius@up.co.za
# The author was enrolled for an MEng (Technology Management) degree at the Graduate School of Technology Management, University of Pretoria, South Africa

