


Services on Demand
Article
 English (pdf)
 Article in xml format
 Article references
Indicators

Related links
-
 Cited by Google
 -
 Similars in Google
Share

 Permalink
South African Journal of Industrial Engineering
On-line version ISSN 2224-7890
Print version ISSN 1012-277X
S. Afr. J. Ind. Eng. vol.29 n.4 Pretoria Dec. 2018
http://dx.doi.org/10.7166/29-4-1947
GENERAL ARTICLES
Early fault detection of elevators using remote condition monitoring through IoT technology
Department of Industrial Engineering, Durban University of Technology, South Africa
ABSTRACT
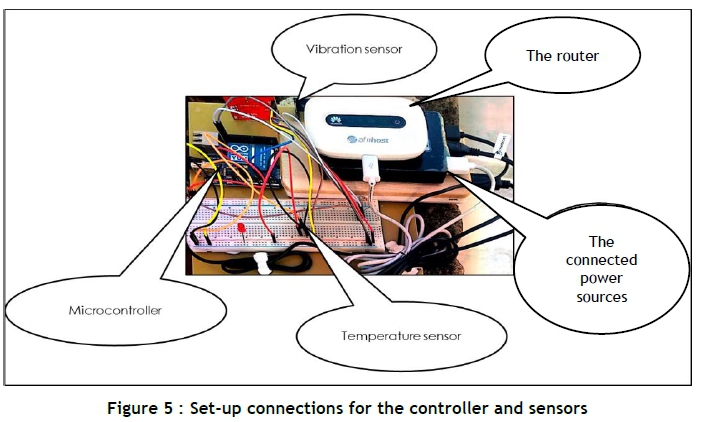
Remote condition monitoring (RCM) of machines seeks to enhance proactive maintenance through just-in-time responses to machine faults and process deterioration. This approach offers the benefit of reduced manning of machines and robust joint maintenance decisions, due to remote access to the machines' condition. This paper employs a remote condition monitoring approach to two elevator parameters, vibration and machine room-temperature, using an Internet of Things (loT) device for remote data acquisition and remote fault indication. A remote monitoring set-up was developed that uses augmented sensors, networked connections, and an Arduino Yun microcontroller installed on the elevator system to monitor remotely any deterioration in its working condition. The set-up was configured to monitor the conditions online remotely through an email application service. The data from the email were analysed, and notifications were generated at the machine's severity level. The result showed that RCM enables faster repair and maintenance decisions, prevents the catastrophic breakdown of machines, and serves as a troubleshooting guide for fault diagnosis.
OPSOMMING
Afstand toestand monitering van masjiene poog om proaktiewe onderhoud te verbeter deur net-in-tyd reaksie op masjienfoute en prosesagteruitgang te bewerkstellig. Hierdie benadering bied die voordeel van verminderde toerusting bemanning en robuuste gesamentlike onderhoud besluite as gevolg van afgeleë toegang tot die toerusting se toestand. Hierdie artikel verskaf 'n afstand toestand moniteringbenadering van twee hysbak parameters, naamlik vibrasie en masjienkamertemperatuur deur 'n internet-van-dinge toestel vir afstand dataverkryging en afstand fout aanduiding. ' Afstand moniteringopstelling, bestaande uit versterkte sensors netwerkverbindings en ' Arduino Yun mikro-beheerder, is geïnstalleer op die hysbakstelsel om enige agteruitgang in die werkende toestand te monitor. Die opstelling is gekonfigureer om die toestand oor 'n afstand te monitor. Die opstelling is gekoppel deur ' e-pos toepassing. Die e-pos data is ontleed en kennisgewings gegenereer op grond van die erns van die toerusting se toestand. Die resultaat toon dat toestand monitering oor ' afstand vinniger herstel- en instandhoudings-besluite moontlik maak, katastrofiese faling van die toerusting voorkom en ook dien as 'n probleemoplossingsgids vir foutbespeuring.
1 INTRODUCTION
Maintenance of machines and facilities is gaining more attention, as it helps to increase productivity and competitiveness through reduced machine downtime and maintenance costs. Augmented automation, alongside reduced manning and increased operating tempos in production machinery, has given rise to a rapid increase in installed machinery sensors in order to repair it faster and to ensure that the equipment operates reliably for long periods [1]. Lifts should be subject to scheduled maintenance and minimum downtimes [2]. The research efforts focus on the construction of a remote monitoring device that applies emerging IoT technology to reporting the state of the elevator system and indicating the severity level of its condition, to support proactive maintenance and provide a deterioration pattern/history before breakdown maintenance is required. Since lift and elevator systems are not manned, the maintenance policy most often adopted is scheduled maintenance. The device was configured to monitor the machine room temperature and vibration parameters, which are instrumental in indicating the malfunction of a system. The monitoring device was installed on the elevator car's roof to monitor the vibration of the elevator car and the drives, and also the machine room's temperature for proper functioning of the controls.
2 LITERATURE REVIEW
Recently, intelligent elevator systems that can be remotely tracked for maintenance have been developed [3]. However, the need for an augmented maintenance monitoring system still cannot be ruled out, as a system's interaction with its environment is peculiar and dynamic. This research seeks to adopt the remote condition monitoring of lifts and elevator systems for the earlier detection of abnormalities in their condition. Several remote monitoring approaches are now being adopted, which may include a self-test remote machine monitoring system or remotely monitoring conditions through augmented automation using IoT devices. Datta et al. [4] developed self-testing software that remotely analyses the industrial machine condition to detect abnormality during operation, and that generates a report on this analysis. The software was interfaced with a USB modem in order to send multimedia messages during any abnormality in the machine's condition. This would assist in providing faster machine maintenance, compared with breakdown maintenance.
In elevator systems, parameters such as the vibration of the elevator car, sound from the drive system, and temperature from the machine room could point to an impending fault in the elevator system [5]. Remote condition monitoring and a pre-alarm system are gradually being developed, based on the Internet of Things (IoT) and cloud computing (CC), achieved with the capability of realtime monitoring [6]. IoT technology and devices create the option of remote condition monitoring, diagnosis, and reporting, thus keeping the maintenance team abreast of the condition of the system. For example, vibration in the elevator car would indicate a malfunctioning drive system or the misalignment of the elevator car on the guide rails [7].
Vibration in the elevator car or lift car is a major condition that indicates the condition of the drive system, while the machine room temperature may indicate the functioning of the control system [8]. A malfunctioning drive system, guides, controls, elevator car, and hall equipment would generate a side sway, oscillation, or vibration of the elevator car [9]. Kwashaka and Mariani [10] performed vibration analysis on traction elevators using three axis accelerometer sensors, Endevco 66A11, to determine the excitation of the system, obtaining five experimental modal analyses. The vibration and temperature parameter is monitored remotely, and the data is logged on the cloud while evaluating the current conditions against the severity level of the parameter. An Arduino Yun IoT microcontroller is used as the principal component in the monitoring system; an SPF 3-AXIS Accelerometer ADXL335 BD vibration sensor is used to capture the vibration data; and an LM 35 temperature sensor is used for the machine's room temperature. The data is captured remotely on the cloud using the email choreo, and an email alert is generated and sent for each severity level of any of the parameters.
3 SYSTEM ARCHITECTURE FOR REMOTE MACHINE CONDITION MONITORING
A system architecture for remote machine condition monitoring meets the requirement of monitoring and measuring the condition of machines, processing the data from the instrument, and accessing the conditions remotely without a physical presence. Our approach adopts the emerging technology of the Internet of Things (IoT) and cloud computing in building the remote monitoring system. IoT concepts with cloud computing have found enough application in a smart home (SH) environment to enable the user to measure home conditions (such as temperature, humidity, luminosity), to manipulate the heating, ventilation, and air conditioning (HVAC) of the home, and to monitor the home security system [11]. The approach in this research makes use of microcontroller enabled sensors to measure the parameters of the elevator, the powered IoT-compliant microcontroller for controlling the whole system connection, and the data transmission from the sensor to the cloud database, which in this case uses the email choreo. The microcontroller works as the control unit, carrying out some logical reasoning and arithmetic on the read sensor data for maintenance decision-making. The platform is therefore categorised into three layers: the sensors layers for data capturing, the API/data transmission layer, and the web application client. Figure 1 illustrates the system architecture for the remote condition monitoring maintenance for a machine, using IoT technology. It has microcontroller-enabled sensors, an API/control unit, and cloud services/Web application as its major components.
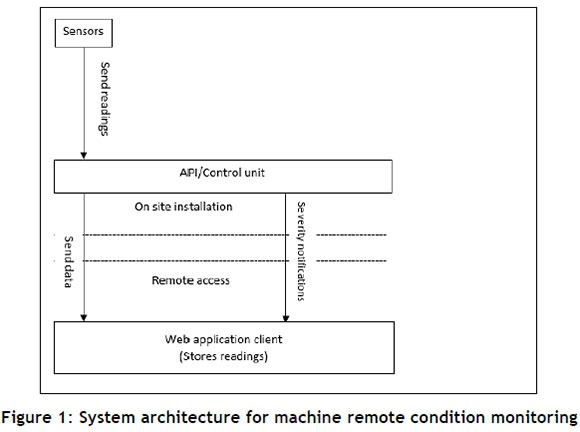
Microcontroller-enabled sensors: These measure the conditions of the machines for both the vibration parameter and the machine room temperature parameter. A Spark Fun SPF 3 Axis Accelerometer ADXL 335 BD SEN-09269, from analog devices with low noise and power consumption of 32μA and a sensing range of +/-3g, is the sensor for measuring the vibration of the elevator car. The angle of inclination of the system, relative to the installation of the sensor, is also considered by the sensor. An LM 35 temperature sensor is used for measuring the temperature of the machine room.
API/control unit: this unit monitors the signal from the sensor and converts it to a digital value that is readable by the operator. The major component in this unit is the microcontroller, which is an loT-enabled microcontroller named Arduino Yun. The controller connects to the cloud through a third-party web application known as Temboo, through which the sensor data and notifications are sent using the email choreo application. The data is then transmitted to the cloud web service and stored in the cloud, where it can be accessed remotely.
Cloud services/Web application: This is the Internet end of the whole set-up that provides the remote link for the data being monitored by the device. This serves as the database for storing the data from the sensors, and as a point for remote access to the data and medium of event notifications. Cloud hosting has significant benefits, such as improved reliability and physical security. The website is hosted on a virtual partition instead of being hosted on one single physical server; this feature spreads the risk, since the pooled cloud resource is drawn from multiple data centres in different locations.
4 DESIGN OF REMOTE CONDITION MONITORING SYSTEM FOR ELEVATOR PARAMETERS
The system architecture was designed to relay the conditions of the elevator system remotely to the maintenance team for prompt proactive and preventive maintenance of the machinery. The elevator maintenance system was discussed at One World Trade Center (WTC) using the Microsoft Azure Intelligent system, which responds to faults proactively by sending service engineers real-time data so that a total breakdown of the elevator can be prevented by feeding the data into a dynamic predictive model [12]. The approach used in this research, however, uses the intelligent ability of the microcontroller to carry out the logical operation of the read values against a predetermined severity condition level of the system while using its IoT capability in sending the data and notifications in the event of an abnormality in the system. Several technologies are emerging on industrial manufacturing machines for better efficiency and maintenance. Asset monitoring, which enables the remote tracking of machines, has emerged from the technology of machine-to-machine (M2M) communication to loT configurations [13]. This has gradually involved the adoption of the loT as an augmented automation of the remote condition monitoring maintenance of machines. The configured remote monitoring device was developed to measure the machine room temperature and the vibration of the elevator car and the drive system, and to send the data to the cloud using a third-party web service known as Temboo.
Machine room temperature: The machine room temperature is important because it houses the controls for the system, and yet it is usually poorly ventilated. Since high temperatures may cause a malfunction in the system, the temperature in the room must be measured and recorded.
Vibration of the elevator car and the drive system: This vibration takes into consideration the guide rails, the drive sheave, the lubrication of the gear box, the braking system, and the deflection of the cable. Figure 2 shows the geared drive system of a traction elevator whose components are susceptible to vibration - the braking system due to wear and tear and shock, the gear due to friction and lubrication - and the drive sheave, which propels the cable.
Sending the data to the cloud: As mentioned earlier, Temboo is used to send the data to the cloud. This web application links and configures the controller to the cloud for loT devices. It consists of different internet applications called choreos, which include Google email, Twitter, SMS, Instagram, Yahoo, PayPal, Amazon, and more than 30 other apps. The Google email choreo, configured on Temboo, was run on the microcontroller to send the data to the cloud.
The aim of this research is to reduce the downtime of the system, eliminating any delay in sending a breakdown notification by using just-in-time condition capturing and severity notifications to the remote monitoring device. This is achieved by developing the remote monitoring device, capturing the mean parameter signals from the elevator systems, coding the controllers with the range of normality for fault indication on the cloud, monitoring the system, and analysing the historical data to generate a fault diagnosis using cause-and-effect analysis.
4.1 Hardware components and connections
The hardware used for the device is the sensors, the microcontroller, the LED, a 5V power source, and jumper wires. The two sensors used in this project are an LM 35 temperature sensor, and the ACM 3 Axis Accelerometer ADXL 345 vibration sensor. The vibration sensor is connected to the female-to-female and male-to-male jumper wires to extend the sensors to the part on the elevator that is sensitive to vibration signals. The microcontroller, the Arduino Yun board, is the most recent loT board from Arduino, with powerful accessories such as WIFI connectivity, ethernet, USB connectivity, and a micro-SD card port, making it dynamic and robust in usage and application. The board is powered by a 5V voltage source, and the 5V power pin on the board is connected to the power rail on the breadboard, as is the ground pin on the board.
4.1.1 Temperature sensor
The LM 35 has three pins: the power, the ground, and the voltage at the common collector, VCC. The power is connected to the power rail, the ground to the ground rail, and the VCC to the analog pin A0. The schematic of the connection is shown in Figure 3.

4.1.2 The vibration sensor
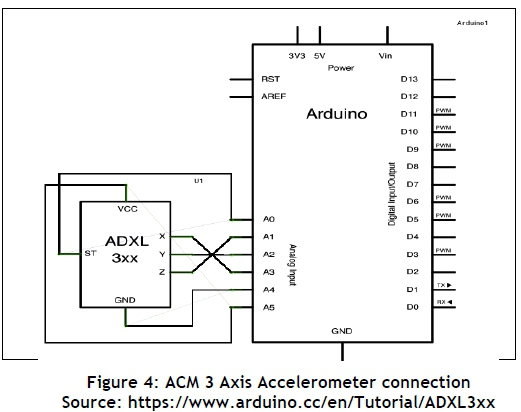
The ACM 3 Axis Accelerometer ADXL 345 is connected to the microcontroller through the breadboard. Its eight pins and connections were fixed to the board using jumper wires, from the power rail to the power pin, from the ground rail to the ground pin, and three VCC pins for the three axial space dimensions to analog input pins 1, 2, and 3. The connections are shown in Figure 4 below. The ADXL 345 has an adjustable measuring range of ±16g and a high resolution of up to 13 bits, with a sensitivity of 40mg/LSB in all ranges, equivalent to an accuracy higher than 1° [14]. This enables events, such as the detection of fast strokes and vibrations, and the detection of 0-g free fall conditions.
4.2 Configuring the Arduino microcontroller
The controller is a major component of the remote monitoring device, as it interprets the signals from the sensors and controls the actuators. The Arduino Yun microcontroller is configured for two settings: the network settings and the sensor data acquisition settings, which make remote condition monitoring possible, unlike site-based on-condition monitoring. The network settings on the microcontroller are configured using wi-fi connectivity or ethernet. Security is a concern for IoT devices, so the default password for the microcontroller and for the wi-fi network for internet access is changed, as is password access. These are imperative: security attacks are problematic for IoT because of the minimal capacity of the devices being used, and the physical accessibility to sensors and actuators together with the microcontrollers at the installation sites [15].
Configuring the microcontroller to read the values from the sensors involves coding, using the Arduino IDE. The latest IDE is downloaded and installed on the PC, and the communication port is initialised with the MAC address of the microcontroller. The code is run on the sketch page; it consists of three parts - the declaration of variables, setting up the code, and comparing the current condition with the severity level.
Considering the calibration of the variables, the variables being considered are the room temperature and the three-axial vibration of the elevator car. The temperature variable name for the read signal is 'templn', which is the sensor signal in varying conditions. The power input is 5V, and the output signal 'tempIn' is also in voltage, which is converted to a Celsius temperature unit. The temperature in Celsius is given by the equation below:

The vibration parameter is read using the 3-axial ADXL 345 accelerometer, which is an analog sensor that works with the analogue to digital converter (ADC) module of the microcontroller. The output value from the accelerometer can be calibrated to values in meters per second or G-force (g). The conversion is done using the equation below;

where AdcRxis the signal value from the sensor, Vrefis the reference voltage, which is 5V, VZeroG is the voltage at zero gravity, n is the number of bits of the sensor and the sensitivity of the sensor.
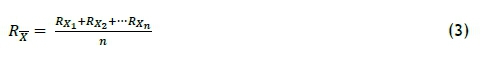
where  is the mean vibration signal on the x, y, and z axes respectively.
This value is determined from the first set of captured data, or from the graph.
The microcontroller reads the signal from the sensor, processes it through the codes, and sends the values out for condition monitoring analysis. The bridge H, which is the protocol that listens and connects the sensor values and also responds to REST API, calls for the sensor values from the controller [16].
4.3 Comparison of current condition with the severity level
The on-condition monitoring maintenance policy of machines monitors the condition of a system for the early detection of deterioration, thereby preventing a critical breakdown of the system. Unlike reactive maintenance, where actions are taken whenever a system failure occurs, on-condition monitoring maintenance checks the condition of the system against the limit threshold, which is the severity limit of each condition of the machine. The limits are determined by the machine manufacturer or through machine data learning algorithms. The excitation and vibration signature during a normal, good working condition of a system can be used as the baseline for developing severity levels from events. The condition of the system is diagnosed by reconciling the current machine condition with the severity limits, and indicating a decision for proactive maintenance before the critical breakdown of the system. This is executed using the lines of code for the sketch that executes the events and logic operations on the controller.
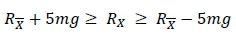
Since the range of vibration under normal working condition is ±5mg:
The controller is coded to send data and a notification. The pseudocode for notification is given by:
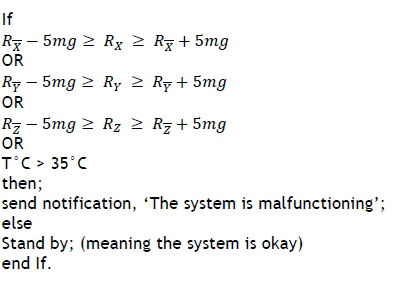
The line of code executes a logic operation that compares the current condition with the severity level as indicated by the machine manufacturer - i.e., the excitation from the mean value of each parameter. Once the severity limit is reached, a notification is sent out.
5 PROGRAMMING THE INTERNET OF THINGS USING ARDUINO YUN
Programming the internet configuration of the device makes the monitoring set-up unique and remotely accessible for monitoring purposes and fault diagnoses. This is because all IoT devices adopt a mechanism to send or receive data, whether wired or wireless, via Bluetooth or cellular network, or many other routes [17]. A wireless connection is established between the microcontroller and the internet, and the email cloud service is used. The data read is sent to the email cloud through Temboo, which assists in connecting Arduino micro-controllers and Arduino-compatible devices to a vast array of web-based resources and services [18]. The third-party service configuration is in two parts: the configuration on the web page, and the configuration on the sketch environment of the Arduino IDE. The google email account is created first. The most important settings for the Gmail account to connect to the Temboo web-account are to get the app-specific password. This is peculiar to the individual email account. To get the app-specific password, it is necessary to activate the two-step verification by turning it on. An account is created on the Temboo web application, registered with the email address that has been created. The Google option is chosen, and then the 'send email' option is chosen. On the same page, the board type (Arduino Yun) is selected, the app-specific password of the email is typed into the Temboo account set-up, and the 'run' button is clicked. This automatically generates lines of code that are copied and pasted into the Arduino IDE. The code or sketch also has to have some input variables, such as the data to be sent to the mail, the email address to be sent to, and the variable declaration and inclusion. The email address, username, password, and message-body are replaced with the information peculiar to this research, the email is created, and the username and Temboo-data password are generated. The header file, which is also generated from the Temboo app configuration, is copied to a separate tab on the Arduino IDE sketch, and the sketch is compiled.
6 DATA CAPTURING
Brittain [19] designed a data capturing engine with automatic target data location, extraction, and storage at an interval of 15 minutes; similarly, the set-up is configured to capture and send the data to the email every 15 minutes. In the case of severity in any of the machine parameters, the message notification is sent along with the machine data. The machine experts can then respond immediately to the fault indication through remote access to the data history on the cloud (via email).
The temperature and the three-axial vibrations were sent to email from the set-up at 15-minute intervals. The temperature value is read out in degrees centigrade, as calibrated through the code, while the vibration data are also calibrated by the code run by the microcontroller on the signal values from the sensor chip. The serial monitors outputs the read data from the sensors. The 'normal' room temperature chosen by the sensor is 27°C.
However, the national elevator industry states that there is a level of temperature at which there is a high chance that the controls will malfunction [20]. Therefore, elevator manufacturers mostly specify temperature limits for the machine room - typically in the 85 to 95°F (30 to 35°) range - which must be maintained in the controller cabinets for the proper functioning of the solid-state devices used in the control system [21]. It was crucial to evaluate the severity of the data; and so the severity limit was set to 36°C. Thus, the logic statement is used, which applies the expert knowledge for decision-making to fault and condition monitoring in the elevator system. Whenever the values indicate a deviation in the normal condition of the machine, they imply that the system is faulty - hence the need for maintenance before total breakdown.
7 DATA PRESENTATION
The data from the remote monitoring device is captured at 10-minute intervals to show the current condition of the system and to detect any deterioration in the machine's condition. The vibration and temperature data from the elevator is captured from the email application service. The data is represented in Figures 6, 7, 8, and 9. The interval between each recorded data set was also recorded, to note the moment of deterioration in the condition of the system. The remote condition monitoring device is employed over the period of a month for maintenance decisions and fault detection in the elevator. During any abnormality in the condition of the elevator system, there is a gradual or a sudden change in the parameters being monitored, which is an excitation in the condition of the elevator, indicating an abnormal condition. The condition subsequently returns to a normal level, which most often shows that there is a breakdown in the working condition of the machine; hence the parameter values are repeatedly the same at subsequent time intervals. Each time the machine is diagnosed to be faulty (from the parameters from the elevator), it is checked by the maintenance team and repaired.
8 RESULTS ANALYSIS
The data from the remote monitoring device was captured instantaneously on the email and checked for a notification of any abnormality in the condition of the system. The condition of the elevator system can be accessed by analysing the data with any statistical tool. The data from the elevator system was represented in graph form by plotting the parameters against time using MATLAB.
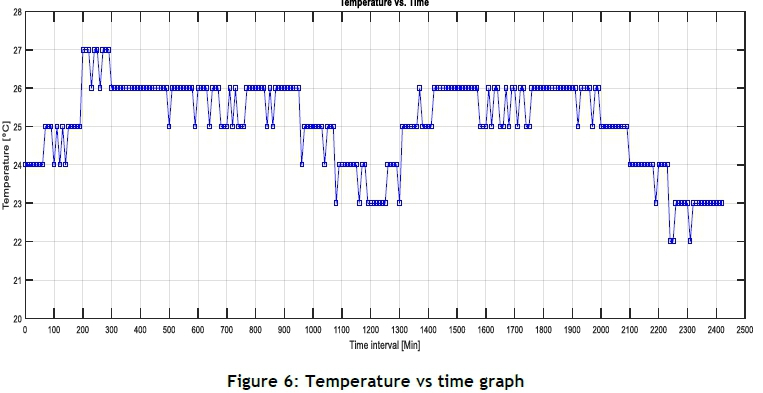
The graph in Figure 6 shows the temperature condition of the system being remotely monitored. The range of the temperature data of the system is 22°C to 27°C, which falls within the normal range for the working condition of the system. Therefore, the breakdown in the elevator system will not be caused by the temperature parameter, since the severity limit of this parameter, as stated earlier, is 33°C to 35°C.
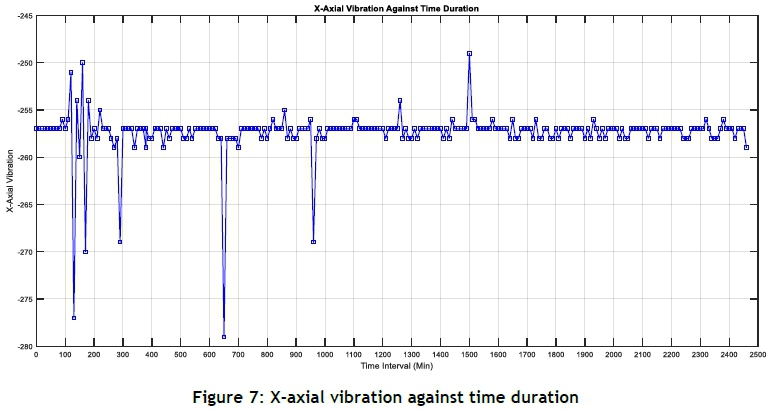
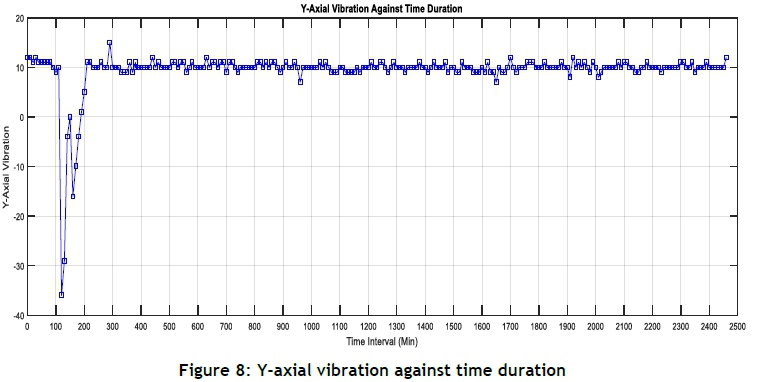
The vibration against the time graph on each of the axes is considered for the diagnosis and analysis of the condition of the elevator system in order to detect faults and malfunctions early, with each notification. The graph of the X-axial vibration is represented in Figure 7, the Y-axial vibration in Figure 8, and the Z-axial vibration in Figure 9.
The elevator's manufacturer, Schindler, states that the vibration of the elevator car should be ±5mg to its mean vibration; therefore, the condition of the system based on vibration is diagnosed, based on this provision. The three-axial vibration graph is considered concurrently for better diagnosis of the state of the elevator system. The mean axial vibrations, IMAGEMAQUI, and are -257 mg, 10 mg, and 2.5 mg respectively, which are evaluated from the set of data before the remote monitoring begins, using Equation 3. The first notification of excitation in the vibration signature of the system beyond the acceptable limit occurred at between 100 and 200 minutes. The excitation in the vibration parameter of the elevator system on the x-axis is meant to be between -260 mg and -250 mg, on the y-axis between 5 mg and 15 mg, and on the z-axis between 0 mg and 10 mg. The malfunctioning of the system was indicated on each of the three axial vibration parameters. The corresponding excitation on the vibration parameter for all three axes at the same time shows that there is a damage initiation in the system's condition. This has remotely diagnosed the elevator's condition as being faulty; so proactive maintenance is needed to restore the faulty system to its normal working condition. Remote condition monitoring through the developed IoT configured device reduces the downtime of the elevator system, avoiding delayed breakdown notifications.
The corresponding data after the excitation that went beyond the normal working condition also indicated that the system had broken down, which was affirmed on-site. A constant vibration parameter value on all three axes of vibrations using the three-axial vibration sensor installed on the elevator system may, therefore, indicate a breakdown in the elevator system, or an idle state of the system.
Further excitations beyond the normal limit occurred at 290 minutes, with an excitation of -269 mg; at 650 minutes, with an excitation of -279 mg; at 960 minutes, with an excitation of -269 mg; and at 1500 minutes, with an excitation of -249 mg. Each excitation is an indication of a malfunction in the system that indicates immediate proactive maintenance.
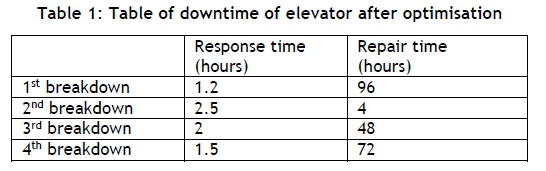
Four different breakdowns experienced by the elevator systems were captured during a 30-day period. The first breakdown occurred at 220 minutes, with a downtime of 96 hours; the second breakdown occurred at 650 minutes, with a downtime of four hours; the third breakdown occurred at 980 minutes; and the final breakdown at 1580 minutes. The parameters considered were the temperature and the three-axial vibration, used to diagnose the state of the elevator system, and the nature of the damage initiation. The collection and analysis of vibration signals can be used to judge the degree and type of mechanical fault, which can provide effective evidence to detect the running state and fault diagnosis of elevators [22]. In this study, the vibration parameter is considered more than temperature in diagnosing the nature of the fault and breakdown in the elevator system. This is because the season of the year in which the study was carried out was winter, which automatically erodes the likelihood of having the temperature parameter exceeding the severity limit stipulated by the elevator manufacturer. The three-axial vibration graph is considered in order to diagnose the current state of the elevator system. In order to have an efficient maintenance system, each critical point on any of the axial vibrations is considered to be a potential damage initiation. The first notification of a critical point on the x-axial vibration occurred at 120 minutes of the condition monitoring system. The system's x-axial vibration moved from -256 mg to -251mg, and further measurements indicated a malfunctioning system until 140 minutes from the beginning of the condition monitoring. In order to have a better understanding of the condition of the system, other axial vibrations were checked at this point in the condition monitoring (120 - 140 minutes). The graph of the excitation on each axis at that time (120 -140 minutes) is represented in Figure 10.
The excitation on the vibration parameter of the elevator system at this point occurred on all three axes, which indicated a damage initiation or malfunctioning of the elevator system. It could also be deduced from the combined graph in Fgure 10 that the magnitude of the excitation from the mean position of the elevator system on each of the axes was high. This meant that the condition of the elevator system was severe, and that the system needed to be shut down for reactive maintenance. The condition of the system became stable after 200 minutes, and all the excitation on the three-axial vibration became normal. The elevator system was checked on-site 72 minutes after the damage initiation, which was at about 272 minutes of the condition monitoring, and the system had stopped working. It could then be explained that the system had stopped after the arbitrary excitation in the vibration parameter of the system, and the subsequent data after the breakdown of the system was just the resting position of the system. This was the first breakdown experienced during the remote condition monitoring of the elevator system. The response time of the damage initiation was one hour and twelve minutes, as indicated in Table 1.
The response time of the damage initiation is the time taken for the maintenance team to note the breakdown in the system and to plan reactive maintenance. This has previously been a considerably long period because of the remoteness of the elevator system from the maintenance team, and the absence of an operator on the elevator system. The IoT monitoring system was therefore used to bridge the gap created by the absence of an operator and brought the benefit of instantaneous monitoring of the machine condition for malfunctioning and breakdown, reducing or eliminating the machine downtime thanks to the quick response time of the maintenance team.
The first breakdown in the elevator system took the maintenance team 96 hours to fix, as indicated in Table 1. This was as a result of the breakdown in the system caused by an obstruction on the guide rail of the elevator car. The obstruction had caused the elevator car to vibrate beyond its normal functional range on all three axes, before eventually forcing the system to stop. The data during the response time of the system's breakdown and the repair time was discarded, and the remote monitoring system was activated after the repair of the first breakdown in the elevator system.
The next excitation beyond the normal range of vibration on the x-axis occurred at 290 minutes of the condition monitoring. The excitation on the x-axis at this point was -269 mg, which was outside the normal vibration range on the x-axis. To check the likely condition of the system further, the other axial vibration data showed that there was also a corresponding excitation in the vibration parameter of the y-axis, but none on the z-axis. Subsequently, after 310 minutes the data of the condition monitoring became normal. A breakdown in the system occurred and was noticed after about 150 minutes, which was about 460 minutes after beginning the remote condition monitoring. The breakdown in the elevator system had occurred after the sudden excitation in the vibration parameter on both the x-axis and the y-axis. The nature of the vibration signal had suggested that the system was still running well after the sudden excitation. The fault experienced by the system was a break in one of the fuses on the controls. The response time for the breakdown as a result of this fault in the system was 150 minutes, as shown in Table 1. The downtime of the system as a result of the repair of the fault was four hours, also shown in Table 1. The next excitation in the vibration parameter on the x-axis occurred at 650 minutes of the remote condition monitoring system. The vibration on the x-axis excited from 258 mg to -279 mg. The vibration of the elevator system on both the y-axis and the z-axis were still within the normal condition at 650 minutes of remote monitoring. The response time to this malfunction in the elevator's condition was two hours, as indicated in Table 1. The fault indication in this case had also brought the system to a stop.
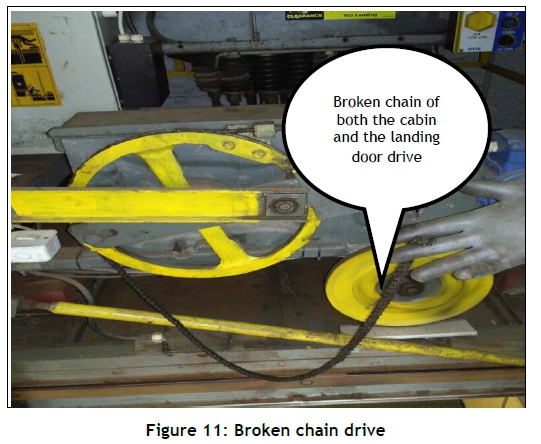
The third breakdown notification experienced by the elevator system was as a result of the chain of the cabin and landing door drive breaking. Figure 11 shows the broken chain that drives both the cabin and landing door. This fault affected the whole elevator system, as the system had been programmed to shut down once the door drive or system was faulty; thus, it was brought to a stop. The repair time for this fault in the system was 48 hours, as also shown in Table 1. The repair in this case was to replace the damaged component.
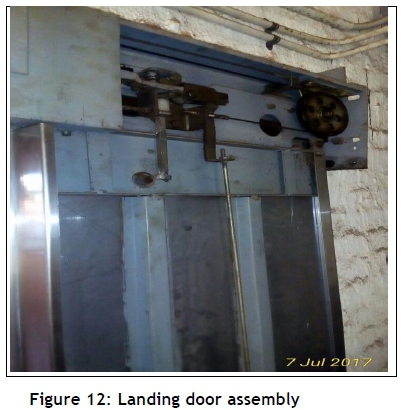
The fourth breakdown notification in the system occurred at 960 minutes of the remote condition monitoring system. The vibration excitation occurred on the x-axis of the system from a magnitude of -258 mg to -269 mg. There was also a little excitation, between 10 mg and 7 mg, on the y-axis of the system, but this could not independently reveal the condition of the system. However, when considered alongside the excitation on the x-axis, it could suggest that the system was malfunctioning. The vibration of the system on the z-axis remained within the normal range. The elevator had been brought to a stop due to the faulty assembly of the cabin door drive. This caused the cabin door to jam, and the system was automatically brought to a stop. The cabin assembly is shown in Figure 12; it engages and disengages during the closing and opening of the landing door for access to the elevator car.
The response time for this breakdown in the system was 90 minutes, while the repair time for the fault in the system was 72 hours. Remote condition monitoring of the elevator system using a device with loT technology helped to lower the response time for each breakdown in the elevator system because of the instantaneous notifications. Apart from reducing the response time of the maintenance team for reactive maintenance, the remote condition monitoring device captured data through the configured sensors, which also pointed to the nature of the fault on the system.
The remotely acquired vibration signals and the room temperature from the elevator system could be used to learn the signals for a fault, and to diagnose the system by adopting the cause-and-effect principle. This is used in diagnosing the state of the system, and further reduces the downtime due to troubleshooting the fault on the system.
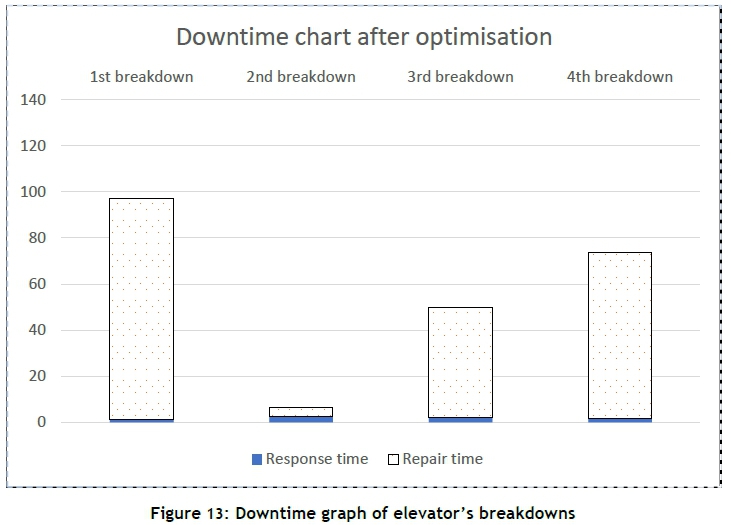
The cause-and-effect table can also be used to predict the likely cause of a malfunction in any subsequent breakdown, based on the data captured remotely by the loT device installed on the machine. The faults experienced by the elevator system include a damaged braking system, a broken door chain, a door rail obstruction, malfunctioning controls, etc. The faults often result in a high rate of downtime due to notification of a fault by the maintenance team. Table 1 shows the downtime data of the maintenance of the elevator system after optimising the condition used by the loT monitoring device.
The downtime of the elevator at each breakdown due to delayed notification is indicated by the response time of the maintenance team. Table 1 shows the response time and the repair time at each breakdown of the elevator system after optimising the system. The downtime due to the response time after each breakdown occurs is relatively lower than the repair time. ln Figure 13, the dotted bar region represents the repair time, and the shaded bar region the response time by the maintenance team. It shows the downtime graph of the system's breakdowns before implementing remote condition monitoring, while Figure 13 shows the results after implementation. It reveals that optimising the system using remote condition monitoring techniques results in a reduction in the system's downtime due to delayed breakdown notification.
The downtime due to the response time at damage initiation has been considerably reduced by adopting remote condition monitoring, and the downtime due to repair time is dependent on the nature of the damage to the elevator system. Historical data from the remote monitoring device could be analysed using the cause-and-effect technique, as shown in Table 2, to diagnose the nature of the damage to the system, thus reducing the downtime by troubleshooting the fault and carrying out the repairs.
Breakdowns and faults in the machines can therefore be picked up by networked sensors for each separate parameter, such as temperature, vibration, and acoustics. When multi-sensors of different parameters are networked on machine components for condition monitoring, this will give a broader view in order to analyse the condition using the captured data.
9 CONCLUSION
IoT is being increasingly applied in industries, from embedded systems to the augmented automation of machines. IoT technology has made robust applications possible that are suitable for remote machine condition monitoring at remote locations using a network of sensors. This paper has explored an approach to remote condition monitoring of an elevator system, sending fault notifications for early breakdown detection, without a physical presence. This research has aimed to reduce downtime of the elevator system due to delayed notifications of a breakdown in the system, and also to monitor the historical data of the damage initiation and fault diagnosis on the system. A remote monitoring device was therefore developed, comprising mostly sensors for temperature and vibration, an IoT-enabled microcontroller, and other electronic components. The device was installed on the system at a location on the hoistway on the outer cabin roof. This helped to reduce machine downtime due to delayed response times after breakdowns in the system by sending a notification, just in time, during damage initiation. Furthermore, since the data from the machine is stored in the cloud and can be assessed remotely, this provides a faster maintenance service, as the maintenance team can access the data online and study the deterioration pattern to work out the likely nature of the damage to the system. This approach could also be adopted to monitor components or machine parts located in remote locations in machines that are difficult to access by an operator while the machine is in operation. The remote condition monitoring approach using IoT technology could also be adopted in monitoring systems or work operations in hazardous environments, thereby reducing the downtime of the machine due to breakdown, and avoiding the risks posed to human life.
REFERENCES
[1] Khazraei, K., 2011. Design, organization and implementation of a methods pool and an application systematics for condition based maintenance. Verlag Praxiswissen. Ph.D Thesis, Technische Universitat Dortmund, Germany [ Links ]
[2] Heyes, E. & Spearpoint, M. 2012. Lifts for evacuation: Human behaviour considerations. Fire and Materials, 36(4), pp. 297-308. [ Links ]
[3] Chandran, A. & Chandranandan, T. 2016. Manual elevator for material handling. International Journal of Engineering Research, 5(4), pp. 279-280 [ Links ]
[4] Datta, J., Bera, J. & Chowdhuri, S. 2016. Development of remote monitoring analysis and reporting system for industrial machines. Paper presented at the 2nd International Conference on Control, Instrumentation, Energy & Communication (CIEC), 2016. [ Links ]
[5] Weinberger, K., Inventio AG, 2015. Elevator installation with a sound pick-up. U.S. Patent 9,004,231. [ Links ]
[6] Sun, E., Zhang, X. & Li, Z. 2012. The internet of things (IOT) and cloud computing (CC) based tailings dam monitoring and pre-alarm system in mines. Safety Science, 50(4), pp. 811-815. [ Links ]
[7] Weinberger, K. and Schuster, K., Inventio AG, 2006. Device and method for remote maintenance of an elevator. U.S. Patent 7,073,633. [ Links ]
[8] Hickey, S. 2016. 230000: General mechanical requirements. University of New Hampshire, USA. [ Links ]
[9] Al-Kodmany, K. 2015. Tall buildings and elevators: A review of recent technological advances. Buildings, 5(3), pp. 1070-1104. [ Links ]
[10] Kawasakia, R. & Nishimurac, Y.H.M. 2010. Inter Noise 2010: Noise and sustainability. Paper presented at the Inter noise 2010, Portugal [ Links ]
[11] Fiorenza, J. & Mariani, A. 2015. Improving trigger action programming in smart buildings through suggestions based on behavioral graphs analysis. Ph.D, Politecnico Milano, Available: http://hdl.handle.net/10589/115082 (Accessed 20 March 2018) [ Links ]
[12] Petroski, H., 2018. Success through failure: The paradox of design. Princeton University Press. [ Links ]
[13] Höller, J., Boyle, D., Karnouskos, S., Avesand, S., Mulligan, C. and Tsiatsis, V., 2014. From machine-to-machine to the internet of things (pp. 1-331). Cambridge: Academic Press. [ Links ]
[14] Bot-Shop. 2017. Retrieved from https://www.botshop.co.za/product/adxl345-3-axis-digital-gravity-sensor-acceleration-module-tilt-sensor/?gclid=Cj0KEQjww7zHBRCToPSj_c_WjZIBEiQAj8il5OB9mkNmv8gCbQtXMYYD5EeIDvsXAtgTT8HLjLcSsE4aAiEs8P8HAQ (Accessed on: 04 November 2017) [ Links ]
[15] Stankovic, J.A. 2014. Research directions for the internet of things. IEEE Internet of Things Journal, 1(1), pp. 3-9. [ Links ]
[16] Sandhya, P. & Kanth, G.K. 2016. Sensor network accessing cloud services for data collection and sharing using Arduino Yun. International Journal of Scientific research, vol. 4, issue 9, pp.660-663, Sept. 2015. [ Links ]
[17] Javed, A. , 2016. Building Arduino Projects for the Internet of Things. Experiments with Real-World Applications. United States of America: Apress Media, LLC. pp. 15-34. [ Links ]
[18] NYC-High-Tech-Staff (Producer). 2017. Temboo IoT Platform. Information Technology (IT) and Robotics. Retrieved fom http://newyorkcityhightech.com/temboo-iot-platform/ (Accessed on: 13 Sepemter 2017) [ Links ]
[19] Brittain, D.A., 2004. System and methods for easy-to-use periodic network data capture engine with automatic target data location, extraction and storage. U.S. Patent 6,810,414. [ Links ]
[20] National Elevator Industry Inc. New York. 2014. An Introduction to Elevator Maintenance Control Programs. Available: http://www.neii.org/insider/editions/20140521.pdf (Accessed: 12th March, 2018) [ Links ]
[21] Marchitto, N. 2016. High temperature operation of elevators - NIST. Retrieved from https://www.nist.gov/document-10222. (Accessed on: 18th January 2018) [ Links ]
[22] Qifeng, F., Guoqing, C. & Zibo, S. 2016. Application of wavelet de-noising method in vibration signal analysis of elevator car. Paper presented at the 13th International Conference on Ubiquitous Robots and Ambient Intelligence (URAI), 2016. [ Links ]
Submitted by authors 19 /Mar 2018
Accepted for publication 22 Aug 2018
Available online 10 Dec 2018
* Corresponding author IsaacO@dut.ac.za
# The author was enrolled for an M Eng (Industrial) degree in the Department of Industrial Engineering, Durban University of Technology, South Africa

