


Services on Demand
Article
 English (pdf)
 Article in xml format
 Article references
Indicators

Related links
-
 Cited by Google
 -
 Similars in Google
Share

 Permalink
South African Journal of Industrial Engineering
On-line version ISSN 2224-7890
Print version ISSN 1012-277X
S. Afr. J. Ind. Eng. vol.29 n.3 Pretoria Nov. 2018
http://dx.doi.org/10.7166/29-3-2077
SPECIAL EDITION
Tensile and high cycle fatigue properties of annealed Ti6Al4V (ELI) specimens produced by direct metal laser sintering
L.B. MalefaneI, *; W.B. du PreezI; M. MaringaI; A. du PlessisII
IDepartment of Mechanical and Mechatronics Engineering, Central University of Technology, Free State, Bloemfontein, South Africa
IICT Scanner Facility, Stellenbosch University, Stellenbosch, South Africa
ABSTRACT
The tensile and high cycle fatigue (HCF) properties of high temperature annealed (HTA) direct metal laser sintered (DMLS) Ti6Al4V extra low interstitial (ELI) machined and polished specimens were investigated. The HTA heat treatment of the specimens resulted in the nucleation and growth of the alpha and beta grains from the acicular a1martensite grains, improving their elongation to failure. The specimens were micro-CT scanned in an attempt to relate the pores in the specimens to their fatigue properties. The micro-CT pore information from suspected crack initiation pores on the surfaces of eventual fracture was used to calculate the stress intensity factors, which correlated well with the decreasing cycles to failure of the fatigue test specimens for all three build directions. Three representative specimens were analysed, and the 'killer pore' was identified in each micro-CT scan and fractograph, all of which were proximal to the surface of the specimen.
OPSOMMING
Die trek- en hoë-siklus vermoeidheidseienskappe van hoë temperatuur uitgegloeide direkte metaal lasergesinterde Ti6AL4V ekstra lae interstisiële gemasjineerde en poleerde monsters is ondersoek. Die spesifieke hitte behandeling van die monsters het gelei tot kernvorming en groei van alfa en beta korrels van die naaldvormige a1martensiet korrels; dit het hul verlenging voor faling verbeter. Die monsters is op 'n mikroskaal skandeer in 'n poging om n verband te vind tussen die porieë in die monsters en hul vermoeidheidseienskappe. Die porie inligting van vermoede kraakinisiëring porieë op die oppervlakke en gevolglike verbreking is gebruik om die spanningintensiteit te bereken. Dit het korreleer met die verminderde siklusse tot faling van die monsters vir al drie bou rigtings. Drie verteenwoordige monsters is analiseer en die porie waar die kraking begin het, is in elke geval identifiseer. Al hierdie gevalle was proksimaal tot die oppervlak van die monster.
1 INTRODUCTION
Direct metal laser sintering (DMLS) uses the principle of slicing a solid 3D computer aided design (CAD) model into multiple layers, and then uses a heat source to build up the part, layer on layer [1]. The DMLS process has the advantage over conventional subtractive manufacturing methods of producing complex custom parts with little to no waste, and has gained acceptance in the medical and aerospace industries.
DMLS produced parts might sometimes display a level of porosity that is detrimental to their mechanical properties. This paper focuses on the mechanical properties of DMLS Ti6Al4V (ELI), a commonly used alloy in both the medical and aerospace industries. Porosity in DMLS Ti6Al4V (ELI) arises from gas entrapments within a part during the powder melting that are characterised by small spherical geometries [2]. It also arises from the lack of fusion of the powder as a result of un-melted or semi-melted powder [2, 3]. The lack of fusion pores is bigger than the gas entrapment pores, which are oval shaped and located between two consecutive layers formed during the DMLS process [3, 4]. These pores, inherent in the DMLS specimens, act as stress concentration sites, and are expected to lower the tensile and fatigue properties of the specimens and determine the locations of the fracture planes in the specimens [5, 6]. The ultimate tensile stress (UTS) of a specimen is determined by dividing the maximum applied force on the stress strain graph by the measured original cross-section area of the specimen [5]. Therefore the projected areas of these pores in the fracture plane reduce the actual cross-sectional area of the specimen, thus increasing the stress experienced by the built material to a value exceeding the UTS at a force below the maximum applied force. These pores also result in a change in stress intensity factor (ΔΚ) during dynamic loading, the magnitude of which depends on the applied change in stress (Δσ), the projected pore area normal to Δσ, and its location, whether internal or at the surface. The initiation of cracks from these pores can be explained using the theory of linear elastic fracture mechanics (LEFM) applied to fatigue loading, where the initiation and propagation of cracks from small defects and non-metallic inclusions is described by Equation 1 [6, 7, 8]:

In Equation 1, the constant C is taken to be 0.65 for surface defects or non-metallic inclusions, and 0.5 for internal defects or non-metallic inclusions [6, 7, 8]. A pore or inclusion that results in a value of ΔΚ that is larger than the change in stress intensity threshold (ΔΚth) will lead to propagation of the crack, and eventual failure of the loaded object.
2 METHODOLOGY
2.1 Specimen preparation
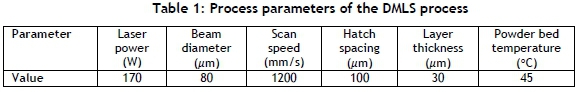
Ti6Al4V (ELI) rectangular bar specimens of width (W) and depth (D) of 12 mm each and length (L) of 60 mm were built. The bar specimens were built orientated along the X-, Y- and Z-directions, as shown in Figure 1. They were built by an EOSINT M 280 DMLS machine set to the standard process parameters given in Table 1.

2.2 Post-DMLS heat treatment
After the bars were built, and while still attached to the build substrate, they were heated to 650°C at a rate of 3.3°C/min and held isothermally at this temperature for three hours, and then furnace cooled to room temperature. This was to relieve the specimens of the internal thermal residual stresses resulting from the DMLS process. The stress relief treatment was performed in a horizontal carbolite furnace filled with argon to create an inert atmosphere to reduce the chances of Ti6Al4V (ELI) reacting with oxygen. After stress relieving, the specimens were cut from the build substrate by wire electrical discharge machining, and placed in a horizontal vacuum tube furnace for a high temperature anneal (HTA). The tube furnace was heated at a rate of 5°C/min to 950°C, which is above a' - a and a - β transformation start temperatures [9, 10]. The parts were then held at 950°C for two hours, followed by furnace cooling to room temperature. This treatment was done under a high vacuum of 10-5 torr.
2.3 Machining and polishing
The DMLS TÍ6A14V (ELI) rectangular bars were turned to the dimensions of fatigue and tension test specimens recommended in ASTM E466-15, ISO 1099, and ASTM E8/E8M-13a respectively. The grip ends of the test specimens were threaded to minimise slip between the test specimens and the gripping device on the fatigue and tension test frame. Polishing of the fatigue and tension test specimens was done on a Morrison specimen polishing machine at the CSIR in Pretoria, in order to achieve a surface roughness not exceeding 0.1 μm.
2.4 Micro-CT scanning
The gauge lengths of the specimens were micro-CT scanned at the Stellenbosch University CT scanner facility using a General Electric V/TomeX L240 system set to optimum parameters. The X-ray source was set to 160 KV and 100 μΑ and copper beam filtration of 0.5 mm, with a voxel size set to 15 μπι. The image acquisition time was 333 ms per image, and was recorded in 800 rotation steps during a full 360 degrees rotation of the sample. At each step position, the first image was discarded, and the subsequent two images were averaged to provide high quality. The detector shift was activated to minimise ring artefacts, and an automatic scan optimiser was activated to eliminate artefacts due to possible movement of the specimens or drift of the X-ray spot. Reconstruction was performed in system-supplied Datos reconstruction software. Visualisation and analysis were performed by Volume Graphics VGStudioMax 3.1 software. Further details of the hardware can be found in reference [11], and optimisation procedures to obtain high quality data as in this work are detailed in reference [12]. For all specimens, the projected area of the pores identified in micro-CT data in the location of the eventual fracture plane (suspected to be crack initiation pores) was used to calculate a stress intensity factor (ΔK). In this work, three selected data sets (X12, Y12, and Z12) were further analysed, and the 2 mm section in the vicinity of the fracture plane was selected; further image smoothing was applied and defect analysis performed. This allowed the proper identification of all pores in the location of final failure, helping to identify the 'killer pores' and allowing the collection of more detailed information on these pores. The visualisation of this region alone was used to simplify the visual representation, and colour coding was applied to show the distance of the pore relative to the surface of the specimen.
2.5 Tensile testing
The round machined and polished HTA DMLS Ti6Al4V (ELI) tensile test specimens were tension tested on an Instron 1342 servo-hydraulic testing machine with a clip-on extensometer of 12.5 mm.
2.6 Fatigue testing
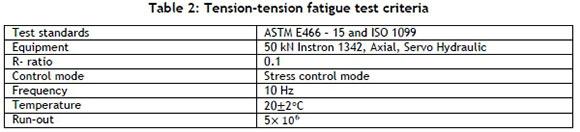
High cycle fatigue (HCF) tension-tension fatigue tests of the machined and polished HTA DMLS Ti6Al4V (ELI) specimens were carried out at the Mechanical Testing Laboratory of CSIR, Pretoria under the test criteria given in Table 2.
The maximum stress (σmax) loading regime from which the semi log S-N curves were drawn was set between 675 MPa and 450 MPa for each set of specimens built in each of the three mutually orthogonal DMLS build directions. The first test specimen in each set of specimens was tested at 675 MPa, which is 73 per cent of the average HTA DMLS Ti6Al4V (ELI) UTS. This is a stress level at which failure was expected to occur at a fairly small number of cycles [6]. The second specimen in each set of specimens was tested at 450 MPa (50 per cent of the average HTA DMLS Ti6Al4V (ELI) UTS), where a run-out (5,000,000 load cycles) was expected. The remaining specimens were cycled at σmaxlevels set at intervals between 675 MPa and 450 MPa.
3 RESULTS AND DISCUSSION
3.1 Tensile properties of high temperature annealed DMLS Ti6Al4V (ELI)
A summary of the tension test results of the HTA DMLS Ti6Al4V (ELI) specimens built in the X-, Y-, and Z-build directions respectively is presented in Table 3.
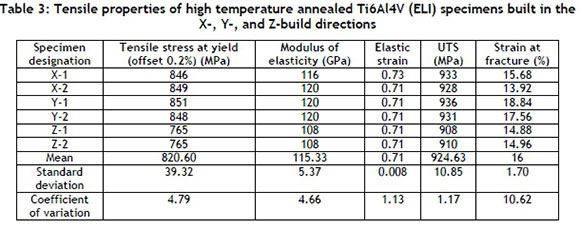
Previously, the tensile properties of HTA DMLS Ti6Al4V (ELI) were found to show a level of anisotropy with respect to the DMLS build direction [4]. From Table 3, specimens built in the X- and Y-build directions showed similar strain at fracture, and 0.2 per cent proof stress, UTS, and modulus of elasticity; whereas the specimens built in the Z-build direction showed lower strain at fracture, and 0.2 per cent proof stress, UTS, and modulus of elasticity. However, despite the presence of this apparent anisotropy in the HTA DMLS Ti6Al4V (ELI) tensile properties with reference to the DMLS build directions, the values obtained were all consistent with the properties specified for wrought and cast Ti6Al4V medical implants in ASTM F1108 and ASTM F1472 respectively.
3.2 Fatigue properties of high temperature annealed DMLS Ti6Al4V (ELI)
3.2.1 X-build direction specimens
Table 4 shows the values of the maximum tension-tension fatigue stresses, and the corresponding number of load cycles to failure or run-out of the tested specimens. It also gives the calculated values of ΔK from the DMLS process-related crack initiation pores of the respective specimens.
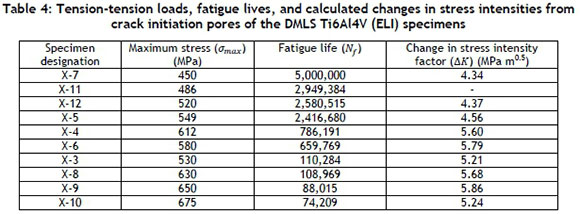
The cracks of the fractured specimens initiated from surface and sub-surface DMLS process-related pores. The values of ΔK presented in Table 4 were calculated from the principle of LEFM using Murakumi's expression [6], given here as Equation 1, with the projected areas of the pores normal to the loading axis measured from the micro-CT scans of the respective specimens. From Table 4, it can be seen that an increase in the ΔK led to a decrease in the number of load cycles to failure. This is because the increase in ΔK above the local yield stress of a material at the pore tip increases the rate of local plastic deformation, thus increasing the rate of micro-crack propagation [13, 14]. This did not apply to specimen X-11, which fractured at the grip ends and was regarded as an outlier. The biggest DMLS process-related pore identified by the micro-CT scan in specimen X-7, which was considered to have experienced a run-out, had a calculated value of ΔK = 4.34 MPa m0.5. This has been taken here as a value below the threshold change in stress intensity factor (ΔKth).
Figure 2 presents a semi-log curve of the maximum stress against the number of load cycles (S-N) for the X-build direction HTA DMLS Ti6Al4V (ELI) specimens.
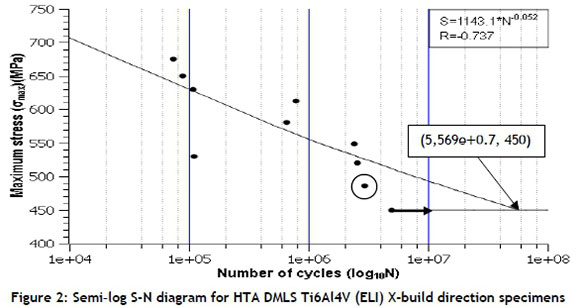
The semi-log S-N plot in Figure 2 shows the typical curve profile of steels and titanium alloys of linearly decreasing magnitude of the maximum stress (σmax) with the natural logarithm to base 10 of the life (log10 N), up to a point defining the endurance limit. It is noted that the endurance limit in this case was higher than the set run-out of 5,000,000 cycles, when testing was stopped and used to estimate the endurance limit, as run-out is typically selected according to the expected application [15]. The fatigue endurance limit of the X-build direction DMLS HTA Ti6Al4V (ELI) specimens, according to the semi-log S-N plot in this figure, is seen to be σmax = 450 MPa, which was found for specimen X-7, indicated by an arrow in Figure 2 [5]. This endurance limit is at a level of 48 per cent with reference to the average UTS of the X-build direction HTA specimens presented in Table 3.
Specimen X-11, circled in Figure 2, was not included in the linearisation of the fractured specimens, as it fractured from the grip ends and was regarded as an outlier. The correlation coefficient (R) of -0.737 indicates a strong inverse linear relationship between σmaxand log10N for the X-build direction DMLS HTA Ti6Al4V (ELI) specimens. Extrapolation of the linearised curve for the fractured specimens and the horizontal curve for the fatigue endurance limit at σmax = 450 MPa resulted in an estimate of the knee point at 55,690,000 load cycles, as indicated in Figure 2. This knee point estimate is higher than the estimated value for the as-built X-build direction DMLS Ti6Al4V (ELI) specimens in reference [16] and assumed here during testing. This implies an increase in the number of load cycles to failure of DMLS Ti6Al4V (ELI) specimens after the application of the HTA process [16].
3.2.2 Y-build direction specimens
Table 5 shows the values of the maximum tension-tension fatigue stresses and the corresponding number of load cycles to failure or run-out of the test specimens. It also gives the calculated values of ΔK from the DMLS process-related crack initiation pores of the respective specimens.
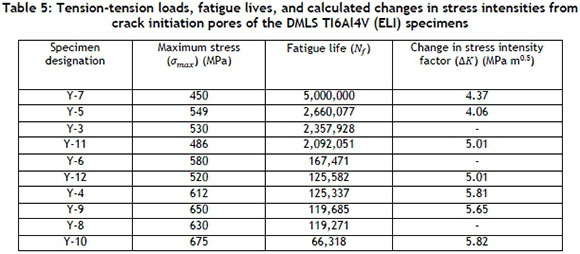
The fractures from this set of specimens were from cracks initiating from DMLS process-related pores located at the surface, the sub-surface, or within the cross-section of the specimens. Table 5 shows a similar trend of a decrease in stress intensity with the increase in the number of load cycles, as shown in Table 4. This conclusion was drawn for all specimens shown in the table, with the exception of specimens Y-3, Y-6, and Y-8. Specimens Y-3 and Y-6 fractured at the grip ends and were considered outliers. The internal crack initiation pore within specimen Y-8 could not be located on the micro-CT scan data, and ΔK from this pore could therefore not be calculated. The largest DMLS process-related pore that was identified by micro-CT scanning of specimen Y-7, which was considered to have experienced a run-out, had a calculated value of ΔK = 4.37 MPa m0.5. This has been taken here as a value below the ΔKth. However specimen Y-5 fractured from a crack that propagated from a pore, with ΔK below the value of ΔK = 4.37 MPa mo.5, calculated from the biggest DMLS process-related pore identified by the micro-CT scan from the run-out specimen Y-7. This resulted from the relatively high magnitude of the stress load, because an increase in the magnitude of the stress load without an increase in ΔK results in a decrease in the number of load cycles to failure [15]. This is also applicable to flawless specimens.
Figure 3 presents a semi-log curve of the maximum stress against the number of load cycles (S-N) of the Y-build direction DMLS Ti6Al4V (ELI) specimens.
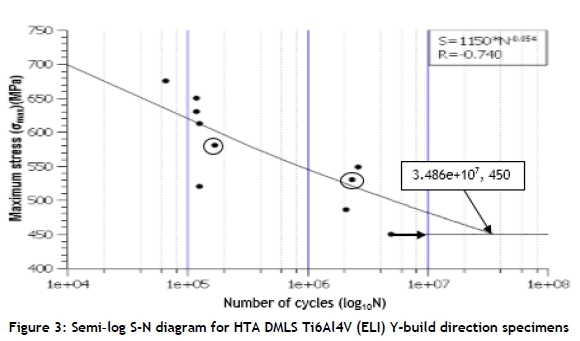
The fatigue endurance limit for the Y-build direction HTA DMLS Ti6Al4V (ELI), according to the semi log10 S-N plot in Figure 3, is seen to be σmax = 450 MPa. This was estimated from the run-out specimen Y-7, indicated by an arrow on the figure. This is 48 per cent of the average UTS of the Y-built HTA DMLS Ti6Al4V (ELI) specimens presented in Table 3. The fractured specimens showed a strong inverse linear relationship between the σmaxand log10 N, given by a correlation coefficient (R) of -0.737. Linearisation of the fractured specimens was carried out, excluding outlier specimens Y-3 and Y-8 (circled in Figure 3). The gradient of the linearised curve for the fractured specimens resulted in a knee point with a number of cycles of 34,4860,000, which is higher than the set runout of 5,000,000. This gradient is higher than that of the as-built DMLS Ti6Al4V (ELI) fractured specimens, which implies that the post-DMLS HTA of Ti6Al4V (ELI) specimens resulted in an increase in the number of load cycles to failure.
3.2.3 Z-build direction specimens
Table 6 shows values of the maximum tension-tension fatigue stresses and the corresponding number of load cycles to failure or run-out of the test specimens. It also gives calculated values of ΔΚ from the DMLS process-related crack initiation pores of the respective specimens.
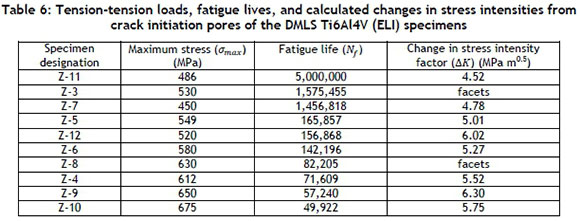
All the fatigue failure cracks in the fractured specimens in this set initiated from surface DMLS process-related pores, except for specimen Z-3 and Z-8, which failed in a faceted crack initiation mode. From Table 6, a similar trend to those of the results shown in Tables 4 and 5 is seen, with an increase in the σmaxleading to an increase in the value of ΔΚ, which in turn decreased the number of load cycles to failure. An increased projected area of the crack initiation pore, from which the value of ΔΚ is calculated, also increased the value of ΔΚ at lower loads, as seen from specimen Z-12. The largest DMLS related identified micro-CT scan pore in specimen Z-11, which was considered to have experienced a run-out, had a calculated value of ΔΚ = 4.52 MPa m0.5. This has been taken here as a value below the threshold change in stress intensity factor.
Figure 4 presents a semi-log curve of the maximum stress against the number of load cycles (S-N) of the Z-build direction HTH DMLS Ti6Al4V (ELI) specimens.
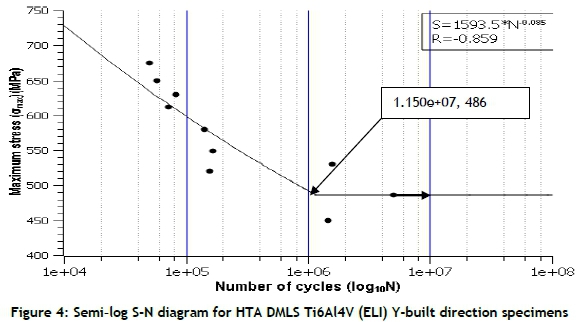
The linear curve fitting for the fractured specimens gives rise to a correlation coefficient (R) of -0.859. The linearised curve intercepts the horizontal curve for the endurance limit at 1,183,000 cycles, forming a knee point. The fatigue endurance limit curve was estimated to be σmax = 486 MPa for the run-out specimen Z-11, indicated by an arrow in Figure 4. This endurance limit is 53 per cent of the average UTS of the Z-built HTA DMLS Ti6Al4V (ELI) specimens presented in Table 3.
3.3 Fractography
3.3.1 Tensile specimen
Figures 5 shows scanning electron microscope (SEM) secondary electron imaging (SEI) fractographs of the fractured HTA DMLS Ti6Al4V (ELI) tensile test specimens Z-2.
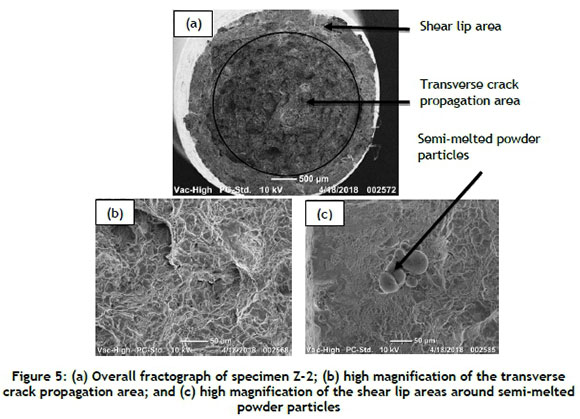
The HTA DMLS Ti6Al4V (ELI) fractured tensile specimens built along the X-, Y-, and Z-directions had the same fracture features. The fractographs from specimen Z-2 in Figure 5 were selected to discuss the fracture modes of the specimens built in the three mutually orthogonal DMLS build directions.
The fracture features indicate ductile fracture modes. This conclusion is drawn from the observed cup-and-cone features with pronounced necking around the fracture zone of the specimens, such as the one shown in Figure 5(a). These are indicative of transverse propagation of cracks in the central flat areas of the fracture surface (circled in Figure 5(a)) and shear propagation of cracks inclined to the longitudinal direction of the specimens in the cup-and-cone lip areas on the periphery of the specimens [17]. On increasing the magnification of the areas of transverse propagation of cracks, the fibrous nature of the fracture surfaces became more pronounced, indicating a ductile fracture at a microscale [16]. A further increase in magnification in these areas of transverse propagation of cracks revealed the presence of dimples, as seen in Figure 5(b) (magnifications from the circled areas in Figure 5(a)). The dimples are characteristic of nucleation and coalescence of voids, which is typical of ductile fracture [18, 19]. Similar dimples are also seen on the shear lip areas, shown in Figure 5(c).
3.3.2 Fatigue specimens
Figure 6 shows SEM SEI fractographs of specimen X-12, which was cycled at a maximum stress of 520 MPa and fractured after 2,580,515 cycles.
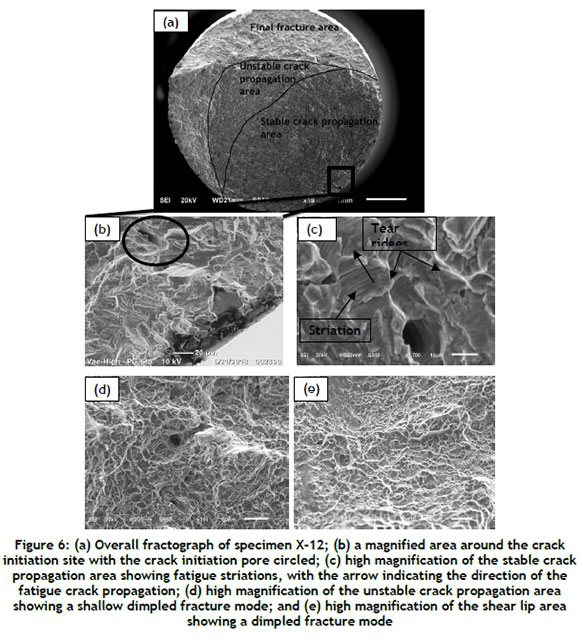
Figure 7 shows the micro-CT scan image on the fracture plane of specimen X-12, with the crack initiation pore indicated by a cross. This crack initiation pore had an area of 0.00433 mm2, resulting in a value of ΔΚ= 4.37 MPa m0.5.
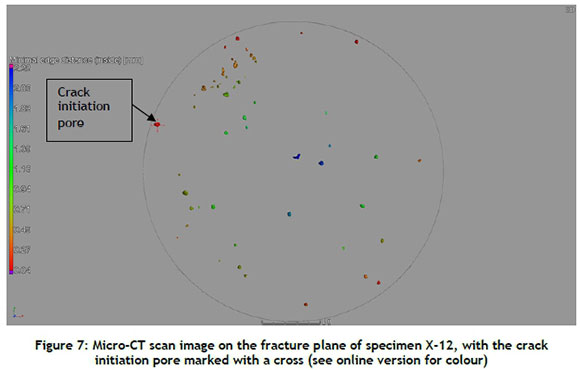
Figure 8 shows SEM SEI fractographs of specimen Y-12, which was cycled at a maximum stress of 520 MPa and fractured after 125,582 cycles.
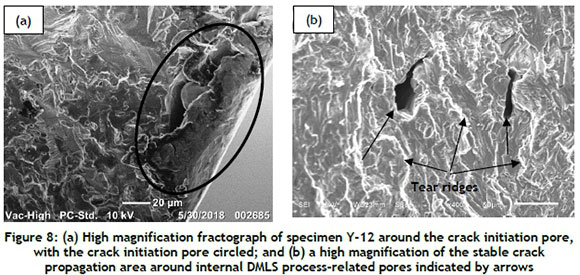
Figure 9 shows the micro-CT scan image on the fracture plane of specimen Y-12, with the crack initiation pore indicated by a cross. This crack initiation pore had an area of 0.00748 mm2, resulting in a value of ΔΚ= 5.01 MPa m0.5.
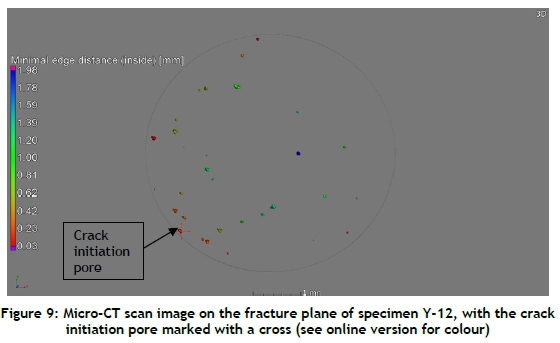
Figure 10 shows SEM SEI fractographs of specimen Z-12, which was cycled at a maximum stress of 520 MPa and fractured after 156,868 cycles.
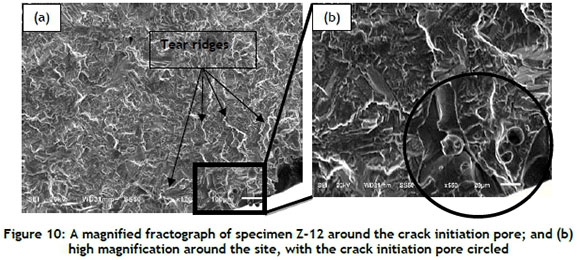
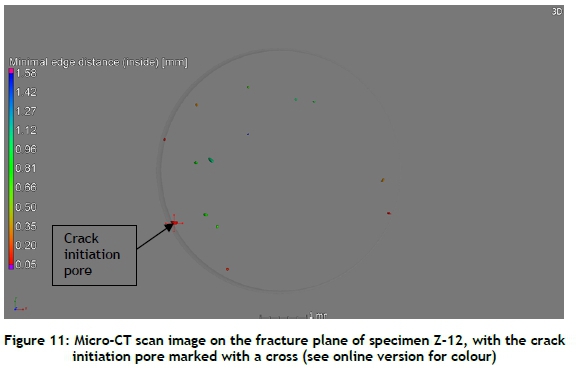
Figure 11 shows the micro-CT scan image on the fracture plane of specimen Z-12, with the crack initiation pore indicated by a cross. This crack initiation pore had an area of 0.01553 mm2, resulting in a value of ΔΚ= 6.02 MPa m0.5.
The fatigue cracks of the fractured HTA DMLS Ti6Al4V (ELI) specimens in this study were seen to have initiated from surface and sub-surface DMLS process-related pores, resulting from the localised lack of complete fusion of the Ti6Al4V (ELI) powder layers. The HTA DMLS Ti6Al4V (ELI) process-related pore crack initiation sites from specimens X-12, Y-12, and Z-12, representing the X-, Y-, and Z-built specimens, are circled in Figures 6(b), 8(a), and 10(b) respectively. These crack initiation pores are also indicated by crosses on the micro-CT scan images in Figures 7, 9, and 11. The micro-CT scan images were taken along the planes of fracture of the respective specimens from which the projected areas of identified pores normal to the loading axes were measured prior to loading, in order to calculate their resultant change of stress intensities. The overall fractographs of these specimens are similar to that of specimen X-12, shown in Figure 6(a). They consist of areas of crack initiation, slow crack propagation, fast crack propagation, and final fracture. The stable crack propagation area consists of tear ridges (bright river-like lines) indicated in Figures 6(c), 8(b), and 10(a). These tear ridges diverged from the crack initiation site, as seen in Figures 6(a) and 10(a). The fatigue striations similar to the ones shown in Figure 6(c) that bow out from the crack initiation pores in a direction indicated by an arrow on the same figure were located at the concave regions between the tear ridges in such areas. The tear ridges died out at the overload zone, an area of unstable crack propagation (fast crack propagation). In this area, crack propagation was consistent with that of monotonic loading, and was characterised by shallow dimples. After the area of unstable crack propagation, the crack reaches an overload area, and thereafter propagates in shear.
The fractographs and the micro-CT scan images for the fracture planes of the specimens X-12, Y-12, and Z-12 are shown in Figures 6, 8, and 10 and Figures 7, 9, and 11 respectively. The ΔK values calculated for the crack initiation pores of these specimens increased in the order of specimens X-12, Y-12, and Z-12, following their projected areas that increased in the same order. Specimen X-12 showed the highest number of load cycles to failure of these specimens because its crack initiated from a pore with the lowest value of AK, which implies that the rate of plastic deformation at its pore tip was the lowest of the three specimens. The value of AK of the crack initiation pore in specimen Z-12 was lower than that of specimen Y-12, but it failed after a higher number of load cycles than specimen Y-12 [11, 12]. The shorter specimen life of specimen Y-12 is attributed to a high distribution of internal pores around the crack initiation pore, as shown in Figure 9, which implies an accelerated local crack propagation through merging of the crack tip with these pores in the early stage of crack propagation.
4 CONCLUSIONS
• The tensile properties of HTA DMLS Ti6Al4V (ELI) specimens showed a level of anisotropy with respect to the three mutually orthogonal DMLS build directions.
• The HCF crack initiation of HTA DMLS Ti6Al4V (ELI) specimens started from surface and subsurface DMLS process-related pores.
• The fatigue life of the HTA DMLS Ti6Al4V (ELI) specimens mainly depended on the area of the process-related crack initiation pores projected on the fracture plane. Pores with large crack initiation areas had lower numbers of cycles to failure than those with small crack initiation areas loaded at the same stress loads.
• Micro-CT scanning of DMLS Ti6Al4V (ELI) parts can be used to predict the life of the parts by identifying the DMLS process-related pore within them, and using LEFM to determine the stress intensity factor of the pores and their deviations from the ΔKth.
ACKNOWLEDGEMENTS
The authors would like to express their gratitude to the following for making this work possible:
• The South African Department of Science and Technology through the Collaborative Programme in Additive Manufacturing, for financial support (Contract No CSIR-NLC-CRPM-15-MOA-CUT-01).
• Stellenbosch University CT scanner facility.
• JB Marks Education Trust Fund, for financial support.
REFERENCES
[1] Bhaskar, D. and Francis, H.F. 2016. Additive manufacturing of titanium alloys: State of the art, challenges, and opportunities. Oxford: Elsevier Inc. [ Links ]
[2] Qian, M., Xu, W., Brandt, M. and Tang, H.P. 2016. Additive manufacturing and postprocessing of Ti6Al4V for superior mechanical properties, MRS Bulletin, DOI: 10.1557. [ Links ]
[3] Moletsane, M.G., Krakhmalev, P., Kazantseva, N.A., du Plessis, A., Yadroitsava, I. and Yadroitsev, I. 2016. Tensile properties and microstructure of direct metal laser sintered Ti6Al4V (ELI) alloy, South African Journal of Industrial Engineering, 27(3) Special Edition, pp. 110-121. [ Links ]
[4] Yadroitsev, I., Krakhmalev, P., Yadroitsava, I. and du Plessis, A. 2017. Qualification of Ti6Al4V ELI alloy produced by laser powder bed fusion for biomedical applications, Journal of the Minerals, Metals and Materials Society, DOI: 10.1007/s11837-017-2655-5. [ Links ]
[5] Dieter, G.E. 2013. Metallurgy and metallurgical engineering series, 3rd edition. New York: McGraw Book Company. [ Links ]
[6] Murakami, Y. 2002. Metal fatigue: Effects of small defects and nonmetallic inclusions. Elsevier Science Ltd. [ Links ]
[7] Williams, S.T., Withers, P.J., Todd, I. and Prangnell, B.P. 2017. The influence of porosity on fatigue crack initiation in additively manufactured titanium components, Scientific Reports, 7:7308, DOI:1038/s41598-017-06504-5. [ Links ]
[8] Gunther, J., Krewerth, D., Lippmann, T., Leuders, T., Weidner, A., Biermann, H. and Niedorf, T. 2017. Fatigue life of additively manufactured Ti6Al4V in the very high cycle fatigue regime, International Journal of Fatigue, 94, pp. 236-245. [ Links ]
[9] Knowles, R.C. 2012. Residual stress measurements and structural integrity evaluation of SLM Ti6Al4V. Dissertation for Master of Science in the Department of Mechanical Engineering, submitted July 2012 at the University of Cape Town. [ Links ]
[10] Sieniawski, J., Ziaja, W., Kubiak, K. and Motyka, M. 2013. Microstructure and mechanical properties of high strength two-phase titanium alloys, INTECH, DOI:105772/56197. [ Links ]
[11] Du Plessis, A., Roux, S.G.L. and Guelpa, A. 2016. The CT scanner facility at Stellenbosch University: An open access X-ray computed tomography laboratory, Nuclear Instruments and Methods in Physics Research B, 384, pp. 42-49. [ Links ]
[12] Du Plessis, A., Broeckhoven, C., Guelpa, A. and le Roux, S.G. 2017. Laboratory x-ray micro-computed tomography: A user guideline for biological samples, GigaScience, 6(6), pp. 1-11. [ Links ]
[13] Boyer, H.E. (ed.). 1986. Atlas of fatigue curves. Russell Township: ASM International. [ Links ]
[14] ASM Handbook. 1996. Fatigue and fracture, Volume 19. Russell Township: ASM International. [ Links ]
[15] Bortplan, C.C., Leonardo, C., Oliveira, T.C.N. and Bolfarini, C. 2016. Fatigue and fracture behavior of Ti6Al4V alloy modified with titanium dioxide nanotubes, Frontiers in Bioengineering and Biotechnology, 4, DOI: 10.3389/conf. 2016.01.02107. [ Links ]
[16] Malefane, L.B., du Preez, W.B. and Maringa, M. 2017. High cycle fatigue properties of as-built Ti6Al4V (ELI) produced by direct meta laser sintering, South African Journal of Industrial Engineering, 28(3) Special Edition, pp. 188-199. [ Links ]
[17] Barsom, J.M. and Rolfe, S.T. 1999. Fracture and fatigue control in structures: Applications of fracture mechanics. Pennsylvania: ASTM International. [ Links ]
[18] Becker, W.T. 2002. Principle of failure analysis: Ductile and brittle. Materials Park: ASM International. [ Links ]
[19] Becker, W.T. 2002. Fracture appearance and mechanism of deformation and fracture. Russell Township: ASM International. [ Links ]
Available online 9 Nov 2018
* Corresponding author lmalefane@cut.ac.za

