


Services on Demand
Article
 English (pdf)
 Article in xml format
 Article references
Indicators

Related links
-
 Cited by Google
 -
 Similars in Google
Share

 Permalink
South African Journal of Industrial Engineering
On-line version ISSN 2224-7890
Print version ISSN 1012-277X
S. Afr. J. Ind. Eng. vol.29 n.3 Pretoria Nov. 2018
http://dx.doi.org/10.7166/29-3-2059
SPECIAL EDITION
The curse of counting and the destiny of data
P.S. Kruger*; V.S.S. Yadavalli
Department of Industrial and Systems Engineering, University of Pretoria, South Africa
ABSTRACT
Writing numbers for counting and record-keeping predates the art of writing by a considerable margin. Never in the history of humankind has the urge to count and to measure everything been so prevalent as today. Numbers were traditionally used to count, measure, and label, but simple numbers have transformed into 'DATA', which has become an important, intrinsic, and all invasive part of life. Furthermore, the transformation from data to useful knowledge (and maybe some wisdom) requires, inter alia, the application of statistical analysis and mathematical modelling.
Two applications illustrating this process will be presented: The possible existence of an association between some human characteristics - for example, neck circumference and general health - will be investigated, and a model based on nonlinear regression presented. A system dynamics model to investigate the dynamic characteristics of a human sub-system will be developed and discussed.
This paper is merely an attempt to investigate the possibility and viability of developing data-dependent models of a medical nature.
OPSOMMING
Die gebruik van getalle met die doelwit om te tel en getalle te stoor is baie ouer as die kuns van lees. Nog nooit in die geskiedenis van die mensdom was die drang om te tel en te meet groter as tans nie. Getalle is tradisioneel gebruik om te tel en te meet maar eenvoudige getalle het verander in 'DATA' wat 'n belangrike en intrinsieke deel geword het van die alledaagse lewe. Die transformasie vanaf data na bruikbare kennis vereis onder andere die gebruik van statistiese analise en wiskundige modellering.
Twee toepassings word gebruik om hierdie proses te illustreer: Die moontlike verwantskap tussen byvoorbeeld nekomtrek en algemene gesondheid sal ondersoek word en n regressiemodel sal ontwikkel en bespreek word. n Sisteemdinamikamodel om die dinamiese eienskappe van n menslike subsisteem te ondersoek sal ontwikkel en bespreek word.
Hierdie artikel is hoofsaaklik bedoel om die moontlike ontwikkeling van data-afhanklike modelle van n mediese aard te ondersoek.
Either write something worth reading or do something worth writing. Benjamin Franklin
1 INTRODUCTION
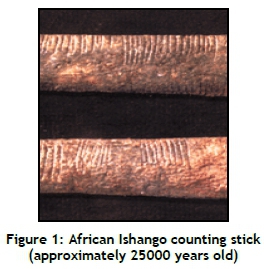
Writing numbers for counting and record-keeping predates the art of writing by a considerable margin, as illustrated in Figures 1 and 2 [1, 2]. However, never in the history of humankind has the 188 urge to count and to measure everything been so prevalent as today. We attempt to count and quantify everything, even that which might not easily be quantifiable and measurable. The dictum is: "If it cannot be measured, it is of no consequence". We are all minions and acolytes of Lord Kelvin (William Thomson), who said: "... when you cannot measure it, when you cannot express it in numbers, your knowledge is of a meagre and unsatisfactory kind". But numbers alone cannot necessarily speak or interpret or inspire or encourage or motivate or show any emotion. However, modern society, science, commerce, and the economy cannot survive without the support and existence of numbers. Numbers were traditionally used to count, measure, and label, but simple numbers have transformed into 'DATA', which has become an important, intrinsic, and all-invasive part of life. Data has acquired some features that are much more than just a large collection of numbers. It certainly might be used for the benefit of humankind, but also might be used to its detriment. In the early days of operations research and computers, Russell Ackoff published a paper entitled "From data to wisdom" [3]. Furthermore, the transformation from data to useful knowledge, and maybe some wisdom, as illustrated in Figure 3, requires, inter alia, the application of statistical analysis and mathematical modelling.


As an introduction, this paper will discuss and, where appropriate, demonstrate some aspects related to numbers and data, such as the history and development of numbers and number systems, the data explosion, and the availability of medical data.
1.1 The curse of counting [4,5]
Those who cannot remember the past are condemned to repeat it. George Santayana
Numbers and number systems are almost as old as human civilisation. However, the first proper number system was developed by the Babylonians some 3000 to 4000 years ago. This system is illustrated in Figure 4, and is noteworthy for several reasons. It used 60 as a base, did not have a symbol for zero, and employed only two distinct symbols (see Figure 5). However, it was probably the first system that might be considered as a positional system that is still in use today. Thus it was possible to display large numbers by writing a number in groups of the power of 60 using a space as a position indicator, very much like the present-day binary system. This is illustrated in Figure 6.


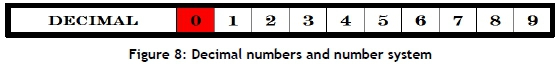
The next major development was the allocation of a symbol for zero or nothingness. This was incorporated into the Hindu-Arabic number system, as shown in Figure 7, which in many ways is the origin of the present decimal system (see Figure 8).

1.2 The destiny of data
Data is like garbage. You'd better know what you are going to do with it before you collect it. Mark Twain
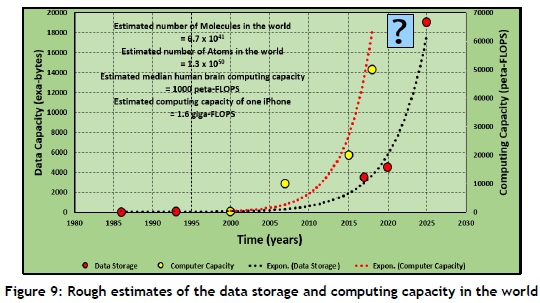
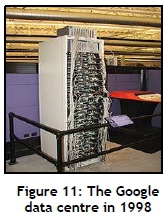
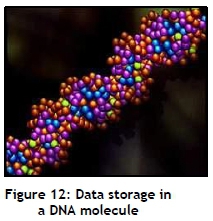
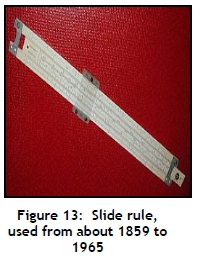
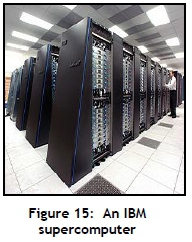
The data explosion and the computer revolution are well-known phenomena. Figure 9 provides a rough estimate of the data and computing capacity in the world, and its expected exponential growth. It seems that the growth in data capacity and the growth in computing capacity is approximately keeping pace with each other. Figures 10, 11, and 12 illustrate the growth in data capacity from a Babylonian clay tablet to the possible storage of data in a DNA molecule. Similarly, Figures 13, 14, and 15 show the development in computer technology from a slide rule to a super computer.


A Pencil is a Crutch, a Calculator is a Wheelchair and a Computer is an Ambulance. Gene Woolsey
1.3 The availability of medical data
Get your data first, then you can manipulate it as you wish. Attributed to Mark Twain
An enormous quantity of medical data is in existence. However, this data is not always easily available or in appropriate format. The quantity of data residing in the files of medical doctors and hospitals is very large, but is dispersed between the facilities, is not easily associated with a specific individual, is seldom accessible, and is usually still in paper format. Similarly, large quantities of data might be available from medical research organisations, but this data tends to be specific to certain kinds of medical conditions - diabetes, for example.
Fortunately, a reasonably large data file, containing individual specific medical and medically associated data, has become available. A small subset of this data file is shown in Table 1.
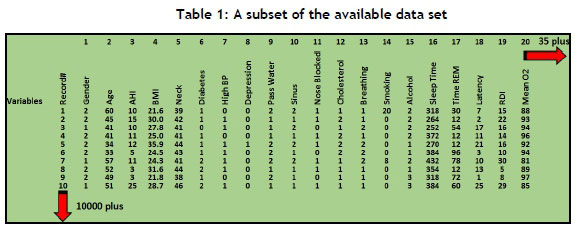
The data in this file, or parts of it, will be used in the rest of the paper.
2 A NECK CIRCUMFERENCE AND HEALTH MODEL
In God we trust. All others must bring data. W. Edwards Deming
The possible existence of an association between an easily measurable physical human characteristic - for example, between neck circumference and various medical conditions - has been known or at least suspected for some time [6]. However, the availability of large quantities of high quality digital medical data has proved to be a problem, and might have hampered statistical research in this respect. This might change significantly, given the increasing availability of powerful digital devices that are capable of measuring and recording, in a reliable fashion, numerous physical characteristics and medical information on a continuous basis. A hypothetical example, based on a real-world situation, of the use of neck circumference as a possible predictor of a physical health index will be presented. The example will be used primarily to illustrate the required and expected processes of data analysis, and the possible development of a preliminary prediction model. The first 10 observations of the data set that will be used for this purpose are shown in Table 2.
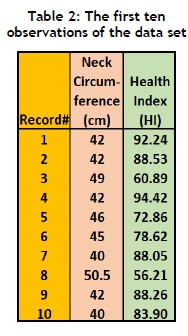
The neck data is a direct extraction from the available data set, as mentioned. The concept of a health index is common; for example, The Blue Cross Blue Shield Association publishes a health index that considers more than 200 health condition categories affecting Americans [7]. The health index data that will be used for the example was constructed from several observations in the available data set.
Table 3 displays typical summary statistics for the data set. The correlation coefficient between neck circumference and the health index is large. However, the correlation coefficient should be interpreted with care. It is only capable of indicating the possible existence of an association, not dependence or cause-and-effect. Furthermore, it is limited to the detection of linear association. The coefficient of variation is large, which might result in difficulties in the recognition and isolation of any existing pattern in the data, and thus might make effective modelling difficult. It was necessary to clean ('wash') the data to remove any obvious errors and outliers.
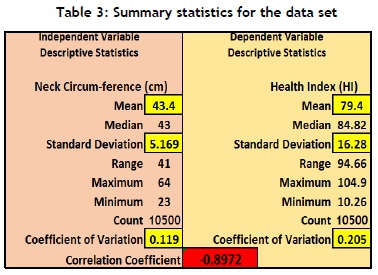
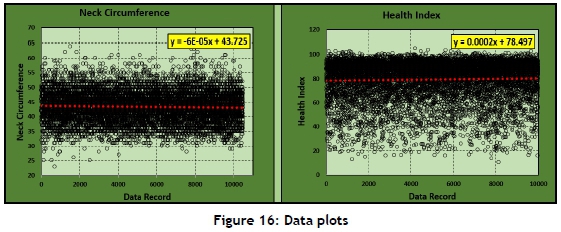
Figure 16 shows graphs of the data. It seems as though several outliers might still be present. The removal or modification of these outliers should be done with great care, since an observation that might look like an outlier, based on statistical principles, might not be an outlier but a valid part of the population. This phenomenon occurs often in medical-related data. Figure 16 indicates that the data is stable both in the mean and the variance.
Data is a precious thing and will last longer than the systems themselves. Tim Berners-Lee
Figure 17 shows a graph of the independent variable (neck circumference) versus the dependent variable (health index); and some association seems to be indicated. The straight line fitted to the data is probably not appropriate, especially at the edges of the range of the data set. The multiple coefficient of determination (R-square) value is high, but should be interpreted with care since it is only an indication of linear goodness-of-fit. The data seem to follow a typical S-curve, and a logistic curve might be appropriate. A simple logistic function, as shown, might be used:
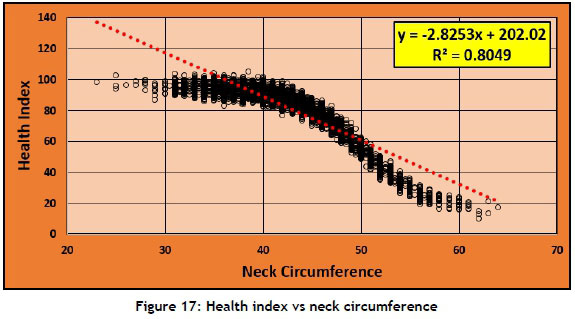
The logistic function: y = a/[1 + e-b(x-x0)]
with:
y: the dependent variable,
x: the independent variable, and
a, b and x0: the function coefficients.
The logistic fit is shown in Figure 18. Since the logistic function is nonlinear, a nonlinear regression approach is required. This was achieved by assuming reasonable starting values for the function coefficients, and calculating the sum-of-squares of the residuals. The sum-of-squares was then used as the objective function, and minimised using a generalised reduced gradient (GRG) algorithm to determine the values of the coefficients that will minimise the sum-of-squares. The resulting values are as follows:

a = 96.4709
b = 0.2496
x0= 12. 8103
This model, possibly enhanced as a multi-variable model, might be useful as a simple screening device at the very first level of health care, or in situations where expert medical advice might not be immediately available.
However, no model is perfect, and this one might be improved in several ways. For example:
The logistic function is only one of a family of sigmoid functions, and fitting another one of these might improve the fit since it might have more coefficients and should be more flexible.
The data might be split in terms of gender and age, and separate models developed for each combination.
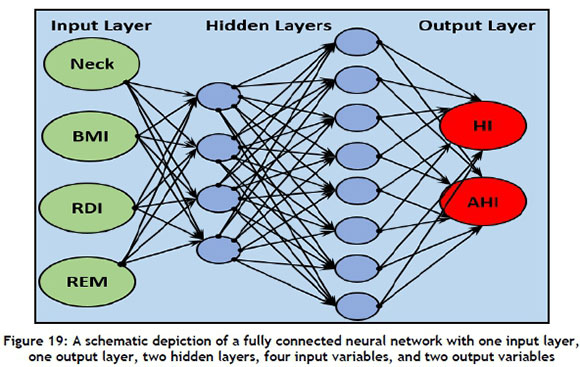
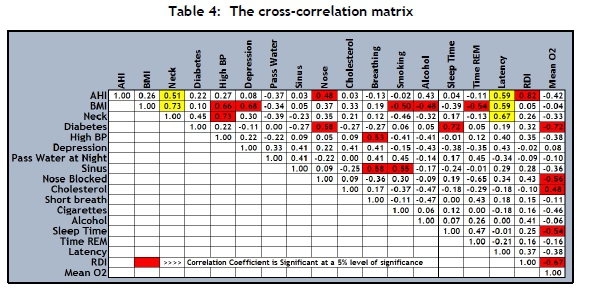
A major problem might exist in this case for the regression approach to modelling. One of the important underlying assumptions of regression is the independence of the independent variables to prevent the existence of multi-collinearity. Table 4 shows the cross-correlation matrix for the data set. Significant large correlation coefficients, and therefore possible dependence, might exist between several variables. This might require the use of, for example, ridge regression. More importantly, it might also indicate the necessity of a different approach to modelling. One possibility might be a modelling approach using neural networks. Such a network is shown schematically in Figure 19.
Statistics are used much like a drunk uses a lamppost: for support, not illumination. Vin Scully
3 A SYSTEM DYNAMICS MODEL OF A SUBSYSTEM OF THE HUMAN BODY
Shallow men believe in luck or in circumstance. Strong men believe in cause and effect. Ralph Waldo Emerson
3.1 Introduction
Consider the following well known definitions.
Definition of a system
A system is a cohesive conglomeration of interrelated and interdependent parts that is either natural or man-made. Every system is delineated by its spatial and temporal boundaries, surrounded and influenced by its environment, described by its structure and purpose or nature and expressed in its functioning. Changing one part of the system usually affects other parts and the whole system, with predictable patterns of behaviour. [8]
Definition of system dynamics
System dynamics is a method to model and investigate the dynamic behaviour of complex systems subject to interventions. It recognizes and models the many circular, interlocking, time-delayed inter-relationships and feedback mechanisms which might exist among the components of a large system. [9, 10]
Examining these two definitions:
Without too much imagination, one might consider the human body as consistent with the definition of a system; it might thus be described as 'a large, complex system, subject to interventions, with many circular, interlocking, time-delayed interrelationships and feedback mechanisms'.
The definition of system dynamics indicates that a modelling approach, based on the concept and principles of system dynamics, might be appropriate.
System dynamics was developed in the early 1960s by J.W. Forrester [9], and was initially intended for the modelling of engineering and management systems. Since then it has been applied to many situations [11, 12]. It has also been used for the modelling of medical systems such as hospitals [13], and even sub-systems of the human body [14].
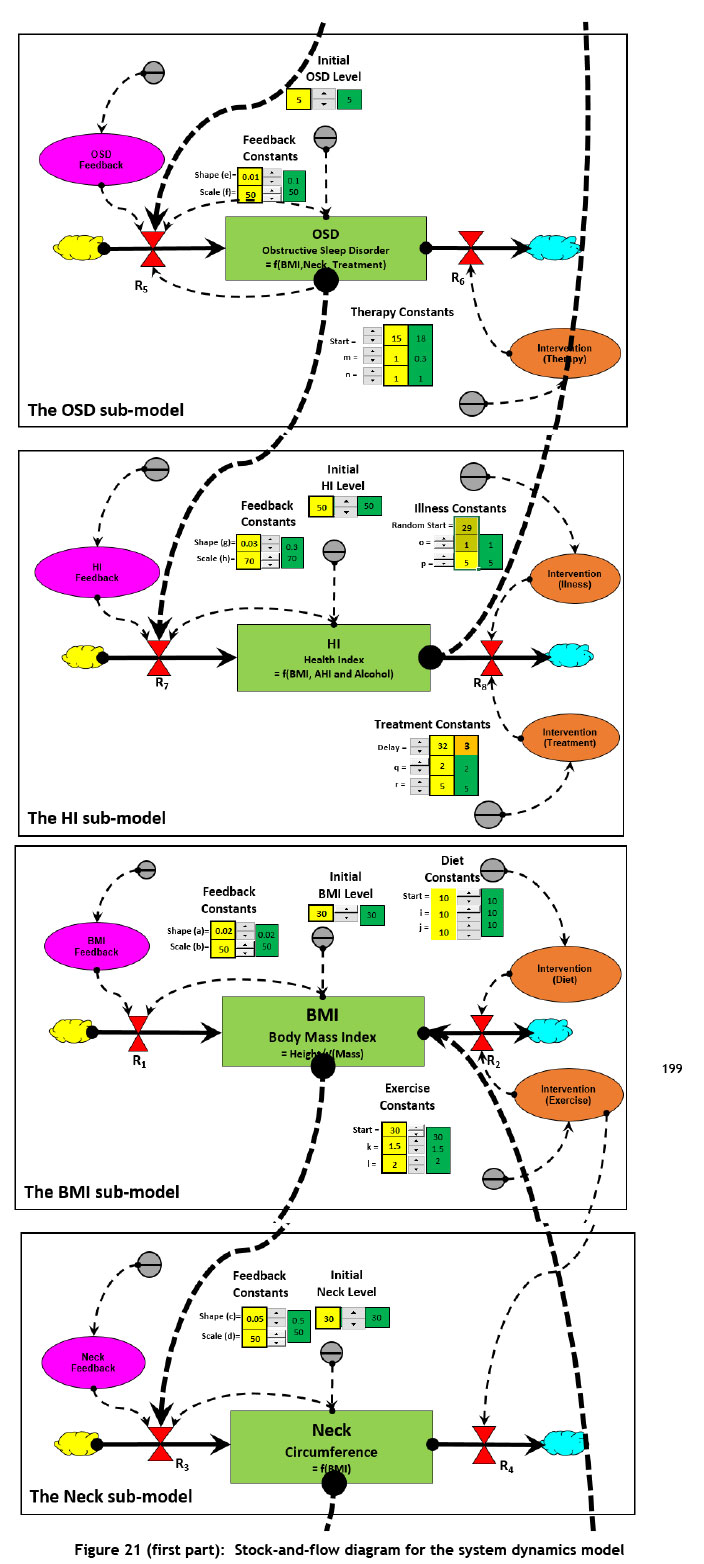
Figure 20 shows a causal loop diagram of a preliminary system of a small part of the human body system. It consists of four main components that will be modelled as levels: body mass index, neck circumference, obstructive sleep disorder, and health index. For every main component, a feedback loop is used to approximate and model the possible influence of factors that are, at present, outside the model boundaries or unknown, but might have an influence on the model. Four interventions are included: diet influencing the body mass index, exercise influencing the body mass index and the neck circumference, therapy influencing the obstructive sleep disorder, and medication and illness influencing the health index. Diet, exercise, and illness originate from outside the model, while therapy and medication are triggered by the levels in the model reaching certain prescribed values. The interaction loop consists of the body mass index influencing the neck circumference, which influences the obstructive sleep disorder, which influences the health index, which influences the body mass index. The dotted lines indicate the flow of information.
I am above the weakness of seeking to establish a sequence of cause and effect, between the disaster and the atrocity. Edgar Allan Poe
3.2 The model
All Models are wrong. Some Models are Useful. W. Edwards Deming
The causal loop diagram shown in Figure 20 might be used to develop the stock-and-flow diagram shown in Figure 21, which is the basis of the system dynamics model.
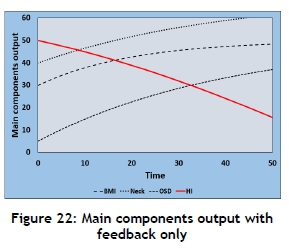
The results shown in Figures 22, 23, and 24 are valid for the specific set of parameter values, which might be changed, as indicated in Figure 21. The functional relationships and related parameter values that were used to model the feedback, interactions, and interventions were a combination of logistic-, power-, Weibull-, and linear-functions - as was deemed practical. The models developed in section 2 might prove useful in determining the characteristics of the appropriate functions to be used.

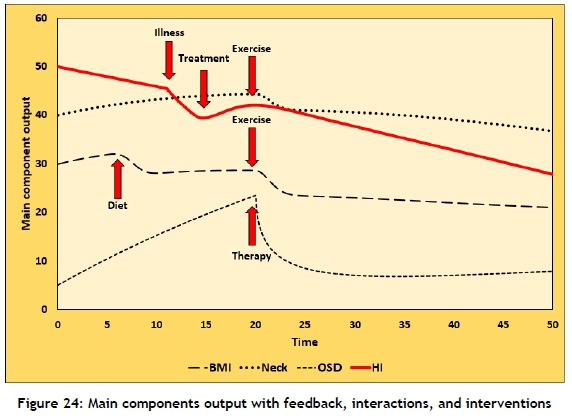
The model might be enhanced by the inclusion of additional main components, interactions, interventions, delays, and control feedback (goal-seeking) characteristics as might be deemed appropriate. This will necessitate the re-evaluation and re-design of the causal loop diagram, using the principles of systems thinking [15].
Figure 24 indicates that in this model, and for the functional relationships and values of the parameters assumed, equilibrium might be reached, and a steady state for the main outputs of the model might be reachable. Just do not get sick or grow old.
4 LAST WORD
I can state flatly that heavier than air flying machines are impossible. Attributed to Lord Kelvin - 1895
It was demonstrated in this paper that it should be possible to develop useful data-dependent models that might be used as diagnostic support tools for medical practitioners, especially at the primary levels of health care. These models might employ regression analysis and systems dynamics, but other modelling tools might be considered. The major stumbling block is the availability of large quantities of appropriate data. This problem might be alleviated in the future through the availability of wearable health sensors.
The construction of a complete, comprehensive, and all-encompassing model of the human body is, in the author's opinion, impossible! However, this author might be proved wrong, in a similar way to which Lord Kelvin was proved wrong by the Wright brothers. It is also impossible to predict the kind of related technological developments and advancements that might be made in the future. It is not clear whether this kind of model should be developed for an individual or "the average man" [16]. This might depend on the kind of data that might become available.
One of the often-quoted reasons that industrial engineers might be valuable to an organisation is the contention that they tend to think in a 'different' way. Therefore, in the author's opinion, industrial engineering might, and should, contribute to the development of the models discussed in this paper.

REFERENCES
The images used in this paper have been obtained from open sources.
[1] Wiseman, R. 2013. The Lebombo bone and Ishango bone: World's oldest math tools. Available from: http://originalpeople.org/ishango-bone-worlds-oldest-math-tool/. Last accessed: July 2018. [ Links ]
[2] Chinasage. 2016. Early Chinese writing - Shang oracle bones. Available from: http://www.chinasage.info/oraclebones.htm. Last accessed: July 2018. [ Links ]
[3] Ackoff, R.L. 1989. From data to wisdom. Journal of Applied Systems Analysis, vol. 16, pp 3-9. [ Links ]
[4] Boyle, D. 2000. The tyranny of numbers: Why counting can't make us happy. Harper Collins Publishers, London. [ Links ]
[5] Dantzig, T. 1930. Number; the Language of Science. The Economic Journal, 40(160), pp. 698-698. [ Links ]
[6] Hu, Y., Chen, J., Yang, L., Chen, P., Li, J., Chen, L., Chen, J., Huang, X., Zhang, Y., Bu, S. and Huang, Q., 2014. The value of neck circumference (NC) as a predictor of non-alcoholic fatty liver disease (NAFLD). Journal of clinical & translational endocrinology, 1(4), pp. 133-139. [ Links ]
[7] Blue Cross Blue Shield. 2018. National health index. Available from: https://www.bcbs.com/the-health-of-america/health-index. Last accessed July 2018. [ Links ]
[8] Wikipedia. Systems theory. Available from: https://en.wikipedia.org/wiki/Systems_theory. Last accessed: July 2018. [ Links ]
[9] Forrester, J.W. 1961. Industrial dynamics. The MIT Press, Cambridge, MI. [ Links ]
[10] Sterman, J. 2000. Business dynamics: Systems thinking and modeling for a complex world. McGraw-Hill, Boston. [ Links ]
[11] System Dynamics Society. 2018. Case repository. Available from: https://www.systemdynamics.org/list-of-all-cases. [ Links ]
[12] Richardson, G.P. 2014. Models that matter: System dynamics applications with impact. Available from: https://www.youtube.com/watch?v=y0okQuwWvG8. Last accessed: July 2018. [ Links ]
[13] Atkinson, J.A., Wells, R., Page, A., Dominello, A., Haines, M. and Wilson, A. 2015. Applications of system dynamics modelling to support health. Public Health Res Pract, Vol. 25. Available from: https://www.ncbi.nlm.nih.gov. Last accessed: July 2018. [ Links ]
[14] Karanfil, O. 2014. Building a system dynamics model of body weight regulation and obesity. System Dynamics Society. Available from: https://www.systemdynamics.org. Last accessed: July 2018. [ Links ]
[15] Meadows, D.H. 2009. Thinking in systems: A primer. Earthscan. Available from: http://wtf.tw/ref/meadows.pdf. [ Links ]
[16] Eknoyan, G. 2007. Adolphe Quetelet (1796-1874) - The average man and indices of obesity. Nephrology dialysis transplantations, vol. 33. Available from: https://doi.org/10.1093/ndt/gfm. Last accessed: july 2018. [ Links ]
Available online 9 Nov 2018
* Corresponding author: paul.kruger12@outlook.com

