Services on Demand
Article
Indicators
Related links
-
 Cited by Google
 -
 Similars in Google
Share
South African Journal of Industrial Engineering
On-line version ISSN 2224-7890
Print version ISSN 1012-277X
S. Afr. J. Ind. Eng. vol.29 n.3 Pretoria Nov. 2018
http://dx.doi.org/10.7166/29-3-2053
SPECIAL EDITION
A conceptual framework to increase competitiveness in a biltong factory
M. Henning; D. Hagedorn-Hansen*; K.H. von Leipzig
Department of Industrial Engineering, Stellenbosch University, South Africa
ABSTRACT
The global annual biltong market value was estimated at roughly R640 million to R1.1 billion in 2003. By 2015, biltong sales were reported to be more than R2.5 billion. To stay competitive as a biltong manufacturing company in an ever-changing landscape, the company's success is determined by efficient operations. To achieve efficient operations, the accurate determination of performance measurements is of utmost importance. In world-class manufacturing facilities, one of the primary features of performance measurement is the measurement of cycle time. Although there is an emphasis, especially in Industry 4.0, on realtime data, the biltong factory where this study was conducted is still very much a manual operation. The focus of this study is, therefore, rather on performance measurements in order to achieve efficient operations and competitiveness. The aim of this study is to present different competitive advantage concepts in order to build a production management model. The biltong factory has not yet established cycle times for their production activities. A production management model has the potential to be used by the factory to manage their production processes more efficiently, and ultimately to increase their competitiveness.
OPSOMMING
Die globale jaarlikse biltong-markwaarde is in 2003 beraam as R640 miljoen tot R1.1 miljard. Dit is gerapporteer dat biltongverkope teen 2015 sal vermeerder tot meer as R2,5 miljard. Om hierdie verkope verder te vermeerder en om mededingendheid te verseker as 'n individuele maatskappy in 'n veranderende besigheids-landskap, word die sukses van die produk bepaal deur doeltreffende bedrywighede. Om doeltreffende bedrywighede te bereik, is die akkurate bepaling van prestasiemetings uiters belangrik. In wêreldklas-vervaardigingsaanlegte, is een van die primêre kenmerke van prestasiemetings die meting van siklustyd. Alhoewel daar klem gelê word op Industrie 4.0 as verwysing en veral op werklike tyd data, gebruik die biltong-fabriek waar hierdie studie uitgevoer is nog steeds mens-gedrewe fasiliteite. Om hierdie rede is die fokus van hierdie studie om (met betrekking tot prestasie-metings) doeltreffende bedrywighede en mededingendheid te behaal en te volhou. Dus, is die doel van hierdie studie om verskillende mededingende voordeel konsepte te ondersoek ten einde 'n produksiebestuursmodel te bou. Die biltong-fabriek het tans nie gevestigde data vir siklustye met betrekking tot hul produksie-aktiwiteite nie. Daarom is 'n vereiste vir hierdie model om die siklusstye vir hul produksie-aktiwiteite te bepaal. Hierdie model kan deur die fabriek gebruik word om hul produksie doeltreffend te bestuur en uiteindelik hul mededingendheid te verbeter.
1 INTRODUCTION
Biltong and droëwors are popular traditional, high-value snacks in Southern Africa. Often comparisons are made with other international dried meat products such as charqui, carne seca, carne do sol (South America), and beef jerky (North America). However, biltong differs in its taste, production process, and end-product characteristics [1]. Biltong is made of meat that is cut into strips, seasoned with spices and vinegar, and then dried with hot air, while droëwors is a hot-air dried sausage [2], [3]. The process of making biltong is standard, and it is manufactured at a variety of levels, from large-scale factories for industry markets to small-scale butcheries, family businesses, or manufacturing at home for smaller markets [1], [4]. Although the manufacturing steps stay the same, the manufacturing processes for large-scale production and small-scale family businesses differ in the type of technology used and the quantity produced, which results in a mixed market of unbranded and branded products [2].
Biltong has become a staple regular part of the South African diet over the years. The annual biltong market value, in 2003, was estimated at roughly R640 million to R1.1 billion [5]. According to Saayman [6], a North-West University study reported biltong sales to be in excess of R2.5 billion in 2015 [6]: sales of beef biltong constituted R2.4 billion, while game biltong constituted R237 million [6]. The price drivers in the biltong industry include the popularity of the meat used, the cost of the animal, and the cost of processing [6]. The biltong market is extremely diverse and competitive, and the company with the best price and quality often prevails as the customer's preferred choice.
To stay competitive in an ever-changing landscape, a company's success is determined by efficient operations. For a company to achieve a competitive position, performance monitoring is essential [7]. Therefore, an essential aspect of effective manufacturing strategies or competitiveness is regularly tracking and monitoring performance [8]. Establishing performance measures enables a company to identify efficient ways to do things and to implement them. Although there is an emphasis, especially with regard to Industry 4.0, on real-time data, the biltong factory where this study was conducted (name not disclosed) is still very much a manual operation with no real-time data. The focus of this study, therefore, is to develop a production management model that uses performance measurement data to determine the scheduling and process routings, and that adapts to the orders received to achieve flexible efficient operations and competitiveness. A production management model has the potential to be used by the factory to manage its production processes more efficiently, bringing down the cost of production and ultimately increasing its competitiveness.
2 METHODOLOGY FRAMEWORK FOR DEVELOPING MODEL
In order to improve the competitiveness of a manufacturing company and to be competitive in the Industry 4.0 environment, companies need to adopt new methods and technologies. However, this is often a costly venture, and it may not result in a significant return on investment (ROI) for the company. A production management model is proposed to assist companies in becoming more competitive without substantial change to their structure and day-to-day business. Figure 1 illustrates the methodology that was followed in order to determine the model function and the area that needed to be focused on in the use case to implement improvement.
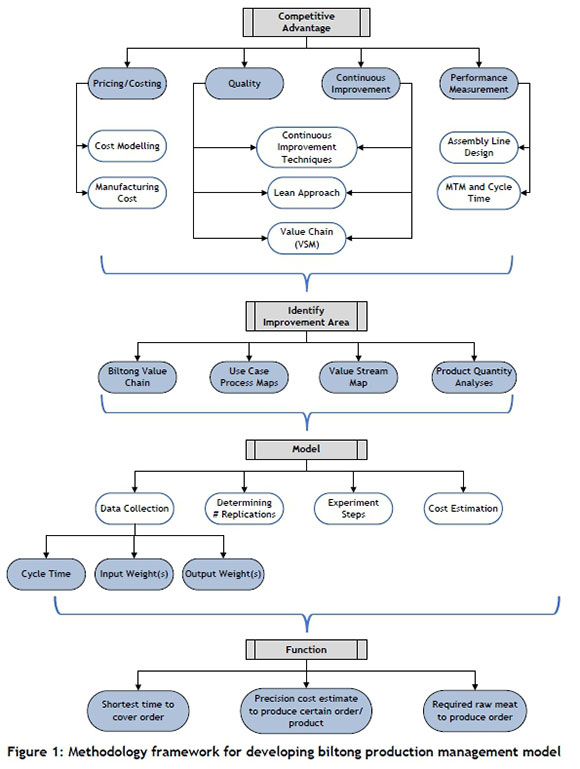
The first step of the methodology framework was to conduct research on competitive advantage concepts and tools. This information was then used to develop the model specifically for the biltong factory, in order to analyse the factory and to determine an area needing improvement. After an area for improvement was established, the data required to develop the production management model was determined. The model function was then established. Each section of the methodology framework will be discussed in greater detail in the sections that follow.
3 COMPETITIVE ADVANTAGE CONCEPTS
The research focused on different competitive advantage concepts. According to Mayer and Nusswald [12], an enterprise's success is measured in terms of three global economic goals: high quality, low lead times, and low costs. These three main goals were the cornerstones for the conducted research; and, based on them, the main focus areas for achieving competitive advantage [13]-[21] were identified as: cost and pricing ([13], [16], [21]), quality ([22], [23]), continuous improvement ([24]-[26]), and performance measurement ([7]-[12], [27]).
The first parameter for competitive advantage, cost and price, was investigated further by conducting a literature study on cost modelling techniques ([19], [22], [27]-[30]) and types of manufacturing costs ([13], [22], [27]-[29], [31]-[33]). For continuous improvement, and the quality cornerstones, different continuous improvement techniques ([26], [34]-[40]) were analysed. It was decided, from all the different continuous improvement techniques studied, that the Lean approach was best suited for this study, and thus further research was conducted on Lean ([16], [36], [41]-[45]). The Lean concepts - cost reduction and flow [45] - also refer to the costing or pricing and the performance measurement cornerstones of competitive advantage. Tools to implement Lean were also considered. These tools included value stream mapping (VSM) ([4], [11], [16], [21], [41]-[42], [44], [46]-[47]) and assembly line design [27]. Under VSM, the food supply chain and biltong value chain ([4], [48]-[49]) were investigated. Aspects of assembly line design, including the importance of performance measurements ([43], [50]-[53]), and more specifically cycle time ([9], [25], [27], [43], [50], [53]-[55]), were also studied.
Some important literature concepts that were used to determine the focus area and function of the production management model are discussed in greater detail in the next sections.
3.1 Value stream mapping
According to Rother and Shook [11], a value stream perspective means taking a 'big-picture' perspective to improve the whole stream. The value stream is described in the literature as the set of actions or activities that bring the product from raw material to finished goods, from order to delivery, or from concept to realisation [44]. The value stream also focuses downstream on creating what the customer views as value. By referring to the specific parts in the firm that adds value to the product [16], a contingent view of the value-adding processes is provided. Therefore, the value stream differs from a supply chain or value chain, which includes the activities of all the companies involved [42].
The biltong value chain was mapped, and the segment where the biltong factory is located was identified first. The factory's process maps were also established in order to get a big-picture perspective; then the VSM of the use case was developed to analyse the company's operations and value structure.
3.2 Quality vs price
According to Buxton et al. [23], in some industries quality or non-price factors can be as important as, or more important than, price. In most markets there are essentially many more dimensions to quality than price on which competitors can differentiate a product and/or service. Thus in some industries it is more likely that the quality factor will be decisive in influencing the customer's choice [23]. The 'wow factor' at the customer level of exchange is to provide a product/service that would not only satisfy customers but "make your customers successful" [16]. This is specifically important in the biltong factory use case, where the customer is often not the consumer of the product, but rather a reseller. To identify an improvement area, the biltong factory's value that it provides to its customers needs to be understood.
3.3 Lean
When implementing Lean, one of the important tenets is the seamless movement through value-creating activities [44]. According to Braglia et al. [41], one of the design questions for a future state map is: What single point within the production chain can be used to schedule production? Product-quantity analysis is one of the methods that can be employed to determine which value stream(s) to target in order to implement improvements. This analysis is done by determining whether some part numbers have high enough volumes to target as the value stream [45].
To determine what processes the model must focus on as the initial target for implementing improvements, the literature on Lean and product-quantity analysis was used. The first step of the improved VSM procedure is to select a product family. This involves identifying the product families in order to select one in which to implement improvements. A product family is defined as a group of products that pass through similar steps in the process and over common equipment in the downstream processes [41].
3.4 Cycle time
One of the cornerstones of effective manufacturing strategies is to track and monitor performance regularly [8]. Cycle time is a primary feature of performance measurement, and can be used as an indicator to measure the efficiency of a production process [11]. This finding is supported by Maskell [10], who states that, for world class manufacturing, a primary feature of performance measurement is the measurement of cycle time [10]. For this reason it was decided to determine the cycle time by measuring the time for each process that forms part of the product families that were previously established. Statistical considerations should also be taken into account when calculating the cycle time.
3.5 Cost modelling/estimation
The cost estimation method used in this study is activity-based costing (ABC) ([13], [22], [27], [31], [32]), as this method assumes that activities drive costs [22]. ABC is the collection of operational performance and financial information that is related to the significant activities of the business [32]. ABC systems focus on the activities as the fundamental cost objects; the costs for each activity are accumulated as a separate cost object, and then this information is applied to products undergoing the different activities [31]. The basic principle of ABC is that units should bear the cost associated with the activity they cause [13].
4 USE CASE ANALYSES
In this section, the biltong factory is analysed in order to identify the improvement area to focus on. Firstly, the biltong value chain is mapped, from primary producers to end customer. Then the factory processes are mapped in order to develop the VSM of the use case.
4.1 Process mapping
To obtain a big-picture perspective of the biltong factory, an understanding of the biltong value chain and production process is essential. The phase in the biltong value chain on which this study focuses is the secondary processors and wholesalers phase, as highlighted in Figure 2.
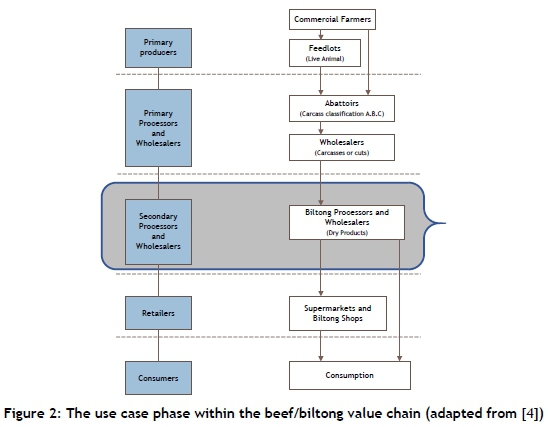
The specific biltong factory used in this study has two separate factories: the 'wet factory' and the 'dry factory'. The different processes in the two factories were analysed first in order to develop a VSM of the biltong factory.
The 'wet factory' processes the cuts of meat before they are dried. The 'dry factory' operates the managing, drying, and packaging processes to prepare the products before sending them to the various customers. Figures 3 and 4 depict the process maps of the wet and dry factories respectively.
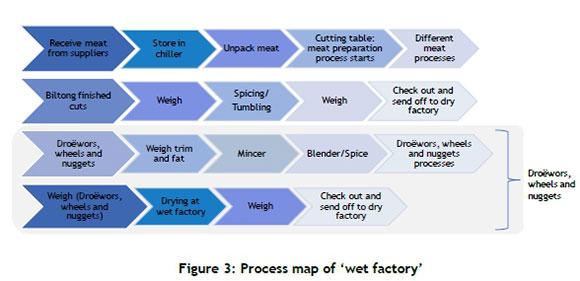
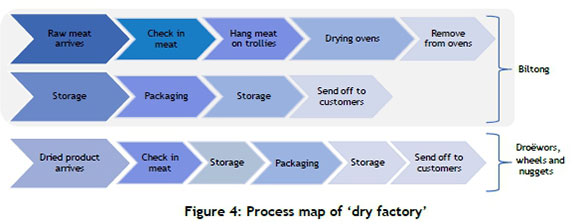
In Figure 3, the meat is received from the primary processors (see Figure 2). These suppliers are also the primary producers of the meat, as they have their own feedlots to ensure consistent quality. The meat cuts are prepared/cleaned at the cutting table before they are moved to the different processes to produce the final products. Two of the outputs at the cutting table are trim and fat, which are used in the products that are made from minced meat. The processing of the biltong varies, depending on the type of product and customer requirements. The droëwors, wheels, and nuggets are dried at the 'wet factory'. The finished products are then sent to the 'dry factory' for packaging and distribution. On the other hand, the spiced wet biltong cuts are sent to the 'dry factory' for drying, packaging, and distribution.
4.2 Value stream map
The VSM was developed, based on the research conducted and on information collected directly from the biltong factory after an indepth analysis of the processes had been completed. The VSM depicted in Figure 5 uses the actual state or current state icons [41] to map the value stream of the whole biltong factory. Thus the VSM includes both the 'wet factory' and 'dry factory' activities.
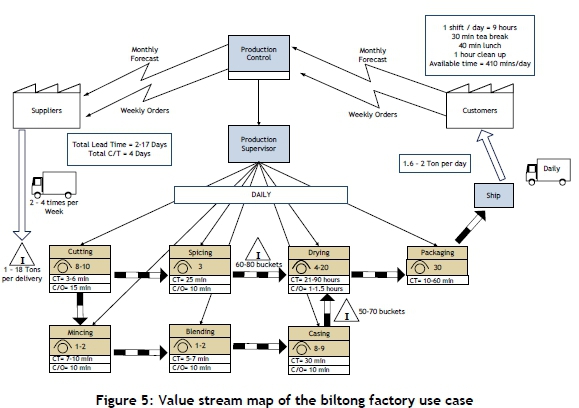
The biltong factory has ±50 different suppliers who supply raw meat cuts, spice, and packaging material to the biltong factory. The suppliers' lead times differ, depending on the product and quantity ordered. The cycle time is based on the process time per bucket - i.e., the time taken to complete ±60 kilograms of meat product. The changeover time for each process includes the time to clean the stations, machines, and/or drying units between different batches of products.
All of the processes shown in Figure 5 add value to the products and, in effect, create value for customers, as they are influenced by the customers' requirements. They can request a certain thickness of product, a certain dryness, a specific spice mix from the biltong factory's recipes, and even specific packaging and labels for their products. This requires the factory setup to be flexible and to allow for mass customisation.
Two value-adding processes that need to be highlighted are drying and cutting. The cutting process is very important in creating value for the company, because, if it is performed with poor precision, the company's profit margin will be reduced. When excess meat is cut off as trim or fat while preparing the biltong products, the factory loses money on the end products, as trim and fat are part of the minced products. Minced products generally have a lower market value than the biltong products, even though both products originate from the same cut of meat.
During the drying process, the meat loses a minimum of 55% of its original weight. The time required to dry the biltong products is dependent on the type of product being dried, the weather conditions, and the customer's requirements. The drying process is carefully monitored, as it has the greatest impact on the company's profit margin. If the products are dried excessively, the end-products weigh less, resulting in less yield of this product to sell to customers. This is especially prevalent when large batches are dried at the same time in the same drying unit.
When the final process, packaging, is complete, the end product is pushed for shipment to the different customers. The biltong factory supplies products to roughly 1000 customers, who vary from small biltong shops to big retail stores; and the lead time for delivery depends on the customer's geographic location.
The total lead time to complete an order from when it is received ranges between 2 and 17 days, as depicted in Figure 5. The lead time of 17 days arises in extreme cases, such as when full customisation is required from a customer, all of the required material is not available to complete an order, and/or the supplier is out of stock.
4.3 Identify improvement area
To identify an improvement area, the value that the biltong factory provides to customers must be clearly understood. A primary factor behind the biltong factory's brand loyalty is the high quality of its products. Hence, in this specific case, the aspect of quality is of greater significance than the aspect of price. The 'wow factor' of value is provided to the biltong resellers by supplying them with superior quality products, as this creates high end-customer satisfaction, which in turn ensures repeat business for the resellers.
Another point to consider in determining a focus area is that the 'wet factory' must produce more than double the weight of the end products being sold. Therefore, to cover the 1.6 to 2 tons of products being shipped per day, as depicted in the VSM, the 'wet factory' must produce between 3.5 and 4.5 tons of wet products per day. Thus there is great pressure on the 'wet factory' to produce enough wet products to satisfy customers' orders. For this reason, it can be stated that the 'dry factory' is dependent on the 'wet factory'.
The single-point process (as described by Braglia et al. [41]) to be used to schedule production and improve the production flow for this use case is the cutting process. This is the starting point for all the various products, as seen in the VSM, with all the other value-added processes following the cutting process. It can therefore be stated that, all the value-added processes are dependent on the cutting process. Based on this reasoning, it was decided to emphasise the cutting process in the 'wet factory' as the main focus area in which to implement initial improvements.
A product-quantity analysis showing the percentage sales volumes of the biltong factory's products over a three-month period is shown in Table 1. It clearly illustrates that the four highlighted products are responsible for almost 80% of sales.
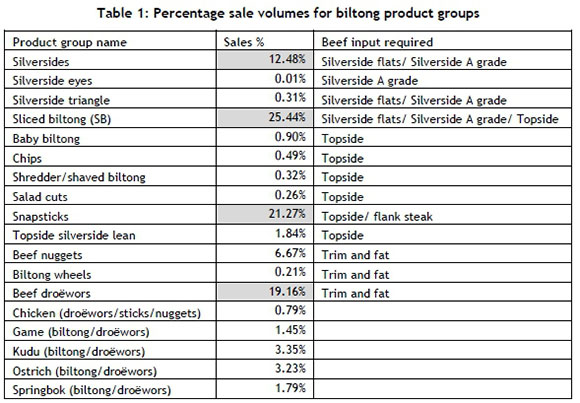
It was observed that the higher-selling products (more than 10%) all require silverside flats, silverside A grade, and topside or flank steak cuts. The beef droëwors consists of trim and fat from these steak cuts as they go through the different cutting processes.
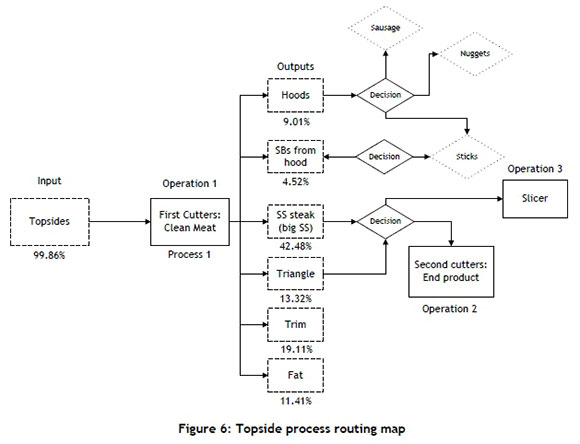
In order to determine whether these input steak cuts are part of a product family, an understanding of the production routes was sought. The production routing maps of the different meat cuts were developed in Microsoft Visio®. Figure 6 illustrates an example of one of the topside process routing maps. A comparison of the process routing maps of all the products clearly showed that the products pass through similar steps and use similar equipment. Therefore, this group of products is classified as the 'product family' to target in order to implement improvement.
5 REQUIRED INFORMATION FOR BILTONG PRODUCTION MANAGEMENT MODEL
The information, experimental steps, and formulas that are required to build a production management model were based on the research conducted and on an understanding of the use case's production. The required information is discussed in the sub-sections below.
5.1 Data collection
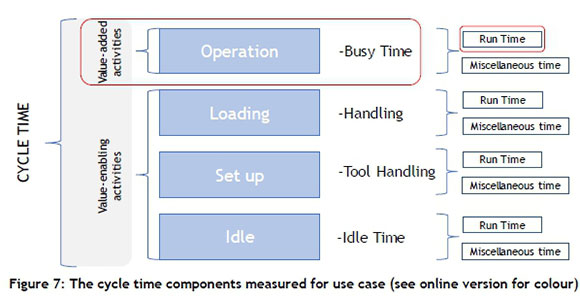
The cycle time was only measured for the operation run time of each value-added activity process, as highlighted in circled red in Error! Reference source not found.
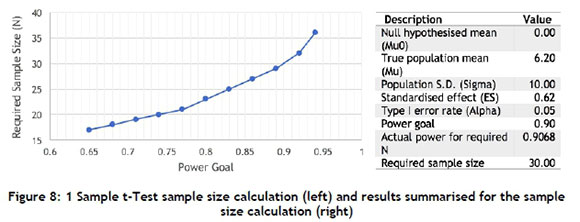
To calculate the required number of time study replications to estimate a single mean, the following calculations were carried out in Statistica. The figure below illustrates the t-Test sample size calculation results.
It can be observed in Figure 8 that, in order to detect a standardised effect of δ = 0.62 with 90% power and a significance level of 5%, a sample size of η = 30 replications of each meat process is required. The effect size of δ = 0.62 is sufficient, as it is within the small (0.25) and medium (0.75) effect size range. Therefore, 30 time studies per process were conducted to determine an average output rate per process with a certain statistical power of 90%.
5.2 Experimental steps
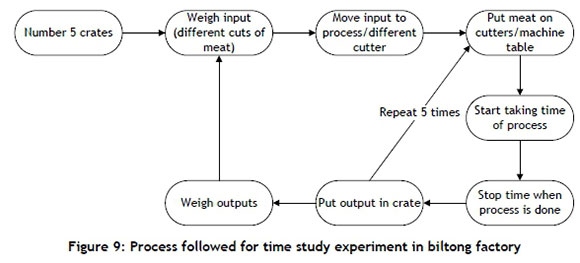
Figure 9 illustrates the experimental steps that were followed when time studies for each process were conducted at the factory. The experiments were done in batches of five and repeated until 30 experiments had been completed.
5.3 Cost estimation
The cost estimation of manufacturing a product can be used by the factory to determine whether the cost unit bears the cost associated with the activity, as the cost to produce a certain raw product is determined. 'Labour cost' was incorporated to estimate the cost per kg to manufacture a certain amount of biltong. Equations 1 to 3 were developed for the use case, based on research on manufacturing cost calculations [27].

6 BILTONG PRODUCTION MANAGEMENT MODEL
The model uses the cycle time of the different processes to improve line flow. With line balancing, the manufacturing time is also improved. The cycle time information can be used to calculate the process times and the number of workers required for specific operations. This information can be used to determine the most efficient sequence of processes to complete an order in the shortest time. By improving the manufacturing time and allowing for a higher production rate, efficiency and cost effectiveness will improve.
The model also determines the actual cost of manufacturing the raw meat product by taking into account the labour cost of the 'wet factory' workers. This is achieved by measuring the input and output weight when conducting the cycle time experiments. With this information, the model also calculates the raw meat input needed to produce a certain order output, as well as the time needed to transform the cut of meat. The labour cost to transform the input to a specific output can be estimated with this information. As a result, the production management model can determine the exact time required, the manufacturing cost, and the input required to complete an order.
As the model uses cycle times to provide and manage the information discussed above, the model contributes the following potential benefits identified by [54]:
• Increased throughput
• Reduced costs
• Streamlined processes
• Schedule integrity
• Improved on-time delivery
• Reduced process variability
• Improved communication
7 CONCLUSION
The production management model that will be developed from this framework will assist management with the biltong factory's production processes and, in effect, strengthen its competitive advantage. This will be achieved in an ever-changing market by manufacturing more efficiently. In order to determine the function of the model and the area of focus to implement improvements, different competitive advantage concepts were used. As stated previously, the factory where this study was conducted is still using manual operations, and has not yet embraced Industry 4.0. This model is thus a stepping stone to revolutionising the biltong factory's operational model, allowing for flexible manufacturing and mass customisation while improving competitive advantage.
A production management model framework that uses performance measurement data to determine the scheduling and process routings, and that adapts to the orders received to achieve flexible, efficient operations and competitiveness was developed. The model will help to determine the shortest manufacturing time to produce a certain order; to estimate the cost to manufacture an order, considering labour costs; to determine the amount of raw meat product required to produce an order. The production management model has the potential to be used by the factory to manage its production processes more efficiently, bringing down the cost of production and ultimately increasing its competitiveness.
REFERENCES
[1] Strydom, P.E. and Zondagh, B. 2014. Biltong: A major South African ethnic meat product. Second ed., vol. 1. London: Academic Press, Elsevier. [ Links ]
[2] D'Amato, M.E., Alechine, E., Cloete, K.W., Davison, S. and Corach, D. 2013. Where is the game? Wild meat products authentication in South Africa: A case study. Investig. Genet., vol. 4, no. 1, p. 6. [ Links ]
[3] Naidoo, K. and Lindsay, D. 2010. Survival of Listeria monocytogenes and enterotoxin-producing Staphylococcus aureus and Staphylococcus pasteuri during two types of biltong-manufacturing processes. Food Control, vol. 21, no. 7, pp. 1042-1050. [ Links ]
[4] Beyers, C. 2017. Exploring food loss and waste along the biltong value chain in the Western Cape, South Africa, Faculty of Agrisciences, Stellenbosch University. [ Links ]
[5] Petit, T., Caro, Y., Petit, A.S., Santchurn, S.J. and Collignan, A. 2014. Physicochemical and microbiological characteristics of biltong, a traditional salted dried meat of South Africa. Meat Sci., vol. 96, no. 3, pp. 1313-1317. [ Links ]
[6] Saayman, M. 2015. Biltong of great value to South African economy. [Online]. Available: http://news.nwu.ac.za/biltong-great-value-south-african-economy. [Accessed: 19-Apr-2017]. [ Links ]
[7] Gibson, P., Greenhalgh, G. and Kerr, R. 1995. Manufacturing management principles and concepts. London: Chapman & Hall. [ Links ]
[8] Hill, T. 2000. Manufacturing strategy text and cases. London: McGraw-Hill Companies. [ Links ]
[9] Thomas, P.R. 1990. Competitiveness through total cycle time: An overview for CEO's. New York: McGraw-Hill Publishing Company. [ Links ]
[10] Maskell, B.H. 1991. Performance measurement for world class manufacturing: A model for American companies. Cambridge, Massachusetts: Productivity Press, Inc. [ Links ]
[11] Rother, M. and Shook, J. 2003. Learning to see: Value stream mapping to add value and eliminate muda, 1.3 ed. United States: Lean Enterprise Institute. [ Links ]
[12] Mayer, M. and Nusswald, M. 2001. Improving manufacturing costs and lead times with quality-oriented operating curves. J. Mater. Process. Technol., vol. 119, no. 1-3, pp. 83-89. [ Links ]
[13] Gowthorpe, C. 2005. Business accounting and finance for non-specialists, 2nd ed. London: Thomson Learning. [ Links ]
[14] Größler, A. and Grübner, A. 2014. An empirical model of relationships between manufacturing capabilities. Int. J. Oper. Prod. Manag. , vol. 26, no. 5, pp. 458-485. [ Links ]
[15] Hill, A. and Hill, T. 2009. Manufacturing operations strategy, third ed. London: Palgrave Macmillan. [ Links ]
[16] Feller, A., Shunk, D. and Callarman, T. 2006. Value chains versus supply chains. BPTrends, vol. March 2006, pp. 1-7. [ Links ]
[17] Lapré, M.A. and Scudder, G.D. 2004. Performance improvement paths in the U.S. airline industry: Linking trade-offs to asset frontiers. Prod. Oper. Manag., vol. 13, no. 2, pp. 123-134. [ Links ]
[18] Sheldon, D., Huang, G. and Perks, K. 1991. Design for cost: Past experience and recent development. J. Eng. Des., vol. 2, no. 2, pp. 127-139. [ Links ]
[19] Shehab, E.M. and Abdalla, H.S. 2001. Manufacturing cost modelling for concurrent product development. Robot. Comput. Integr. Manuf. , vol. 17, no. 4, pp. 341 -353. [ Links ]
[20] Squire, B., Brown, S., Readman, J. and Bessant, J. 2006. The impact of mass customisation on manufacturing trade-offs. Prod. Oper. Manag., vol. 15, no. 1, pp. 10-21. [ Links ]
[21] Porter, M.E. and Millar, V.E. 1985. How information gives you competitive advantage. Harv. Bus. Rev., pp. 149-152. [ Links ]
[22] Steward, R.D., Wyskida, R.M. and Johannes, J. 1995. Cost estimator's reference manual. New York: Wiley and Sons. [ Links ]
[23] Buxton, T., Chapman, P. and Temple, P. 1998. Britain's economic performance, 2nd ed. London and New York: Routledge. [ Links ]
[24] Bessant, J., Caffyn, S., Gilbert, J., Harding, R. and Webb, S. 1994. Rediscovering continuous improvement. Technovation, vol. 14, no. 1, pp. 17-29. [ Links ]
[25] Heizer, J. and Render, B. 2006. Principles of operations management. New Jersey: Pearson Education Incorporated. [ Links ]
[26] Ramadan, M., Al-Maimani, H. and Noche, B. 2017. RFID-enabled smart real-time manufacturing cost tracking system. Int. J. Adv. Manuf. Technol., vol. 89, no. 1-4, pp. 969-985. [ Links ]
[27] Groover, M. 2015. Automation, production systems and computer-integrated manufacturing, 4th ed. New Jersey: Pearson Education Incorporated. [ Links ]
[28] Essmann, E.C. 2012. A cost model for the manufacture of bipolar plates using micro milling.Industrial Engineering, Stellenbosch University. [ Links ]
[29] Curran, R., Raghunathan, S. and Price, M. 2004. Review of aerospace engineering cost modelling: The genetic causal approach. Prog. Aerosp. Sci. 40, pp. 487-534. [ Links ]
[30] Boehm, B.W. 1984. Software engineering economics. IEEE Trans. Softw. Eng., vol. SE-10, no. 1, pp. 4-21. [ Links ]
[31] Chan, Y.-C.L. 1993. Improving hospital cost accounting with activity-based costing. Health Care Manage. Rev., vol. 18, no. 1, pp. 71-77. [ Links ]
[32] Ray, M.R. and Gupta, P.P. 1992. Activity-based costing. Intern. Audit., vol. 49, no. 6, pp. 45-52. [ Links ]
[33] Frederik, J. and Durr, W. 2016. A feasibility study for titanium recycling in South Africa. Industrial Engineering, Stellenbosch University. [ Links ] .
[34] Pretorius, P. 2014. Introducing in-between decision points to TOC's five focusing steps. Int. J. Prod. Res., vol. 52, no. 2. [ Links ]
[35] Ohno, T. 1988. Toyota production system: Beyond large-scale production. Portland Oregon: Productivity Press. [ Links ]
[36] Womack, J.P. and Jones, D.T. 2003. Lean thinking: Banish waste and create wealth in your corporation, 2nd ed. New York: Free Press. [ Links ]
[37] Tapping, T., Luyster, D. and Shuker, T. 2002. Value stream management. Productivity Press: New York. [ Links ]
[38] Total Quality Management. 2018. What is TQM? ASQ, 2018. [Online]. Available: http://asq.org/learn-about-quality/total-quality-management/overview/overview.html. [Accessed: 09-Mar-2018]. [ Links ]
[39] Groenewald, H.J., Kleingeld, M. and Vosloo, J. 2015. A performance-centred maintenance strategy for industrial DSM projects. Ind. Commer. Use Energy, pp. 50-53. [ Links ]
[40] Erickson, T.J. 1992. Beyond TQM: Creating the high performance business. Manage. Rev., vol. 81, no. 7, pp. 58-61. [ Links ]
[41] Braglia, M., Carmignani, G. and Zammori, F. 2011. A new value stream mapping approach for complex production systems. International Journal of Production Research, vol. 44, pp 3929-3952. [ Links ]
[42] Hines, P. and Rich, N. 2005. The seven value stream mapping tools. International Journal of Operations & Production Management, vol. 17, no. 1, pp 46-64. [ Links ]
[43] Monden, Y. 2012. Toyota production system: An integrated approach to just-in-time, 4th ed. Norcross, Georgia: Institude of Industrial Engineers, CRC Press. [ Links ]
[44] McManus, H.L. and Millard, R.L. 2002. Value stream analysis and mapping for product development. Technology, vol. 20, no. 3, pp. 8-13. [ Links ]
[45] Tapping, D., Luyster, T. and Shuker, T. 2002. Value stream management. New York: Productivity Press. [ Links ]
[46] Kaplinsky, R. and Morris, M. 2000. A handbook for value chain research. Brighton, UK:Institute for Development Studies (IDRC), pp 4-7. , no. September. [ Links ]
[47] Rieple, A. and Singh, R. 2010. A value chain analysis of the organic cotton industry: The case of UK retailers and Indian suppliers. Ecol. Econ., vol. 69, no. 11. [ Links ]
[48] Van der Vorst, J., Tromp, S.-O. and van der Zee, D.-J. 2009. Simulation modelling for food supply chain redesign: Integrated decision making on product quality, sustainability and logistics. Int. J. Prod. Res., vol. 47, no. 23, pp. 6611-6631. [ Links ]
[49] Lazzarini, S., Chaddad, F. and Cook, M.L. 2001. Integrating supply chain and network analyses: The study of netchains. J. Chain Netw. Anal., vol. 1, no. 1, pp. 7-22. [ Links ]
[50] Harry, M.J., Mann, P.S., De Hodgins, O.C., Hulbert, R.L. and Lacke, C.J. 2010. Practitioner's guide to statistics and lean six sigma for process improvements. New Jersey: John Wiley & Sons Ltd. [ Links ]
[51] Freivalds, A. and Niebel, B.W. 2014. Niebel's methods, standards, and work design, 13th ed. New York: McGraw-Hill Education. [ Links ]
[52] Karger, D.W. and Bayha, F.H. 1987. Engineered work measurement, 4th ed. New York: Industrial Press. [ Links ]
[53] Kanawaty, G. 2006. Introduction to work study. Johannesburg: Skotaville Publishers. [ Links ]
[54] Nadarajah, S. and Kotz, S. 2008. The cycle time distribution. Int. J. Prod. Res., vol. 46, no. 11, pp. 31333141. [ Links ]
[55] Han, K.H., Lee, G. and Choi, S.H. 2013. Manufacturing cycle time reduction for batch production in a shared worker environment. Int. J. Prod. Res., vol. 51, no. 1. [ Links ]
Available online 9 Nov 2018
* Corresponding author: devonh@sun.ac.za


