


Services on Demand
Article
 English (pdf)
 Article in xml format
 Article references
Indicators

Related links
-
 Cited by Google
 -
 Similars in Google
Share

 Permalink
South African Journal of Industrial Engineering
On-line version ISSN 2224-7890
Print version ISSN 1012-277X
S. Afr. J. Ind. Eng. vol.29 n.3 Pretoria Nov. 2018
http://dx.doi.org/10.7166/29-3-2049
SPECIAL EDITION
Simulating operational improvements on mine compressed air systems#
B.M. Friedenstein; C. Cilliers*, †; J. van Rensburg
North-West University, CRCED-Pretoria, Pretoria, South-Africa
ABSTRACT
Compressed air systems are one of the most significant energy users on mines, with a contribution of about 20 per cent to the total electrical energy consumption on a mine. Research has shown that these compressed air networks are systemically inefficient. Improving the efficiency of these systems would result in a significant reduction in energy costs. A simulation methodology was developed and investigations were conducted into compressed air systems. A compressed air system was subsequently modelled, and a proposed means of improvement was simulated, analysed, and quantified. A South African gold mine was used as a case study. The results showed that, by reducing air usage at refuge bays, an average power reduction of 0.9 megawatts could be achieved. The improvement in efficiency could potentially lead to R6.3 million in annual energy cost savings. The study shows how simulations can help to improve efficiency and profitability in the mining industry.
OPSOMMING
Druklug stelsels is een van die grootse energieverbruikers op myne en beslaan ongeveer 20 per sent van die totale elektriese energie verbruik van 'n myn. Navorsing toon dat hierdie druklug netwerke ondoeltreffend is. 'n Noemenswaardige vermindering in die energiekostes is moontlik deur hierdie stelsels meer doeltreffend te maak. 'n Simulasie metodologie is ontwikkel en ondersoeke is geloods oor druklug stelsels. 'n Druklug stelsel is gemodelleer en 'n voorgestelde metode van verbetering is gesimuleer, geanaliseer en gekwantifiseer. 'n Suid-Afrikaanse goudmyn is gebruik as 'n gevallestudie en die resultate toon dat, deur die lugverbruik by skuilinhamme te verminder, 'n gemiddelde vermindering van 0.9 megawatt moontlik is. Hierdie verbetering kan lei tot 'n jaarlikse besparing van R6.3 miljoen. Die studie wys hoe simulasies kan bydra tot die verbetering van die doeltreffendheid en winsgewendheid van die mynindustrie.
1 INTRODUCTION
1.1 Background
South Africa's mines are some of the deepest in the world. Some mine shafts reach depths greater than 4000 m below the surface [1]. The process of extracting ore at this depth is dependent on a number of essential services: cooling, ventilation, pumping, compressed air, and hoisting.
Primarily due to their reliability, versatility, and ease of use, the South African mining industry has installed extensive compressed air networks. These systems consist of compressors with capacities of up to 15 megawatt (MW) [2]. However, the supply of compressed air is a high-energy, demanding, and costly process [3].
The energy used to generate compressed air amounts to between nine and twenty per cent of the total mining energy consumption [4]. Unfortunately, the compression process is highly inefficient, and it has been estimated that the efficiency of the process of converting electrical energy to power pneumatic drills is as low as four per cent [5].
Sizeable compressed air systems are largely inefficient. Internationally, the expected energy savings potential of large compressed air networks has been proven to be at least 15 per cent [6]. Marais calculates that energy efficiency improvements could lead to energy and cost savings of between 30 and 40 per cent on a general compressed air system [7].
Compressed air distribution networks in the mining industry consist of multiple compressors. Working areas, where the compressed air is needed, are up to eight kilometres away from the source on the surface [2]. Due to their size and complexity, these systems are prone to significant energy losses [2]. Compressed air leakage accounts for as much as 35 per cent of the energy losses of a compressed air network [8]. Other systemic losses include faulty valves, pipe losses, obstructed air compressor intake filters, and inefficient machines.
Leakage and inefficiency detection strategies are not commonly pursued in the South African mining industry [9]. However, many mines do perform leak inspections, either internally or by an external company. During these inspections, an ultrasonic detector is often used to locate the leak. Alternatively, some mines employ the 'walk and listen' method to identify leaks from the audible sound that is produced [9].
The available literature reports that energy-saving interventions on compressed air systems have been implemented through one, or a combination, of the following strategies [10]:
• Reducing leaks
• Reducing demand
• Reducing unauthorised air usage
• Increasing supply efficiency
• Optimising supply
Once an energy-saving measure has been identified, it is necessary to estimate the potential costs and benefits of the intervention. The estimations are typically performed using first-principle calculations, simplified mathematical models, and practical tests where possible. However, new tools have enabled the quick and accurate development of a compressed air model. Through simulations, accurate estimates can be obtained quickly, with no risk, and at comparatively low resource requirements.
1.2 Simulations
Continual improvements in computing hardware have led to major advancements in software technology. Consequently, computational simulation has become an increasingly valuable tool to be used in many industries [11]. The advantages of using simulations in industries are numerous - mostly, the ability to test new policies, operating procedures, and methods without disrupting the actual system is what makes simulations attractive [12].
Simulations are used to test and identify energy and operational improvement modifications in mining compressed air systems. However, in the past, the development of complex models for mining systems was not feasible, as simulation software was too cumbersome for use for large compressed air systems, and often required unattainable data inputs [7].
Before new software tools allowed for the development of detailed mining compressed air simulation models, simplified compressed air models to estimate and quantify the performance of potential energy interventions were created [7]. Calculation methodologies were developed to quickly estimate the expected energy-saving impact on the system. The approach, however useful, did not take the complexity of compressed air systems into account.
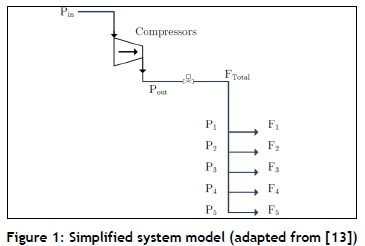
Kriel used simulation to estimate the performance of energy projects on mine compressed air systems [13]. The KYPipe GAS software tool was used to develop simulation models for these systems. Kriel simplified the air networks for the simulations to a single compressor that represents the supply processes, and an outlet flow to each underground level in the network. The model is shown in Figure 1.
The simulation was performed to quantify the savings from underground network interventions that had been designed to reduce flow to the network. The estimated savings from the simulations varied between 10 and 25 per cent, compared with the actual performance of the interventions. The simplified air network model can thus not be used accurately to estimate the energy-savings potential of more complex scenarios.
Planned manual measurements, estimations, and new software technologies can be used to develop more detailed compressed air models [14]. Using a structured procedure may allow for the development of more detailed and accurate mine compressed air simulations. With new tools available to develop detailed simulation models, the energy and operational efficiency of mining compressed air systems can be improved. Thus a need exists for an integrated compressed air simulation approach to identify energy and operational improvement strategies for mines.
2 DEVELOPMENT OF SIMULATION METHODOLOGY
2.1 Introduction
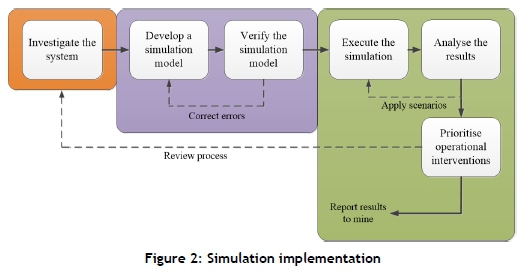
Implementation of a simulation model is divided into three steps, as shown in the flow diagram in Figure 2. Firstly, the specific air network is investigated. Secondly, the data acquired from the system survey is used to develop and verify a simulation model. In the final step, scenarios are tested, and the results are quantified and prioritised. After the process has been reviewed, a simulation report is produced. For this paper, the Process Toolbox (PTB) simulation software was used. All simulation components and parameters are thus unique to this software.
2.2 Investigate system
2.2.1 Acquire da ta
The first step in investigating the system is to understand what will be required to model the system and to acquire the necessary data to do this. For this survey, access will be needed to resources such as data storage systems and instrumentation. Communication with relevant personnel on site will also be vital.
Comprehensive and up-to-date process layouts that illustrate a compressed air network's unique set-up, scale, and the location of instrumentation will be needed. More detailed layouts can also provide per-level air consumption breakdowns of the network, refuge bays areas, mining cross-sections, and identified inefficiencies. The layouts are vital to understand the system process and to identify what data parameters will be required for the simulation model.
A baseline period that best represents the typical operation of the mine must be selected. The length of the baseline period is selected, based on the scenarios that are to be tested. A 24-hour period of normal operation for a compressed air system will be sufficient to calibrate a simulated system. A longer period may be needed to verify the model.
2.2.2 Investigate operation schedules
A critical aspect of developing an accurate model of a mining compressed air system is to take note of the operational philosophy of the mine. The schedule for operations such as drilling, blasting, or cleaning will have an impact on compressed air requirements at different times of the day. By using the operational schedule, simulation scenarios can be optimised for the different air requirements throughout the day.
2.2.3 Verify da ta accuracy
Data will typically be sourced from on-site historian servers. To ensure an accurate representation of actual system operations, it is important that data of high accuracy and quality is used [16]. The factors that influence a dataset's quality, accuracy, and integrity must be inspected, and can be summarised as follows:
• Conversion of measurement value [17]
• Storage and collection of the system [18], [19]
• Traceability of measurement sources [19]
• Measurement equipment accuracy and malfunctions [16]
• Data abnormalities [16]
2.2.4 Resolve missing da ta
Data that is required to develop the simulation model, such as flows and pressures, may not be actively logged by mine systems. It is often necessary to investigate alternative sources and methods to obtain the data. For example, for process elements where instrumentation is absent, estimations can be made based on assumptions about instrumentation on the network, or based on spot inspections.
Air network specifications such as piping sizes, technical layouts, and major leak locations are often outdated or not recorded. Critical data should be obtained through audits and inspections of the system. If a manual inspection is not possible, estimations should be made from the available data.
2.3 Develop and verify model
2.3.1 Process boundaries and parameters
The simulation boundaries will determine the level of detail and accuracy achieved when modelling a system. For a simple compressed air model, the boundaries can be set around the compressor house. This model would then include only the compressor components and inlet and outlet air flows. Alternatively, a more complex model can be developed by choosing boundaries to include more aspects of the process, such as specific flow demands by end users. The process boundaries should be selected based on the available input data, the accuracy targets, and the available time and resources.
Period and data step sizes of the simulation are also important. The period or duration of the simulation should be determined to ensure that the effects of a scenario are fully tested. Previous studies commonly simulated a 'typical' 24-hour period of operation. Mine operations usually follow a predictable trend over a normal working day. Therefore the 24-hour simulation period will be sufficient. The simulation step size indicates the data resolution. For this paper, the smallest available step size was selected to ensure that the simulated results would achieve the desired precision.
Compressed air processes, such as the opening and closing of valves or stopping and starting of compressors, may occur within minutes or seconds. Therefore higher step sizes (30+ minutes) may delay process changes. This delay makes replication of the system control more difficult, and reduces simulation accuracy.
2.3.2 Component modelling
Compressors
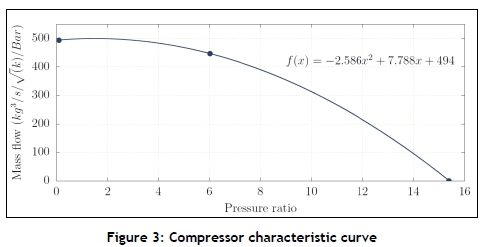
For most scenarios, the dynamic compressor model in PTB is best suited. The dynamic compressor is modelled by fitting a quadratic curve through three points of operation to obtain an equation for corrected mass flow as a function of the pressure ratio. This characteristic curve of a compressor (shown in Figure 3) can be accurately estimated, even when only one data point is available, by making approximations for the zero flow and pressure points on the curve.
Once the flow characteristics of the compressors are set, the efficiency and polytropic coefficient parameters are calibrated so that the output power and air temperature match the actual or estimated outputs of the compressor.
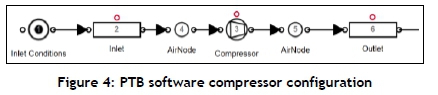
Once the models have been accurately calibrated, the compressor component integrates into the air network in the arrangement shown in the PTB software screenshot in Figure 4. The compressor is connected to the inlet air source via an inlet pipe and air node, and to the rest of the network via an air node and outlet pipe. The additional pipe components allow the inlet and outlet conditions to be monitored and controlled in the simulation.
Air pipes
Pressure losses occur over compressed air networks due to friction within the pipe. These losses should be accounted for in the simulation for large piping networks. A pipe model is used to account for these losses, which are defined by the Darcy-Weisbach equation:
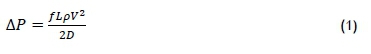
where:
ΔP = Pressure difference (kPa)
f = Friction coefficient
L = Pipe length (m)
D = Pipe diameter (m)
ñ = Air density (kg/m3)
V = Average velocity (m/s)
Air flow demands
Flow demand represents any air volume leaving the network. Volume leaving the network includes any air-consuming equipment on mines, such as drills and loaders, and losses from air leaks and open pipes. The air flow is dependent on pressure and the specific resistance to flow of the outlet. The resistance of the flow demand can be obtained using the inlet pressure, outlet pressure, and flow.
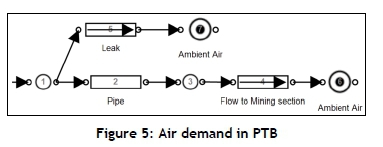
If the flow is not known, a reasonably accurate estimation can be made by calculating the expected flow from the size of the outlet. However, this estimation will affect the accuracy. The air demand may vary throughout the day. For example, a mining section may use more machines during certain periods of the day. A schedule and flow profile is used to replicate this in the simulation. Figure 5 shows how a calibrated air demand or leak is integrated into the simulation model on PTB.
Controllers
Simulation components require dynamic control to replicate the operation of the actual air network. Control is typically implemented on compressors and valves throughout the network to follow setpoints and schedules. It is important not only to include the controllers in the simulation, but also to replicate any nonlinearities, limitations, and response delays related to specific types of control. Implementing these control factors will ensure that the model reacts in the same way as the actual network would, thus improving accuracy.
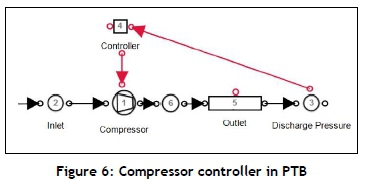
On a typical mine, a compressor's power output is controlled to ensure that the discharge pressure matches a specified set-point. This control is achieved through either variable speed drives (VSDs) or guide vane control. On PTB, valve or compressor control can be replicated using a proportionalintegral (PI) controller, as shown in Figure 6. For the control system models in Figure 6, the outlet pressure is used as feedback to the compressor.
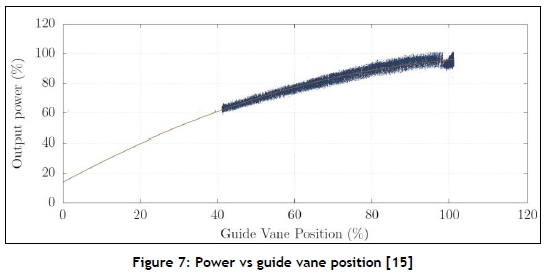
Guide vanes are most commonly used to control compressors in mining compressed air systems. The guide vane is opened or closed to control the compressor's discharge pressure. Manipulating the guide vane position will affect the electrical power that the compressor motor requires.
Figure 7 shows the relationship between power and guide vane position. A linear relationship between guide vane position and compressor output can be used to estimate the effect of guide 74 vane control. The model should consider the minimum guide vane position limit, which is typically set at around 40 per cent open. Figure 7 shows that a guide vane at 40 per cent maps the compressor power to about 60 per cent. When a 100 per cent guide vane position does not satisfy the system pressure demand, another compressor will be started.
In PTB, the guide vane controller is modelled using a PI controller. The non-linear limitations of guide vane control must be implemented in the controller. The control limitation is applied in the model by using a minimum control output limit that matches the minimum power.
Mines make use of control valves at underground sections to adjust the pressure at individual mining stations independently [20]. The control of valve components in PTB is performed in a similar manner to the control of the compressor components.
Compressor after-cooling
The air compression process generates significant heat. Compressed air at high temperatures contains a significant amount of water vapour. After-coolers are installed on compressed air systems to prevent condensation in the air network, to improve the system capacity, and to protect equipment from excessive heat [21].
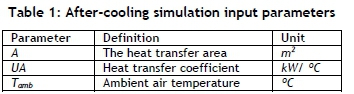
After-cooling reduces the output air temperature of the compressors. This cooling can affect the operation of the network. Including after-cooling in the simulation model will thus improve accuracy. Modelling after-cooling is achieved in PTB using a heat transfer node at the outlet of the compressor component model. The heat transfer parameters shown in Table 1 should be calibrated so that the air temperature matches the after-cooled air temperature. An assumption of 40° Celsius can be used if no measurements are available.
2.3.3 Verify model
It was found that mean absolute error (MAE) and the coefficient of determination are the most effective methods for measuring model accuracy. These measures are obtained by comparing the major simulation outputs (total system power, flow, and pressure) with actual data from the system. R-squared and MAE metrics are calculated, and the selected verification constraints were defined as r2 > 0.9 and Err% < 5%.
If these limits are met for the power, flow, and pressure of the system, the model is considered accurate. As an extra measure, the relative error of the output for the minor model components should be > 85 per cent of the actual data. To obtain the true error of the model, instrumentation measurement error should be combined with the calculated simulation error.
Furthermore, periodically repeated simulations could be used to verify simulations more definitively. To perform the repeated simulation verification, the input variables should be updated for each new period. The output values of the simulation should then be compared with the actual measurements. For each simulation, the verification constraints must be met.
2.3.4 Select inputs
The inputs of a simulation are any parameters that do not remain static or follow the same profile in the day-to-day operation of the system. Examples of such parameters in a compressed air simulation are the following:
• Surface ambient conditions
• Machine operation schedules
• Air demands
• Operational changes
Changing the simulation baseline period for a calibrated simulation should require only the updating of input parameters.
2.3.5 Periodic simulation
Periodic simulation refers to the repetition of simulations over subsequent periods to determine the sequential accuracy of the model. Sequential accuracy is important to verify that the model is valid in general, and not just for a single period. This simulation will also indicate where operational changes have occurred, as the simulation accuracy will be reduced.
The following procedure, illustrated in Figure 8, is followed to implement periodic simulation:
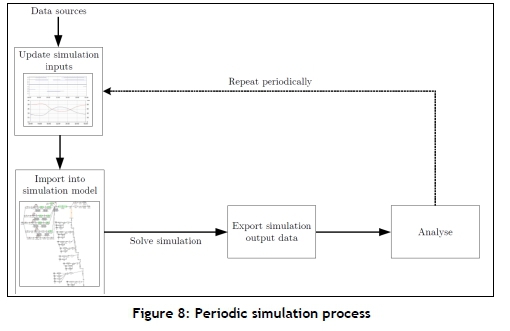
• Collect simulation input data periodically for each simulation interval
• Import input data into the model
• Execute simulation
• Export the output values
• Compare output data with the system's actual operation and identify discrepancies
• Trigger the process periodically
2.4 Implement simulation
2.4.1 Execute scenarios
At this point, the simulation model has been verified using historical data. The verified output data series is now used as a baseline on which interventions can be quantified. The simulation inputs of the model have now been adjusted to create the desired scenario. For example, to create a scenario where a specific compressor is shut down over a period, the input schedule of the compressor is adjusted in the simulation model.
2.4.2 Quantify benefit
With the data for each of the simulated scenarios exported, the improvement relative to the baseline must be quantified. This comparison is achieved by analysing the differences between the baseline and the optimised data series. For power data, the expected annual energy cost saving can be calculated using the average weekday energy saving and the tariff structure provided by the utility company.
Estimating the cost benefit of improvements in pressure delivery is harder to quantify. Instead, the average pressure benefit for a period should be provided in kPa - for example, 'The simulation indicated an x MW reduction with an additional pressure improvement of y kPa during the drilling shift'. This is an important parameter, especially for mines, as the drilling shift pressure directly influences the pneumatic drilling efficiency.
2.4.3 Report
Once the benefits for each simulated scenario have been calculated and quantified, the interventions should be prioritised according to the greatest benefit to the mine. The implementation costs and pay-back periods of the interventions can also be considered in this process. The results and recommendations should be submitted to the responsible mine personnel in the form of a report. At this point, the process of implementation becomes the mine's responsibility.
3 CASE STUDY
3.1 System
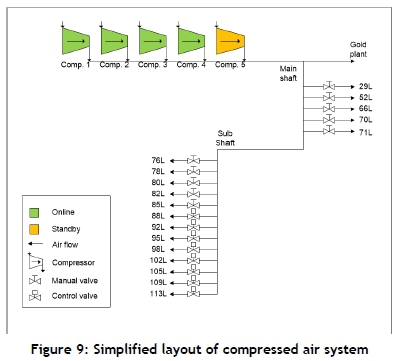
A large South African gold mine was selected as the case study. The mine uses five compressors to supply compressed air to various surface and underground operations. An investigation was carried out to gather the data and information required to build a simulation model of the network, and to identify potential cost-saving simulation scenarios. A basic air distribution layout was developed for the system.
Data related to the mine scheduling and to the critical limits and set-points of the compressed air system was obtained from various mine personnel. A general understanding of the operation was thus obtained. Critical data parameters such as power, pressures, and flows of the system were gathered from the supervisory control and data acquisition (SCADA) systems and other data measurement sources. This information was used to develop and calibrate the simulation model.
Strategic investigations were performed on significant mining levels to map and measure the locations and air usage for the cross-sections, refuge bays, leaks, and other compressed air consumers. The information gathered from the system investigations was subsequently used to develop and calibrate a simulation model. A simplified layout of the compressed air system is shown in Figure 9.
3.2 Development of model
Based on the investigation, a compressed air network was modelled in PTB. The methodology described in Section 2 was used for this process. The following assumptions were made to simplify the model development:
• After-cooling reduced compressed air temperature from 100° Celsius to 40° Celsius
• Typical underground air conditions existed
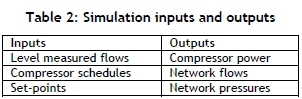
The boundaries of the baseline simulation were selected, based on the available data for the system. For maximum accuracy, the simulation step size was set to two minutes to match the resolution that was available from the data source. The model components were calibrated so that the simulated outputs matched data from the real system. The model data inputs and outputs are shown in Table 2.
3.3 Model verification
The verification methodology was used to verify the simulation model by comparing the simulation outputs with actual measured values. Since a compressor's outlet pressure often does not match the set-point on mines, the measured outlet pressure was used as a set-point for the compressors to verify the power and flow outputs. The set-point ensured that the pressure in the network was identical to that of the actual system.
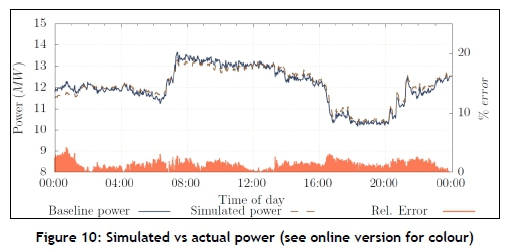
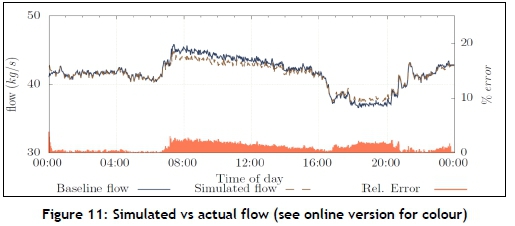
With the simulated network pressure almost identical to the actual, the power and air-flow outputs were compared with the outputs from the physical system. Figure 9 and Figure 10 show the comparison of the total power and flow of the system with the physically measured values for that same period. The relative error of these process parameters, compared with the real network, was 1.02 and 1.36 per cent respectively. This simulation error was within the acceptable error limits.
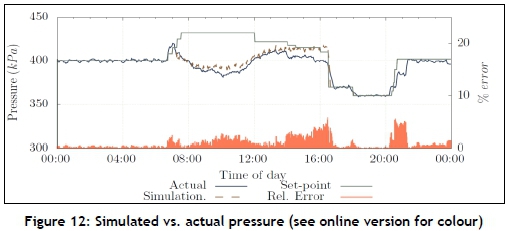
Once the power and flow parameters were verified to be within an acceptable error limit, the actual pressure set-point profile was imported to the compressor controllers. The simulated outlet pressure was compared with the actual measured pressure and set-point. This comparison is shown in Figure 12. The error of the compressor outlet pressure was acceptable at 0.98 per cent. The measured flows for all subcomponents were independently verified to ensure system accuracy.
3.4 Scenario
Refuge bays are chambers in which a positive pressure is maintained to provide a safe environment for miners during noxious gas leaks [1]. From an underground investigation, it was found that refuge bay leaks were a significant air user at the case study mine. A test on a single mining level was performed to measure the potential flow reduction by reducing refuge bay leaks. The test showed that the reduction of refuge bay leaks by closing the valves would lead to an average air reduction of 0.05 kg/s per refuge bay at normal operational pressures. This measurement was conservative, as it was not possible to close all the refuge bays on the level for the test.
Due to the size of the mine, extending the test to include the rest of the mining sections was not practical. Thus the benefits of an intervention on the entire mine could not be determined by practical tests. By using simulation, a typical operation could be accurately compared with the intervention scenario to quantify the potential financial and operational benefits throughout a given period.
The simulation model boundaries were updated to include refuge bay leaks on each level. For each refuge chamber, an air leak was added to the model by using 'per level layouts' that indicated the locations of refuge bays. These leaks were modelled as flow demands, using the data from the initial refuge bay tests. The overall mass flow of the system was maintained to ensure model accuracy.
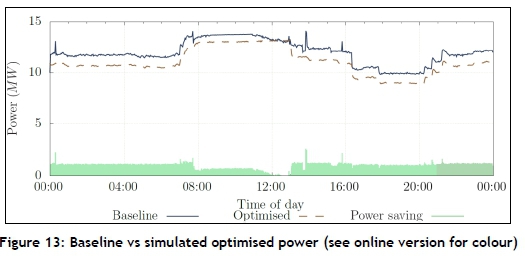
The optimised scenario was modelled by reducing the refuge bay flow components to 0 kg/s. The simulation was performed, and the output data was compared with the baseline. Figure 12 shows the baseline power compared with the power of the optimised scenario. The comparison revealed a potential 0.9 MW improvement in overall demand, or an energy efficiency of 22 MWh. The optimised scenario would lead to a potential R6.3 million/annum in energy cost savings for the mine.
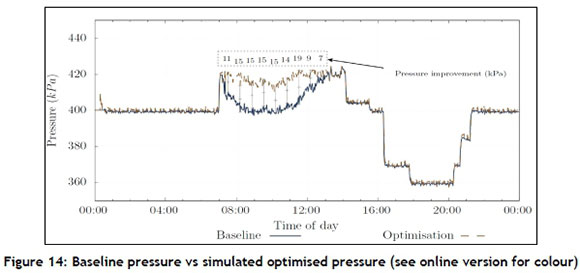
An additional pressure benefit was identified during the drilling shift, as shown in Figure 13. The reduced flow leads to an average pressure increase of 15 kPa during the drilling period, which could lead to a general improvement in drilling efficiency. This can also result in an increase in production. Such improvement may well have a greater benefit to the mine than the intended energy cost savings, but that quantification is problematic. All the findings were written-up in a report and provided to the mine for further decision-making.
4 CONCLUSION
A methodology was developed for compressed air simulation. This was done through the findings in the compressed air system and simulation literature. The method describes the simulation procedure in three steps: investigate the system; develop a simulation model; and execute the simulation scenarios.
The methodology was implemented on the compressed air system of a case study mine. A full system investigation was conducted for the study. A simulation model was developed and verified using measurement data. A scenario in which the flow to refuge bays was regulated was simulated. The results showed a potential energy saving of 22MWh, which would result in an annual energy cost saving of R6.3 million. A further pressure improvement of 15 kPa during the drilling time was identified.
This paper showed that an integrated compressed air simulation approach can be used to identify energy and operational improvement strategies for mines. This will greatly reduce investigation times, and will result in an overall improvement in the operational efficiency of mines.
5 REFERENCES
[1] Vosloo, J., Liebenberg, L. and Velleman, D. 2012. Case study: Energy savings for a deep-mine water reticulation system, Applied Energy, vol. 92, pp. 328-335. [ Links ]
[2] Marais, J. 2012. An integrated approach to optimise energy consumption of mine compressed air systems, PhD Thesis, Dept. Elec. Eng., North-West University, Potchefstroom. [ Links ]
[3] Padachi, L., Bolt, G., Kleingeld, M., Marais, J. and Mathews, E. 2009. Energy efficiency through the integration of compressed air supply control with air network demand control, in Proceedings of the Industrial and Commercial Use of Energy Conference (ICUE), Cape Town. [ Links ]
[4] Du Plessis, J. and Pelzer, R. 2011. Development of an intelligent control system for mine compressor systems, in Proceedings of the Industrial and Commercial Use of Energy Conference (ICUE), Cape Town. [ Links ]
[5] Fraser, P. 2008. Saving energy by replacing compressed air with localized hydropower systems: A 'half level' model approach, in Proceedings of The International Platinum Conference Platinum in Transformation, Sun City, South Africa. [ Links ]
[6] Neale, J. and Kamp, P. 2009. Compressed air system best practice programmes: What needs to change to secure long-term energy savings for New Zealand, Energy Policy, vol. 37(9), pp. 3400-3408. [ Links ]
[7] Marais, J. and Kleingeld, M. 2013. Simplification of mine compressed air systems, in Proceedings of the Industrial and Commercial Use of Energy Conference (ICUE), Cape Town, South Africa. [ Links ]
[8] Cilliers, C. 2015. Benchmarking electricity use of deep-level mines, PhD Thesis, Dept. Mech. Eng., North-West University, Potchefstroom. [ Links ]
[9] van Tonder, K. 2011. Sustaining compressed air DSM project savings using an air leakage management system, MEng Dissertation, Dept. Elec. Eng., North-West University, Potchefstroom. [ Links ]
[10] Snyman, J. 2010. Integrating various energy savings initiatives on compressed air systems of typical South African gold mines, MEng Dissertation, Dept. Mech. Eng., North-West University, Potchefstroom. [ Links ]
[11] Kocsis, C., Hall, R. and Hardcastle, S. 2003. The integration of mine simulation and ventilation simulation to develop a 'life cycle' mine ventilation system, in Application of Computers and Operations Research in the Minerals Industries, South African Institute of Mining and Metallurgy, pp. 223-230. [ Links ]
[12] Banks, J. 1998. Handbook of simulation, principles, methodology, advances, applications and practice, 1st ed. John Wiley & Sons, New Jersey. [ Links ]
[13] Kriel, C. 2014. Modernising underground compressed air DSM projects to reduce operating costs, MEng Dissertation, Dept. Mech. Eng., North-West University, Potchefstroom. [ Links ]
[14] Bredenkamp, J., Schutte, A. and van Rensburg, J. 2015. Challenges faced during implementation of a compressed air energy savings project on a gold mine, in Proceedings of the Industrial and Commercial Use of Energy Conference (ICUE), Cape Town. [ Links ]
[15] Friedenstein, B.M. 2017. Simulating operational improvements on mine compressed air systems, MEng dissertation, Dept. Elec. Eng., North-West University, Potchefstroom. [ Links ]
[16] Gous, A., Booysen, W. and Hamer, W. 2016. Data quality evaluation for measurement and verification processes, in Proceedings of the Industrial and Commercial Use of Energy Conference (ICUE), Cape Town. [ Links ]
[17] Meijsen, L., van Rensburg, J. and Booysen, W. 2015. Verification procedures to ensure consistent energy metering, in Proceedings of the Industrial and Commercial Use of Energy Conference (ICUE), Cape Town. [ Links ]
[18] Van Niekerk, S. 2016. Quantification of energy consumption and production drivers in steel manufacturing plants, MEng dissertation, Dept. Mech. Eng, North-West University, Potchefstroom. [ Links ]
[19] Van Rensburg, H.J. 2016. Structuring mining data for RSA section 12L EE tax incentives, MEng dissertation, Dept. Mech. Eng, North-West University, Potchefstroom. [ Links ]
[20] Heyns, G. 2014. Challenges faced during implementation of a compressed air energy savings project on a gold mine, MEng dissertation, Dept. Mech. Eng., North-West University, Potchefstroom. [ Links ]
[21] Schroeder, F. 2009. Energy efficiency opportunities in mine compressed air systems, MEng dissertation, Dept. Mech. Eng., North-West University, Potchefstroom. [ Links ]
Available online 9 Nov 2018
* Corresponding author: ccilliers@researchtoolbox.co.za
# This work was sponsored by ETA Operations (Pty) Ltd
† Author was a post-doctoral student at the North-West University's Centre for Research and Continued Engineering Development (CRCED) in Pretoria, South Africa

