


Services on Demand
Article
 English (pdf)
 Article in xml format
 Article references
Indicators

Related links
-
 Cited by Google
 -
 Similars in Google
Share

 Permalink
South African Journal of Industrial Engineering
On-line version ISSN 2224-7890
Print version ISSN 1012-277X
S. Afr. J. Ind. Eng. vol.29 n.3 Pretoria Nov. 2018
http://dx.doi.org/10.7166/29-3-2046
SPECIAL EDITION
A risk management strategy to identify and prioritise factors affecting industry's carbon tax liability‡
J. Booysen*, #; W. Booysen†; M. Kleingeld
North-West University's Centre for Research and Continued Engineering Development (CRCED) in Pretoria, South Africa
ABSTRACT
The proposed South African carbon tax system forms part of an extensive structure of strategies aimed at addressing the main challenges of climate change. The system is, however, complex, with various concerns and uncertainties. Industries therefore need to adapt positively in order to ensure their sustainability and competitiveness. This paper presents a risk management strategy for industries to identify and prioritise potential factors affecting the cost of carbon tax. The risk management strategy consists of five phases: 1) establishing the concept, 2) identifying the associated risks, 3) analysing the risks, 4) evaluating the risks, and 5) managing the risks according to relevant international or national standards. The risks are effectively prioritised by evaluating the individual severity, likelihood, and correctability of each risk. The strategy is applied to case studies in the iron and steel, ferrochrome, and cement industries. The combined carbon tax exposure for these case studies is about R453 million. A discussion of the results reveals that the risk management strategy can be used effectively to identify and prioritise carbon tax-associated risks, and further mitigate the potential tax liabilities.
OPSOMMING
Die voorgestelde Suid-Afrikaanse koolstofbelastingraamwerk vorm deel van 'n uitgebreide struktuur van strategieë wat bedoel is om die hoof uitdagings van klimaatsverandering aan te spreek. Dié raamwerk is egter kompleks, met verskeie bekommernisse en onsekerhede. Industrieë moet dus positief aanpas om hul volhoubaarheid en mededingendheid te verseker. Hierdie artikel bied n riskobestuur-strategie aan vir industrieë wat hul potensiële faktore, wat die koolstofbelasting kan beïnvloed, wil identifiseer. Hierdie strategie bestaan uit vyf stappe: 1) vestiging van die konsep, 2) identifisering die gepaardgaande risiko's, 3) analisering van hierdie risiko's, 4) evaluering van die risiko's en 5) bestuur van die risiko's volgens relevante internasionale en nasionale standaarde. Die risiko's is effektief geprioritiseer deur die individuele erns, waarskynlikheid, en korrigeerbaarheid van elk te evalueer. Die strategie is toegepas tot gevallestudies in die yster-en-staal-, ferrochroom-, en sementindustrieë. Die gekombineerde koolstofbelasting blootstelling vir hierdie gevallestudies is ongeveer R453 miljoen. 'n Bespreking van die resultate toon dat dié risikobestuur-strategie gebruik kan word om hierdie risiko's te identifiseer en te prioritiseer om sodoende verdere belasting-implikasies te verminder.
1 INTRODUCTION
Climate change is a large environmental problem brought on by greenhouse gas emissions (GHGs) [1]. These emissions are considered a problem, since they have an extensive lifespan in the 26
atmosphere and can therefore adversely affect every living organism by affecting the earth's climate [2] [3] [4]. South Africa is one of the most CO2 intensive countries in the world (emitting 10 tonnes of CO2 per capita), with energy intensive industries contributing about 80 per cent of the total emissions [5] [6].
These emissions can, however, be reduced through effective management of climate change using social, economic, and environmental interventions [7]. These interventions include a price mechanism, termed 'carbon tax', that is used to incentivise behavioural changes by taxing emissions [8]. From as early as 1990, carbon tax has been used by international administrations (such as Finland) to control and mitigate GHG emissions [9] [10].
The proposed South African carbon tax system is very complex, since it relies on the self-quantification of emission values [11]. Various sources also state that carbon tax is not ready to be implemented in South Africa because there are still some uncertainties about key features of this strategy [8]. Regardless of this, industries will need to adapt in order to ensure their sustainability and competitive advantage within the associated uncertainties [12].
This paper provides a risk management strategy effectively to identify and prioritise the risks associated with the South African carbon tax system. This strategy is aimed at energy-intensive industries. The information presented in this paper is based on a Master's dissertation submitted in 2018 [13].
2 LITERATURE REVIEW
2.1 Risk management
Risk management strategies are primarily used to direct and control an organisation's specific risks [14]. The main function of such a strategy is to identify potential risks before they occur, and to simplify risk-handling activities on a continual basis. The management strategy for carbon tax presented in the next section was thus developed using general industry practices [14] [15] [16] [17] [18]. The general steps are:
• Establish the context
• Identify the risks
• Conduct a risk analysis: Assess the likelihood and impact (severity) of each risk
• Conduct a risk evaluation: Measure the risks according to their likelihood and impact
• Treat the risks: Construct a prioritised list of risks for the evaluation process; link risk to relevant industry standard
• Continually monitor and review
The general steps were applied to the literature related to carbon tax.
2.2 Carbon tax uncertainties
Introduction
The introduction of carbon tax in South Africa has been the topic of numerous discussion papers since 2011. In April 2017, the Department of Environmental Affairs released the National Greenhouse Gas Reporting Regulations, which required energy-intensive industries to report their greenhouse gas (gHg) emissions by 31 March 2018 [19]. The latest version of the Carbon Tax Bill was also published for public comment in December 2017 [20]. The mandatory reporting of GHG emissions therefore brings carbon tax one step closer to becoming a reality.
The proposed tax rate is to be applied to Scope 1 emissions, split into three categories: combustion, fugitive, and industrial process emissions [21] [22]. Combustion emissions are defined as the emissions from all fossil fuel inputs used to generate heat or electricity; fugitive emissions are based on the emissions released during the extraction, processing, and delivery of fossil fuels; and industrial process emissions include the GHG emissions produced during a manufacturing process (i.e., chemically or physically transformed material) [21]. Due to measurement difficulties, certain sectors such as agriculture, forestry, other land use (AFOLU), and waste will be excluded from the tax during the implementation phase [23] [24]. To ensure a smooth transition to a low-carbon economy, it is proposed that carbon tax be implemented in phases, and that a percentage allowance be allocated to the levied industries [12] [21].
Thorough research on the draft Carbon Tax Bill and associated reports revealed several uncertainties about the practical implementation of the proposed system. These issues will be discussed briefly in the sections that follow. The identified risks should ultimately be prioritised according to their severity, likelihood, and correctability. An example is provided in section 3 by applying the methodology to a practical case study.
Measuring and monitoring emissions
As previously stated, industries had to report on their GHG emissions by the end of March 2018 [19]. This would have required relevant technology and procedures to measure and monitor the emissions effectively [25]. It could therefore have been administratively challenging and resource intensive for industries if such measures were not already in place [25].
The operational risks were further increased by possible penalties. If the emissions are not calculated and reported correctly, a fine of up to R5 million or imprisonment of up to five years can be imposed for the first offence. If another offence follows, the punishment can be doubled to 10 years' imprisonment or a fine of R10 million [19].
Data uncertainty
If site-specific gHg emission data is not available, other reference data (known as activity data) can be used in the liability estimation process. Unfortunately, there is a current lack of policy-relevant data relating to emission sources used for these calculations [26]. The National Planning Commission (NPC) states that there is a definite 'gap' in SA's draft national development plan. This gap makes optimal policy design difficult, and increases the potential for information irregularities during the development of a carbon tax system [26] [27] [28].
Specific emissions factors
In addition to activity data, specific emissions factors are also required to estimate the GHG emissions of a company. These emission factors therefore need to be both accurate and derived from a reliable source [29]. South African emission factors can be obtained from a variety of sources, such as the draft Carbon Tax Bill and the National Greenhouse Gas Reporting Regulations (NGERs) [29] [30]. However, Brent Cloete specified during a carbon tax seminar in 2016 that not all the emission factors from the two sources (the 2015 draft Carbon Tax Bill and the NGERs) align with one another [21] [31].
An updated version of the draft Carbon Tax Bill has therefore been published in the interim, with emission factors corresponding to those presented in the NGERs [20]. The inconsistencies presented in the 2015 draft Bill and NGERs can, however, affect the accuracy of the final carbon tax liability calculation. The specific emission factors therefore need to be carefully evaluated to ensure a greater confidence in the calculated results [32].
Operational boundary
'Operational boundary' refers to a border set around a certain part of a company's operations [27]. To ensure that no double counting of emissions occurs, the correct operational boundary needs to be chosen [31]. The definition also needs to be fully understood to limit the calculation uncertainty [27].
Calculation methodology
Accurate quantification of GHG emissions is vital, and a clear calculation methodology is therefore necessary. As mentioned earlier, if false or misleading information about the emissions is provided, significant fines/punishments can ensue [19]. Therefore, to determine the mass of CO2 and the carbon tax liability amount, specific activity data and emission factors are required for the calculation. Three calculation methods (tiers) are available to determine the GHG quantity, according to the Intergovernmental Panel on Climate Change (IPCC) 2006 guidelines [31]. The three methods are illustrated in Figure 1, with a short description of each.
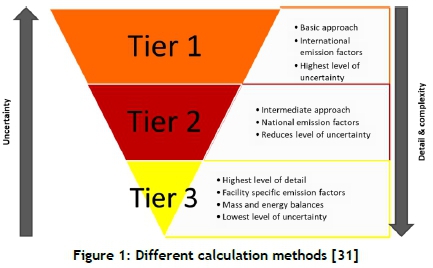
According to the draft Carbon Tax Bill, the prescribed method that should be followed for the emission calculations is the Tier 1 methodology [21]. This method is presented in Equation 2-1.
Carbon tax liability = (Activity data χ Emisson factor) χ Tax rate (Equation 2-1)
However, according to the NGERs, any one of the three methods described in Figure 1 can be used until the end of phase 1 [19].
Carbon tax allowances
Tax-free thresholds or allowances are available in the carbon tax system that can be received by the taxpayer to reduce their amount of liable tax [21]. During the first phase of implementation, a fixed allowance of 60 per cent will be allocated to the carbon tax payer [21]. This tax-free threshold will be used to ensure that carbon tax will be gradually phased in to allow for a smooth transition into a low-carbon economy [8].
In addition to the basic tax-free threshold of 60 per cent, an additional 35 per cent of other allowances can be received by the taxpayer, limiting the sum of allowances to 95 per cent. Ultimately, the taxpayer could be liable for only five per cent of the total carbon tax [12] [21].
Allocation of allowances
According to the draft technical guidelines for the monitoring, reporting, and verification of GHG emissions by industry (the technical guidelines), industries need to categorise their emissions into the IPCC sectors (iron and steel, glass production, ammonia production, and so on) [32]. Each specific sector covers different allowances to incentivise reductions in a company's total carbon tax liability.
From the draft Carbon Tax Bill, it is unclear under which sector many industries are categorised, and therefore how much allowance they can receive [21]. Along with sector uncertainty, a category uncertainty can also become a concern, since the specific allowances are different for each carbon tax category (combustion, fugitive, and process). These categories are not all assigned the same allowances, or even the same number of allowances.
Furthermore, from the draft Carbon Tax Bill, IPCC, and the NGERs, it was noted that the definitions, criteria, and quantities of combustion, process, and fugitive allowances differ from one another [21 ] [30] [31]. Industries should therefore understand the definitions of each category to avoid misallocation between the above-mentioned sectors.
Reporting
According to the "Proposed carbon tax" discussion presented by Cloete in 2016, the alignment of reporting mechanisms needs to be addressed, since there is a variation between the reporting of carbon tax and the NGERs [33] [30]. In other words, carbon tax should be reported every six months, while mandatory reporting should be done annually [21].
The emission reports constructed by industries should be sent to various competent authorities. The reported emissions must first be collected by the Department of Energy (DoE), and then verified by the National Inventory Unit (NIU) based at the Department of Environmental Affairs (DEA). Finally, the report must be transferred to the South African Revenue Services (SARS), which is the administrator [19] [30] [34]. Verification processes by these authorities are, however, not clear [33] [35].
Administration
The complexity of the proposed system can represent a significant liability for SARS, since the recommended methodology and systems in place are complicated and unverified [33]. Suitable and qualified personnel are also necessary for effective operations, which increases the level of complexity [36]. Distributional and competitive concerns might also be administratively challenging, and should therefore be dealt with in a transparent manner [25].
Summary
The extensive research thus clearly shows that SA's proposed carbon tax system is vague and complex. All the identified risks discussed above are summarised in Table 1.
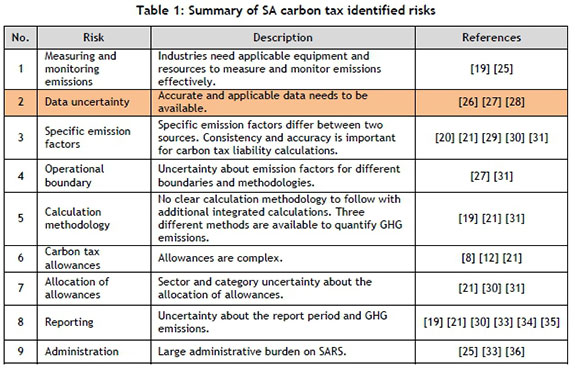
That brief summary of the possible risks clearly highlights the potential challenges faced by industry. Emission-intensive industries in SA should therefore ensure that they understand the concepts and associated risks in order to adapt positively and to guarantee a more sustainable growth focus. Note that, although nine possible risks have been identified from the literature, the rest of the article will only be based on data uncertainty (risk no. 2 in Table 1 ). Section 2.3 is therefore only based on the literature associated specifically with the risk assessment of data uncertainty. Section 3.2 also only provides details of the methodology associated with data uncertainty.
2.3 Risk assessment
Risk assessment entails evaluating the likelihood, severity, and correctability of a risk [37]. The practical application of the three concepts will be illustrated using data uncertainty as an example.
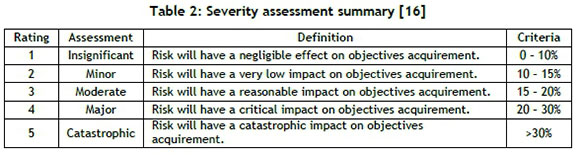
Severity
The severity of a risk can be described as the significance of the risk's occurrence [38]. According to the National Consumer Commission's (NCC) risk management strategy and methodology, there are five severity levels under which a risk can be categorised [16]. The risk severity rating, and the definition and criteria of each level, is summarised in Table 2 [16].
In order to determine to which level/criteria the risk should be allocated, the severity of the risk should first be calculated. This can be done by comparing two data sources, representing the same variable, with one another. Ideally, the datasets should always be the same. Any variance between the two will indicate a potential error. This concept is explained in Equation 2-2.

where Airepresents specific data for measurement i in data source A, while Bi represents specific measurement i in source B. Source A was chosen as the most compliant and correct source to measure the variance of measurement i. The calculated variance (ßi) is then used further to determine the impact of each measurement on the overall carbon tax liability.
A sensitivity plot is used to provide a simplified and clear presentation of the impact each measurement has on the overall method. An example is presented in Figure 2. In the figure, 'Low effect' indicates the change of carbon tax liability initiated by the lowest possible variance calculated with Equation 2-2, while 'High effect' indicates the change initiated by the highest possible variance.
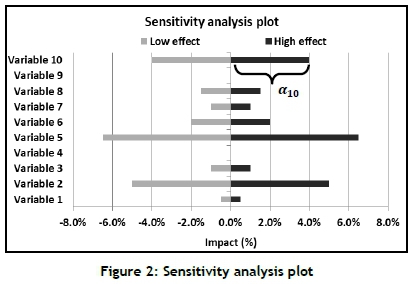
From the plot, the impact (αi) of each individual variable's variance (high and low) is clearly presented. In order to determine the overall impact of all the combined data measurements, Equation 2-3 is used. This will provide the total effect that data uncertainty has on the carbon tax liability.

This overall impact (%) is then used in Table 2 as the criterion to determine the rating and assessment of the specific risk.
Likelihood
'Likelihood' describes the probability that (or frequency at which) a given event will occur [39]. The assessment of a risk's likelihood is difficult to quantify, since every project or system evaluated is unique. Care should be taken during the estimation process, since the process can be influenced by a variety of subjective and unconscious influences [37].
Table 3 presents a risk likelihood rating, along with the definition and criterion of each level obtained from the literature [40].
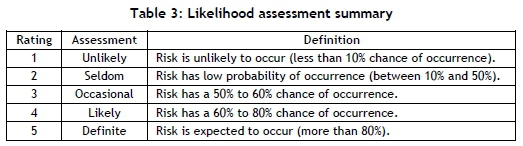
For the purpose of this article, an acceptable variance range of ±10 per cent between the sources was chosen. The likelihood of the risk's occurrence is presented in Equation 2-4.

where fi represents the total measurement points outside the decided range (±10%) and n represents the total measurement points that were evaluated. Equation 2-4 therefore determines the number of times the variance of the two data sets is outside the acceptable range of ±10 per cent. This evaluation can be repeated for every variable. The overall likelihood for all the data measurements can be further determined by using Equation 2-5.

The overall likelihood (%) is then used with Table 3 to determine the rating and assessment of the specific risk.
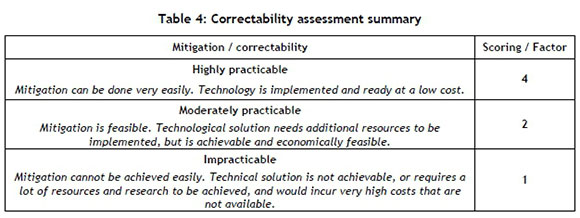
Correctability
SANS 14971:2007 indicates that a third dimension should be added to the risk quantity, since a two-dimensional definition (severity and likelihood) overlooks other important factors. These factors include the significance of the risk, the financial and technical feasibility of corrective actions, and the ability to detect the risk before it occurs [41].
The standard also suggests that early detection is essential, since it can reduce the likelihood of the risk's occurrence and the score of the risk (overall risk significance). Risks that are detectable and correctable without problems should be prioritised before risks that are not easily mitigated. It is therefore further suggested that risks should be evaluated according to a third factor to prioritise the risks according to their mitigation potential, regardless of their significance [41]. Table 4 indicates the score that should be given to the risk according to its ability to be mitigated or corrected.
Risk evaluation
As mentioned, the quantification of a risk consists of two variables - severity and likelihood - but for this study, a third variable is added [37]. This is done to ensure that all the relevant and important factors are included. All of these variables need to be quantified to determine the effect of the risk. The overall risk significance that is associated with the three dimensions of a risk that should be considered is presented in Equation 2-6.
Risk = Severity χ Likelihood χ Correctability (Equation 2-6)
From this investigation, the risk and the effect of the risk can be fully evaluated and comprehended by assessing the three components (severity, likelihood, and correctability).
3 METHODOLOGY & RESULTS
3.1 Overview of methodology
The methodology consists of a risk management strategy divided into five phases: context establishment, risk identification, risk analysis, risk evaluation and, lastly, risk management. This paper briefly touched on context establishment in Section 1, and risk identification in Sections 2.1 and 2.2. Section 2.3 gave an overview of the methods used for risk analysis. Section 3 will now discuss risk evaluation using real industrial case studies. An overview of the risk management strategy is presented in Figure 3.
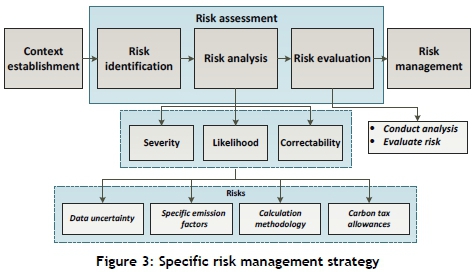
Only four of the nine identified risks are presented in Figure 3. Not all the risks from Section 2.2 are applicable, since not all of them are influenced by measurable quantities. It was therefore decided to base the methodology only on the four listed risks.
This strategy will therefore assist industries to identify the highest cost-affecting factors associated with carbon tax. The strategy will further serve as a practical application to identify risks associated with carbon tax, and prioritise these risks according to various risk factors identified in the literature study. However, this paper primarily focuses on the identification and prioritisation of carbon tax associated risks, and not on their management/mitigation.
In the next section, each step of the strategy will be discussed in more detail using a case study to illustrate the concepts. As previously stated, for this paper only data uncertainty will be presented through the case study.
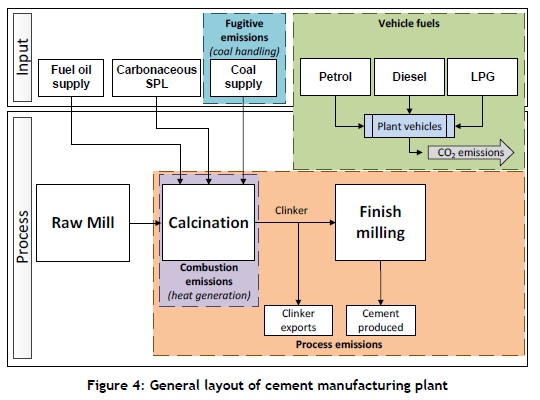
3.2 Case study results
The methodology was applied to various case studies. The combined results are presented in Section 4. However, in order to explain the methodology in more detail, only one case study will be discussed in detail. This case study represents the investigation on a cement manufacturing plant. A cement manufacturing plant emits CO2 equivalent emissions in the form of combustion, industrial processes, and fugitive methods. Figure 4 provides a brief overview of the plant and the allocation of the specific emissions. The blue section represents the fugitive emissions, the purple section the combustion emissions, and the orange section the process emissions. For this case study, vehicle fuels (green section) are also included in the layout and calculations, but these can be subtracted from the combustion emissions since the penalty for emissions from vehicles is already accounted for in the fuel levy [20] [21].
Context establishment
As noted in Section 2.2, the proposed carbon tax system is complex and vague. The uncertainty about the system is thus established as the context of the study, focusing mainly on the emissions from a cement manufacturing plant.
Risk identification
The second step in the strategy is to identify the risks. The primary investigation was conducted in Section 2.2, where carbon tax in SA was investigated and the related risks were identified. However, not all the identified risks are presented in the case study. The risk data uncertainty was selected for the discussion, and therefore the results will only include the severity, likelihood, and correctability for data uncertainty in a cement manufacturing plant.
Risk analysis
The third step, as illustrated in Figure 3, is to analyse the risk, which is assessed according to its severity, likelihood, and correctability.
Severity
By using the methods discussed in Section 2.3, the severity of data uncertainty in a cement manufacturing plant was determined. All the measurement points were first evaluated with a second data source, and the overall variance was determined using Equation 2-2. The annual variance of each measurement point is presented in a bar chart in Figure 5.
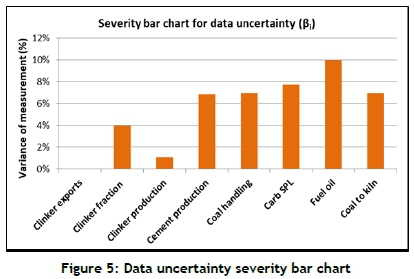
The distribution of variances in the measurement points is presented, with the highest variances clearly indicated as the fuel oil and carbonaceous SPL at 10.0 per cent and 7.7 per cent respectively. A sensitivity analysis distribution plot was also constructed to indicate the overall effect that the variance in data has on the carbon tax liability. This plot is presented in Figure 6.
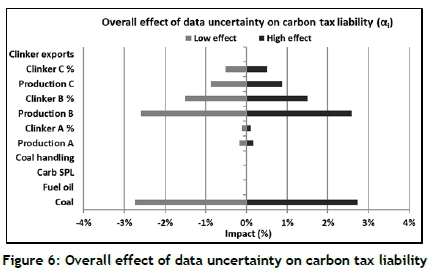
By using Equation 2-3, the overall impact of data variance on the carbon tax liability was calculated to be 4.2 per cent. The risk can be rated further according to Table 2. From the table, the risk has an insignificant impact on the carbon tax liability, and a rating of 1 was therefore given.
Likelihood
The likelihood of data uncertainty occurring was determined by using the individual variance calculated in the severity step. This was done by calculating the number of times the variance of a specific measurement is outside the acceptable range of ±10 per cent. The annual likelihood for each measurement point was calculated according to Equation 2-4, and is presented in Figure 7.
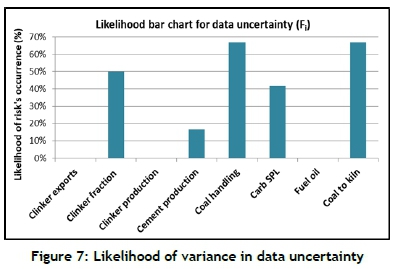
By using Equation 2-5 and Table 3, the overall likelihood of data uncertainty was calculated to be 25.0 per cent, which indicates that the risk will occur seldom. A rating of 2 is therefore given.
Correctability
The mitigation potential for data uncertainty was considered highly practicable (score of 4), since data uncertainty can be mitigated with the traceability of data sources to correct, and with compliant meters and reports. Minimal human resources and research were required to mitigate the uncertainty of the data. The required technology was also already in place at a low cost. The mitigation potential for data uncertainty was therefore done easily [42] [43] [44] [45].
Risk evaluation
The risk is evaluated in the fourth step of the strategy by using Equation 2-6. With a severity rating of 1, a likelihood rating of 2, and a correctability rating of 4, the overall significance of the risk in the case study (data uncertainty) was calculated to be 8. The risk assessment was completed for all four of the listed risks, although they are not presented in this article. A bar chart illustrating the overall significance of all four of the identified risks is presented in Figure 8.
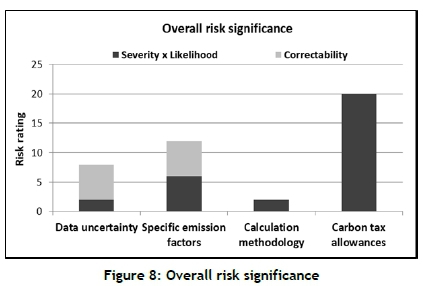
Finally, the risks were prioritised according to their severity, likelihood, and correctability. The risk with the highest significance, and the one that should therefore be the main focus of the cement manufacturing industry, was the carbon tax allowances. The second highest risk was the specific emission factors, and data uncertainty was third. The risk with the lowest quantity, and therefore the lowest priority, was the different calculation methods.
4 DISCUSSION OF RESULTS
4.1 Validation
The strategy that has been developed can assist emission-intensive industries to assess their carbon tax liability correctly. The results obtained from all three case studies were thus validated by comparing the quantified risk significance with the risks generally perceived by industry engineers. The data was collected using a survey completed by 16 engineers working actively in the energy industry. The comparison is illustrated in Figure 9.
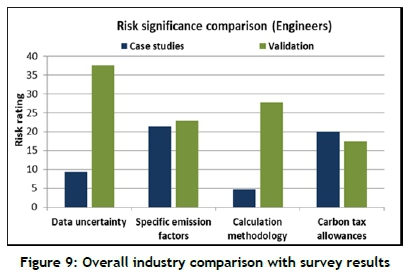
From the figure, the industry engineers (validation - green bars) consider data uncertainty to be the highest affecting risk, with a rating of 38, and the carbon tax allowances to be the lowest affecting factor, with a rating of 17. However, from the case studies (blue bars), the specific emission factors were identified as the primary risk, with a rating of 21, and calculation methodology as the lowest, with a rating of 5. The comparison confirms that generally there is a non-impartial view on carbon tax, and therefore misconceptions about the associated risks are apparent.
4.2 Potential impact
The final part of the validation is to determine the difference in carbon tax liability between the primary identified risk from the case studies (specific emission factors (EFs)), and the highest risk identified from the survey (data uncertainty). Table 5 summarises the annual carbon tax liability (in millions), with severity percentages, and the difference between the case study (primary risk) and the survey results. The severity percentage determined for each risk in the individual case studies was used to determine the risk liability and effect on the carbon tax.
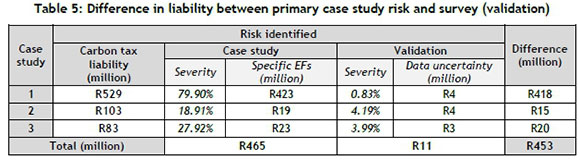
The table reveals a large difference between the two risks' annual liability. It is clear that, if the focus were on data uncertainty (according to the survey results) instead of on the actual highest priority risk (specific emission factors), then time, expenses, and resources would have been misallocated.
The annual difference between the two risks results in a combined total liability of R453 million for the three case studies. Accordingly, there is a need for a risk management strategy to identify and prioritise risks for the proposed carbon tax system in SA, to decrease the complexity of the system and to reduce potential tax liabilities.
4.3 Recommendations
In order to improve the study, a few recommendations for further studies were identified [13]. To ensure that the risk significance is as accurate as possible, the constant correctability factor that was used can be replaced with a site/industry specific factor. It is also recommended that research be done on how a risk can be evaluated easily and provided with a correctability score. Futhermore, it is recommended that the risk management strategy be repeated once the risks have been prioritised according to their severity, likelihood, and correctability. If the risks are considered highly practicable (easily mitigated), the overall risk quantity can be reduced and the prioritised risks can change. The risk management strategy can also be completed for all the idenfied risks in Table 1 in order to increase the overall confidence in the strategy.
5 CONCLUSION
The paper introduced a new method that can be followed when reviewing uncertainties associated with the South African carbon tax system. The strategy can provide a holistic view of the South African carbon tax system, and assist industries to prioritise the identified risks. This will ensure that industries can adapt positively and proactively in order to keep their sustainability and competitive advantage. Essentially, the strategy can be used to save time and capital expenses when reporting emissions.
The results revealed that, by implementing the risk management strategy, the complexity of the proposed South African carbon tax system can be decreased and potential tax liabilities can be reduced. The strategy was validated through results obtained from an industry-related survey that asked leading industry experts to rate the identified risks independently and intuitively. The overall difference between the results equates to a total liability of R453 million for the three case studies combined.
REFERENCES
[1] Liu, Z. 2016. National carbon emissions from the industry process: Production of glass, soda ash, ammonia, calcium carbide and alumina, Applied Energy, vol. 166, pp. 239-224. [ Links ]
[2] United Nations Environment Programme (UNEP). 2013. Presentation 2: Major environmental problems. UNEP, United Nations. [ Links ]
[3] Shah, A. 2012. Climate justice and equity. [Online]. Available: http://www.globalissues.org/article/231/climate-justice-and-equity. [Accessed 2 October 2017]. [ Links ]
[4] Bodansky, D. 2001. "The History of the Global Climate Change Regime," in International Relations and Global Climate Change, Arizona, pp. 23-40. [ Links ]
[5] Botes, A. 2012. SA's total carbon emissions. Pretoria: Urban Earth. [ Links ]
[6] World Resources Institute Climate Analysis Indicator Tool (WRI CAIT) 2.0. 2015. CAIT - Climate Data Explorer (South Africa), World Resources Institute (WRI), FAOSTAT Emissions Database. [Online]. Available: http://cait.wri.org/profile/South%20Africa. [Accessed 13 March 2018]. [ Links ]
[7] National Treasury. 2011. South Africa's carbon tax policy proposal and update: National climate change response dialogue. Pretoria, South Africa: Government Printer. [ Links ]
[8] Woolard, I. and Davis, D. 2015. First interim report on carbon tax for the Minister of Finance. Pretoria, South Africa: The Davis Tax Committee. [ Links ]
[9] National Treasury. 2017. Budget review. Pretoria, South Africa: Government Printer. [ Links ]
[10] NZFOREX. 2017. Yearly average rates [Online]. Available: http://www.nzforex.co.nz/forex-tools/historical-rate-tools/yearly-average-rates. [Accessed 2 March 2017]. [ Links ]
[11] Promethium Carbon, "Report Carbon Trading in South Africa," Bryanston, South Africa, 2014 [ Links ]
[12] Duvenage, W. 2015. Submission on proposed carbon tax bill (2017). Randburg, South Africa: Opposition to Urban Tolling Alliance (OUTA). [ Links ]
[13] Booysen, J. 2018. Strategy to identify and prioritise risks for carbon tax in South Africa. Potchefstroom: North-West University. [ Links ]
[14] South African National Standard. 2009. 31000 Management: Principles and guidelines. Pretoria, South Africa: SABS Standards Division. [ Links ]
[15] ACT Government. 2012. 6 steps to risk management. Victoria, Australia: WorkSafe Act. [ Links ]
[16] National Consumer Commission. 2017. Risk management strategy and methodology. Centurion, South Africa: Department of Trade and Industry. [ Links ]
[17] Booker, F. 2005. Developing effective risk management strategies to protect your organization, Risk Management, no. 5, pp. 27-32. [ Links ]
[18] Curtis, P. and Carey, M. 2012. Risk assessment in practice. Durham: Committee of Sponsoring Organisations of the Treadway Commission (COSO). [ Links ]
[19] Department of Environmental Affairs. 2017. National greenhouse gas emission reporting regulations. Pretoria, South Africa: Government Printer. [ Links ]
[20] National Treasury. 2017. Draft Carbon Tax Bill. Pretoria, South Africa: Government Printer. [ Links ]
[21] National Treasury. 2015. Draft Carbon Tax Bill. Pretoria, South Africa: Government Printer. [ Links ]
[22] National Treasury. 2013. Carbon Tax Policy Paper. Pretoria, South Africa: Government Printer. [ Links ]
[23] H. Louw, "Tax Alert Carbon tax in South Africa." Cliffe Dekker Hofmeyer, Johannesburg, South Africa, pp. 1-6, 2015. [ Links ]
[24] National Treasury. 2015. Draft explanatory memorandum for the carbon tax bill. Pretoria, South Africa: Government Printer. [ Links ]
[25] C. Morden, "Climate Change & Market Based Instruments," in Economic Tax Analysis, 2011, pp. 1-43. [ Links ]
[26] Cloete, B. and Tyler, E. 2012. Carbon tax design options: A discussion document. WWF South Africa. [ Links ]
[27] South African National Standard. 2006. SANS 14064-1:2006 Specification with guidance at the organization level for quantification and reporting of greenhouse gas emissions and removals. Pretoria, South Africa: SABS Standard Division. [ Links ]
[28] National Planning Commission. 2010. Diagnostic report. Pretoria: Department of Planning, Monitoring and Evaluation. [ Links ]
[29] Cloete, B. 2016. Seminar 2: Understanding the carbon tax calculation, in NBI Carbon Tax Public Seminar (adapted from National Treasury). Pretoria, South Africa. [ Links ]
[30] Department of Environmental Affairs. 2015. Draft national greenhouse gas emission reporting regulations. Pretoria, South Africa: Government Printer. [ Links ]
[31] Eggleston, S.H., Buendia, L., Miwa, K., Ngara, T. and Tanabe, K. 2006. IPCC guidelines for national greenhouse gas inventories. Japan: Institute for Global Environmental Strategies (IGES). [ Links ]
[32] Department of Environmental Affairs. 2016. Draft technical guidelines for monitoring, reporting and verification of GHG emissions by industry. Pretoria, South Africa: Government Printer. [ Links ]
[33] Cloete, B. 2016. Seminar 1: The proposed carbon tax, in NBI Carbon Tax Public Seminar. Pretoria, South Africa. [ Links ]
[34] National Treasury. 2014. South Africa's carbon tax policy proposal, an update: National climate change response dialogue. Pretoria: Department of National Treasury. [ Links ]
[35] Fin 24, News 24. 2016. Carbon tax will have a negative economic impact. [Online]. Available: http://www.fin24.com/Economy/carbon-tax-will-have-a-negative-economic-impact-outa-20160617. [Accessed 22 January 2017]. [ Links ]
[36] South Africa Petroleum Industry Association (SAPIA). 2016. Carbon offsets. Pretoria, South Africa: National Treasury. [ Links ]
[37] Hillson, D. and Hulett, D. 2004. Assessing risk probability: Alternative approaches. PMI Global Congress Proceedings, Prague, Czech Republic. [ Links ]
[38] Burgenson, A.L. 2006. Risk assessment and management [Online]. Available: http://www.asq509.org/ht/a/GetDocumentAction/i/26024. [Accessed 23 March 2017]. [ Links ]
[39] Curtis, P. and Carey, M. 2012. Risk assessment in practice. Committee of Sponsoring Organizations of the Treadway Commission (COSO). [ Links ]
[40] Thakur, S. and Edwards, G. 2015. A critical tool for assessing project risk. Troy, New York: Bright Hub Project Management. [ Links ]
[41] South African National Standard. 2008. SANS 14971: Medical devices - Application of risk management to medical devices. Pretoria, South Africa: SABS Standard Division. [ Links ]
[42] Greenhouse Gas Protocol. 2003. A corporate accounting and reporting standard (revised edition). Switzerland: World Resources Institute. [ Links ]
[43] International Standard. 2008. ISO 9001: Quality management systems. Switzerland: ISO. [ Links ]
[44] International Standard. 2004. ISO 14001: Environmental management systems. Switzerland: ISO. [ Links ]
[45] International Standard. 2011. ISO 50001: Energy management systems. Switzerland: ISO. [ Links ]
[46] National Treasury. 2015. Carbon pricing in South Africa; the merits of a carbon tax, in National Business Initiative. Pretoria, South Africa. [ Links ]
[47] Hargreaves, J. and Mikes, A. 2001. "The Quantification of Risk," no. 1. The Housing Corporation, London, p. 8. [ Links ]
Available online 9 Nov 2018
* Corresponding author: jbooysen@rems2.com
# Author was enrolled for a PhD degree at the North-West University's Centre for Research and Continued Engineering Development (CRCED) in Pretoria, South Africa
† Author was a post-doctoral student at the North-West University's Centre for Research and Continued Engineering Development (CRCED) in Pretoria, South Africa
‡ This work was sponsored by ETA Operations (Pty) Ltd.

