


Services on Demand
Article
 English (pdf)
 Article in xml format
 Article references
Indicators

Related links
-
 Cited by Google
 -
 Similars in Google
Share

 Permalink
South African Journal of Industrial Engineering
On-line version ISSN 2224-7890
Print version ISSN 1012-277X
S. Afr. J. Ind. Eng. vol.29 n.2 Pretoria Aug. 2018
http://dx.doi.org/10.7166/29-2-1905
GENERAL ARTICLE
A virtual store framework model: Optimising travel route for a passenger rail operation of maintenance components using GIS
C.J. Fourie*; O. Chimusoro; O.O. Asekun
PRASA Engineering Research Chair, Department of Industrial Engineering, University of Stellenbosch, South Africa
ABSTRACT
Previous studies of supply chain management systems have attempted to focus on transportation, logistics, storage space planning, and time-to-delivery. The biggest challenge for large organisations like the Passenger Rail Agency of South Africa, which has a presence throughout South Africa, is trying to manage all stores efficiently and effectively. This article looks at these challenges, and provides a virtual store framework model to understand the scope and magnitude of an integrated logistics model approach. Geographical information systems were applied to the virtual store to determine an efficient route for transporting components between stores. Furthermore, the authors identified the major aspects and impacts of a virtual store system in a rail passenger transport operation. This was done through on-site studies and a review of the literature on virtual stores. The model was tested on a case study that produced results that include time and cost as the variables for decision-making.
OPSOMMING
Vorige studies in voorsieningskettingbestuur het meestal probeer fokus op vervoer, logistiek, stoorspasie beplanning, en afleweringstyd. Een van die grootste uitdagings in 'n groot organisasie soos PRASA, wat regoor Suid-Afrika strek, is om alle store doeltreffend en effektief te bestuur. Hierdie artikel ondersoek hierdie uitdagings, en stel 'n virtuele stoor raamwerk model voor om die omvang en grootte van so 'n geïntegreerde model benadering te verstaan. Verder het die outeurs belangrike aspekte en impakte van 'n virtuele stoorstelsel in 'n spoorweg passasiersvervoer organisasie geïdentifiseer. Hierdie is gedoen deur gebruik te maak van studies op die perseel en 'n literatuur oorsig van virtuele store. Toetsing van die model het tyd en koste as veranderlikes in die besluitnemingsproses ingesluit.
1 INTRODUCTION
Railway corporations are usually very large and complex organisations. They are responsible for providing railway solutions for major cities and sometimes across whole nations. In the case of the latter, the management of procurement and logistics for maintenance components can become a challenge. An example of such an organisation is the Passenger Rail Agency of South Africa (PRASA), which is responsible for passenger rail services in South Africa. To manage the procurement and logistics of the organisation better, the country has been divided into separate regions - currently, five of them. These semi-autonomous regions organise their own procurement processes independently of each other. This method comes with many drawbacks, such as not taking advantage of economies of scale, duplications, and limitations in being economical. An example of such a drawback is when a spare part is required for corrective maintenance in a particular region. In the current procurement process it can take weeks for the supply chain to make it available. However, the part may be available as a spare in another region that does not require it but, due to lack of collaboration within stores and company policies, the part cannot be transferred to the region where it is required. This prompted research to apply a virtual store framework model to avoid such dilemmas.
To create a virtual store, there needs to be an integration of all physical stores, part suppliers, and departments in the organisation. An enterprise resource planning (ERP) system is an application that assists with the integration of key departments, such as engineering stores, supply chain management (SCM), maintenance, and management. An as-is analysis of the available ERP software currently in use at PRASA was done in five Metrorail regions: Cape Town, Tshwane (Pretoria), Wits (Johannesburg), Eastern Cape, and Durban. An understanding of the extent of its use helped to provide focus for the proposal of a virtual store solution. A case study approach was used in this research, as it has the capability to uncover causal paths and mechanisms and, through richness of detail, to identify causal influences and interaction effects that might not be treated as operationalised variables in a statistical study.
This article proposes a virtual store framework model using geographical information systems (GIS) to improve the procurement and logistics of railway maintenance components. This is achieved by adopting the concepts of virtual manufacturing systems to suit the case study.
The next section presents a literature review on virtual stores, logistics, transportation, logistic networks, and GIS. Section 3 details the steps required to create the virtual store framework and an integrated logistic model (ILM) using the virtual store model and GIS to optimise travel routes. In section 4, the model is applied to a suitable case study, with some examples of orders. The results are also presented in that section. Section 5 presents conclusions that can be drawn from the results.
2 LITERATURE REVIEW
2.1 Virtual stores
The widespread use of the Internet and the World Wide Web (www) has made electronic commerce more popular. This form of retailing is a process in which buyers and sellers exchange information, money, and merchandise electronically, primarily via the Internet. This type of trading should not be entirely about maximising profit: it should also include opportunities to build relationships between the organisation and its customers. As a result of this, a proper understanding and an appropriate business model need to be in place [1].
Virtual systems are widely used in advanced manufacturing systems; however, the meaning of 'virtual systems' has not yet been clearly defined. According to Radharamanan [2], the simplest definition of a virtual system is "manufacturing in a computer". Some scholars add another dimension to this short definition by stating that "...virtual manufacturing is an application of virtual reality in manufacturing" [3]. According to Bharath and Patil [4], virtual manufacturing is an advanced form of computer-aided manufacturing based on virtual reality and augmented reality. The same can be said about a virtual store. Marinov and Seetharamu [5] indicated that there is no agreed definition of these terms among researchers, and even the semantics of virtual manufacturing have not yet been completely agreed on. For the purpose of this research, a virtual store is defined as an online store containing rail-related components for sale, as well as the availability and location of these components.
2.2 Logistics and transportation
The term 'logistics' originated in the military, and was concerned with the movement of personnel and materials during times of emergency. It was later adopted by business and became a part of commonly used terminology in professional societies and academic programmes [6]. In general, transportation, which is closely related to logistics, is the movement of people, animals, goods, and services from one place to another. The field of logistics can be divided into infrastructure, vehicles, and operations. Transportation is important, since it enables the movement of people, animals, goods, and services through the dynamic aspect of logistics (vehicles) by using infrastructure such as roads, bridges, railways, airports, harbours, and tunnels (which are the static aspects of logistics) to achieve the operational aspect of logistics [6].
2.3 The logistics network and GIS
It is the view of the Council of Supply Chain Management Professionals (CSCMP) that logistics management activities usually include fleet management, order fulfilment, logistics network design, supply/demand planning, sourcing and procurement, production planning and scheduling, and customer service [6]. The logistics network includes suppliers, warehouses, distribution centres, retail outlets, raw materials, work-in-process, inventory, and completed goods that move between the various facilities that are part of the network [6]. A good logistics network configuration can be established if the following key strategic decisions are determined carefully [6]:
-
The optimal number of warehouses;
-
The location of each warehouse;
-
The size of each warehouse;
-
Specific products that are allocated space in each warehouse;
-
Products that require transportation, and in what quantities; and
-
The best routes in the transportation network.
GIS plays an important role in logistics network management. This is clearly evident from the statistics in scientific literature, which state that 80 per cent of business data has a geographic element; therefore, GIS plays an increasingly important role in any area of business [7]. GIS is employed in the operational, strategic, and tactical systems of logistics [8]. According to Longley et al. [8], GIS is used in operational systems for the following reasons:
-
To monitor the improvement of mass transit vehicles in order to promote better performance and to provide enhanced information to system users.
-
To route and schedule delivery and service vehicles on a daily basis to improve efficiency and reduce costs.
In tactical systems, GIS is used:
-
To design and evaluate routes and schedules for public and school bus systems, garbage collection, and mail collection and delivery.
-
To monitor and inventory the condition of highway pavement, railroad track, and highway signage, and to analyse traffic accidents.
In strategic systems, GIS is used:
-
To plan locations for new highways, pipelines, and associated facilities.
-
To select locations for warehouses, intermodal transfer points, and airline hubs.
According to studies done by Sarkar [6], a GIS is an assemblage of computer software, computer hardware, and geographic data for capturing, managing, analysing, and displaying all forms of geographically referenced information. Selecting sites, targeting market segments, planning distribution networks, and responding to emergencies are all issues that are relevant to the public and private sectors, and encompass questions of geography [6]. GIS applications cut across various industries, and are used by businesses to provide solutions related to customer analysis, market analysis, site selection, risk analysis, territory management, facility/property/asset management, supply chain management, and logistics [6]. For this research, the focus will be on the applications of GIS in logistics.
The next sections will discuss how GIS is used for vehicle routing, calculating accurate distances, and determining site location.
2.4 GIS for vehicle routing and accurate distance calculations
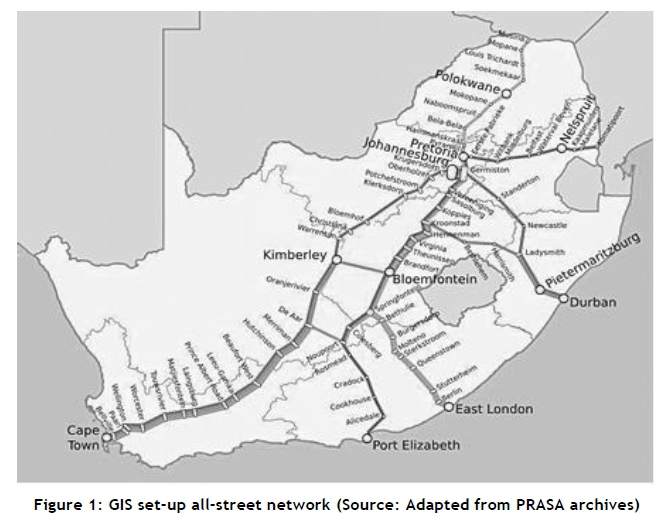
It is very difficult to calculate accurate distances and travel times along road networks using conventional methods. GIS makes vehicle routing and accurate distance calculations much easier. To estimate distances accurately, a precise graphic representation of the area is required. This can be achieved by using a GIS that is based on data files developed from satellite photographs. GIS makes use of geocoding to obtain accurate coordinates and addresses, making it easy to calculate 'Euclidean' (straight line) distances. Some GISs also have the capability of calculating exact road network distances - that is, the distance between two points on an actual street network [9]. Figure 1 shows how GIS is used to map street networks.
Time-critical logistics (TCL) is defined as time-sensitive procurement, processing, and distribution activities. Transportation networks that contain these logistics systems act as a perplexing factor. Researchers have reported on the development of a GIS-based decision support system (DSS) for dynamic modelling of congestion and routing in a TCL scenario. The system predicts network flows at detailed time-based resolutions while determining the departure time and shortest path required for a shipment to reach its destination in a given time frame [10]. Effective decision support is provided by the GIS through its database management capabilities, graphical user interfaces (GUI), and cartographic visualisation [6].
Tarantilis and Kiranoudis [11] made use of heuristics to solve vehicle routing problems. This led to the application of a spatial decision support system (SDSS). The design of the SDSS integrates a relational database management system within a GIS (ARC/INFO or ESRI) framework. The GIS framework allows for efficient representation of transport networks, thus facilitating fast implementation routing routines that solve real-life computationally intense vehicle routing issues swiftly and effectively [6].
2.5 GIS and site location
Selecting the site is one of the main strategic decisions when dealing with any logistics network configuration. Site selection or location modelling involves a search for the optimal location of one or more facilities, warehouses, or stores to support a desired function. Examples range from retail or warehouse site locations, to the location of multiple ambulance dispatch points in the case of emergency healthcare. GIS plays a large part in the positioning of single facilities, including rights-of-way for roads and transmission lines [12].
Studies by Vlachopoulou , Silleos, & Manthou [13] note that warehouse site selection decisions are not merely a question of selecting sites. They involve the comparison of the spatial characteristics of a market with the overall business and marketing goals of the firm. A GIS-aided process for warehouse site selection decisions is presented by the authors, demonstrating the use of the process with a practical example. A number of factors likely to affect costs and customer service are defined, and then integrated into an overall evaluation [6].
Technical barriers to the use of GIS in business decision-making and logistics have significantly reduced over the years due to the lower costs of computing power, the increased availability of digital map data and of software, integration with corporate databases, and advanced use of the Internet to share software and data [6]. Nevertheless, prospects do exist to exploit geographic relationships and constraints within activities in the supply chain, and to support various levels of logistics decision-making.
2.1 ERP and GIS integration
In implementing an ERP system, a system must be developed comprising the adrenalin mobile agents that facilitate the intra- and extra-enterprise communication and middleware linkages with third-party applications that are integrated into the rolling stock maintenance system. The ERP system provides the following benefits:
-
Provides integration engineering, SCM, finance, HR, and stores (spares/ materials) to an organisation;
-
Allows enhanced scheduling and planning for work assignments;
-
Provides work scheduling and management reporting tools;
-
Accommodates the use of mobile technology to reduce paperwork (SMS/cell phone communication);
-
Accommodates the use of a geographical information system (GIS);
-
Improves automated updates on the status of work, spares stocks, and reorder levels;
-
Implements a preventive maintenance system for plants and equipment; and
-
Provides cost information for all work items.
3 FRAMEWORK MODEL
3.1 Virtual store model
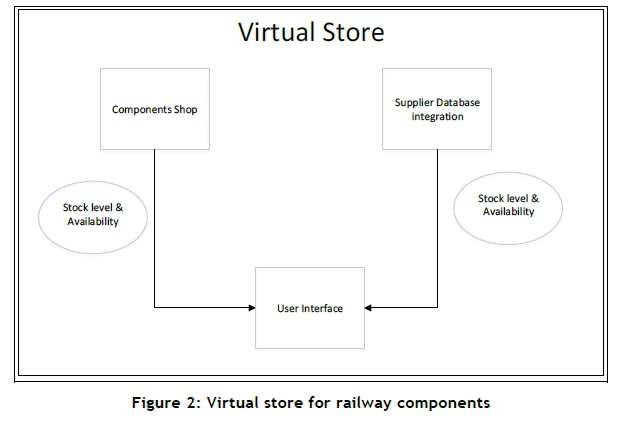
It is assumed that the maintenance stores contain real-time information on the stock levels of components. Applying a business technique to categorise inventory used in material management, an integration of all stores in Metrorail's five regions into a single virtual store can be achieved, as shown in Figure 2. The virtual store will also include an inventory of parts at suppliers. The maintenance department will have the maintenance history of each item of rolling stock, and will also establish the control of fast-moving stock. This information will be important to SCM, and executive reports should be generated.
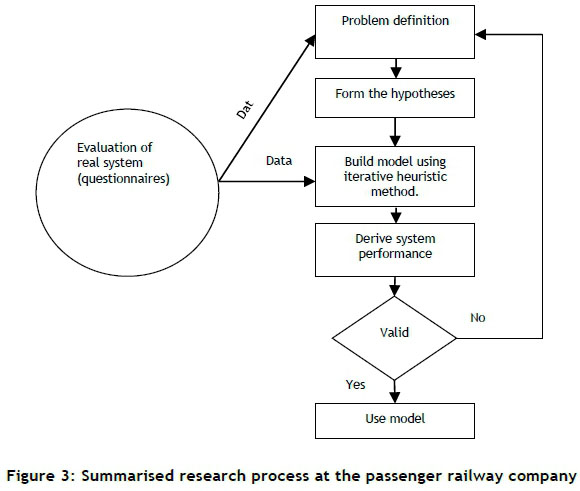
During the evaluation of the real system, a detailed bill of material of the rolling stock, the chosen major components of the rolling stock, and the existing procurement process for each were analysed. Figure 3 shows the summarised research process followed during the investigations into the passenger railway company.
3.2 Integrated logistics model
An integrated logistics model (ILM) is envisaged to be able to handle generic cases of integrating logistics. The automation of the ILM should be done using any available enterprise resource planning software, such as SAP or SYSPRO, to provide consistency, economy of scale, and integration. This will result in high responsiveness, reduced variances, reduced obsolescence of spare parts, reducted inventory, shipment consolidation, better quality, and life cycle support.
In developing the ILM, several questions must be answered. Ratliff and Nulty [14], cited by Niharika and Ritu [15], pointed out that there is no single best approach, best representation, best model, or best algorithm for optimising logistics decisions from the scope and complexity of the logistics questions. As stated by Ratliff and Nulty [14], most of these questions sound general in nature, but the modelling seeks to answer them.
-
Where are the spare parts produced?
-
How many must be produced?
-
When should production be done?
-
Where can materials and components be acquired?
-
How many should be shipped?
-
What is the priority rating for each component?
-
When to ship?
-
What modes of transportation?
-
Where are finished goods stored?
-
Where are the spare parts stored?
-
How much inventory should be kept?
-
How do we retrieve items from the warehouse?
-
What is the service cost level?
The developed model must also find a balance between inventory, stock-outs, and obsolescence costs. The process of evaluating parts will follow an ABC analysis to determine whether they are high-value, low-value, repairable parts, or single parts. Generally, an ABC analysis is an inventory categorisation method that divides items into one of three categories: A, B, or C. 'A' represents the most valuable items, with very tight control and accurate records; 'B' items are less tightly controlled, and have good records; while 'C' items are the least valuable ones. The underlying assumptions are that all warehouses in the passenger railway company are potential spare parts stores, and a passenger railway company virtual store is assumed so that spare parts warehouses can be served from others by lateral trans-shipments. The repair capacity is infinite in all warehouses, including the spare parts suppliers. The ILM process includes the following steps:
Step 1: Find out the various basic finished or semi-finished parts-producing departments/organisations leading to the final product, using the bill of materials technique.
Step 2: Use prognostic models to determine the optimal replacement time for a component/machine on the rolling stock.
Step 3: Concentrate on the parts that are of immediate interest, and perform a priority rating per spare part.
Step 4: For the chosen parts, prepare the workflow and process flow diagram.
Step 5: Identify the various components, their raw materials and semi-finished parts, and determine their relationships.
Step 6: Prepare the material flow diagram.
Step 7: From the prepared material flow diagram, the material movement information is obtained - i.e., transportation planning, which includes location, sizing, and network alignment.
Step 8: Optimise the material travel and a lean roadmap.
Step 9: Integrate it with the virtual stores framework model.
Step 10: Demand planning: planning process to predict demand based on forecasting. Accurate forecasts decrease costs by reducing uncertainty associated with demand.
Step 11: Draw up a centralised purchasing framework from the system.
Step 12: Incorporate just-in-time principles using a long-term ordering system based on a materials requirements plan (MRP) concept and the capacity requirements planning (CRP) system. This is based on the suppliers' information from the electronic data interchange (EDI) through cooperative links.
Step 13: Compile the supply chain plan, which includes distribution requirements planning (DRP), which in turn ascertains the need to replenish at the passenger railway company's regional/depot stores. This step will include shipment; consolidation and transportation mode selection; transportation system selection; routing and scheduling; and warehousing, as illustrated by Ratliff and Nulty [14].
Step 14: Automate the process using the available enterprise resource planning (ERP) systems - e.g., SAP ERP software or SYSPRO ERP software.
4 CASE STUDY
Site locations in PRASA are predetermined and are already in existence, but the application of a business re-engineering process could help to improve the site locations. Some of the GIS concept has been integrated in the ERP system, which simplifies the process of building a virtual store for a passenger railway company.
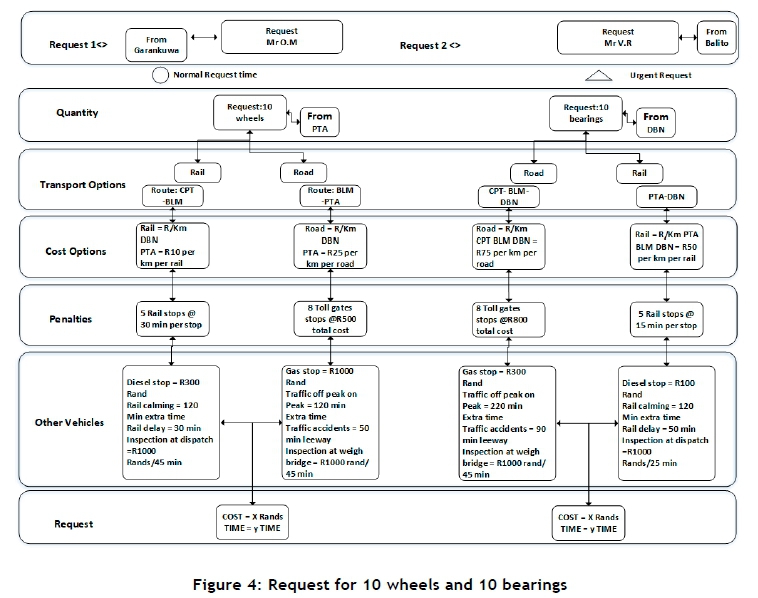
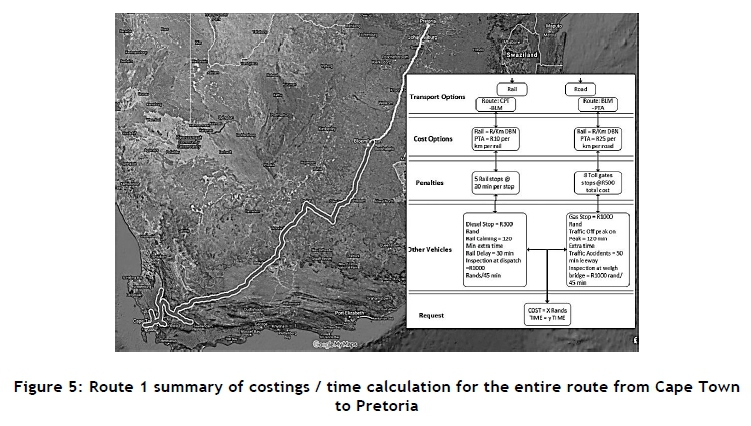
In framing and testing the ILM, the virtual stores framework model was used, together with ArcGIS software. The model was illustrated using ten coach rail wheels that were required in the Pretoria workshop, and ten bearings that were required in the Durban workshop, as the spare parts to test the model. The process goes through a prioritisation of the spare parts, then places an order in the system, which determines the most cost-effective route to bring the wheels or bearings to the requesting workshops from the Cape Town workshop.
The algorithms for the two requests include all the constraints in the possible routes. For example, if it is road or rail transport, it looks at the quantities of spare parts; cost options in R/km; penalties; other variables such as the shortest possible route, including traffic congestion, toll gates, costs, distance, fuel-filling, rail-calming, rail/road delays, and inspections; and loading and offloading times. The results present the cost in Rands and the time in minutes. This will then assist the SCM practitioner to make a quick and accurate decision.
The following steps were followed in testing the GIS algorithms using ArcGIS software for the two different requests. An example is shown in Figure 4.
A circle indicates a normal request while triangle indicates an urgent request. Note that the cost difference is calculated differently for rail and road, since the urgency affects the per-kilometre cost by road or rail. The overall costs will differ, therefore:
-
All networks for railways are extracted from the South Africa.shp file.
-
Mr O.M makes a request from Garankuwa.
-
Request for 10 wheels required in Pretoria.
-
The GIS algorithm calculates that the parts can be found in CPT and that the route from CPT to BLM will use the rail network.
-
GIS algorithm calculates the cost based on road/rail per km.
-
From BLM to PTA the road network is chosen to complete the delivery.
-
The highlighted white line in Figure 5 illustrates the road section of the route from BLM to PTA.
-
The GIS algorithm then assists in calculating the overall cost based on all variables from CPT to PTA.
-
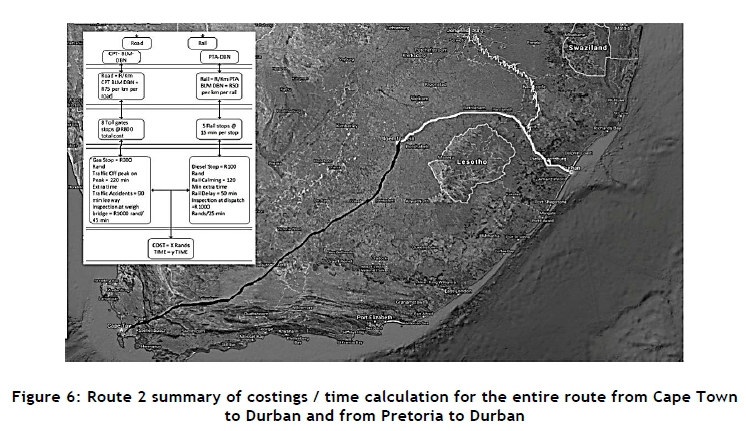
The next request is an urgent request for 10 bearings at the DBN workshop.
-
The GIS algorithm calculates that the parts can be found in CPT. Due to the request being urgent, the road network is chosen.
-
The road network illustrates the route from CPT to DBN.
-
The GIS algorithm calculates that some of the parts are also available in PTA, and rail is suitable since it is an urgent request.
-
The GIS algorithm calculates the route network from PTA to DBN.
-
The rand per km costs by road and by rail are slightly higher because the request is urgent.
Note: As the request is urgent, the road network is chosen. The rand costs per km by road and by rail are slightly higher as a result.
4.1 Benefits of the new ILM
The ILM can be tailor-made with varying levels of complexity to suit any complex organisation. For organisations like the passenger railway company, it is designed to manage the complexity, international and local supply chains, and logistics networks. According to Umeh [16], the current supply chain process for acquiring components below a value of R350,000 takes a total of 30 lead days, and a total of 261 lead days for components above a value of R350,000. The potential benefits of this new ILM, if implemented, are as follows:
1. Making sure that all installed high-value components are evaluated and that the maintenance-free operating period is established as a measure of reliability, which helps to reduce the cost of maintaining the system through a prognostic step in the iteration;
2. Improved customer service through SCM efficiency and effectiveness;
3. Realisation of cost savings through creation of synergies, consolidation for economies of scale, bulk buying, combining orders through the virtual stores system, and load optimisation;
4. The prognostic model assists in longer-term pre-planning of failure times, and necessary spare parts are transported using the passenger railway company's own transport capacity;
5. Optimisation of logistics networks, which brings simpler administration, shorter lead times, and optimal goods flow;
6. Standardisation of global logistics processes using best practice where the passenger railway company is importing the spare parts or the rolling stock;
7. High availability and reliability lead to improved customer service - i.e., the passenger rail customer service is enhanced.
5 CONCLUSIONS
Previous studies have attempted to focus on transportation, logistics, storage space planning, and time-to-delivery within supply chain management systems. The biggest challenge facing large organisations, like PRASA, that have a presence throughout South Africa, is to manage all their stores efficiently and effectively. This article looked at these challenges, and presented an integrated logistics model using virtual stores and GIS to understand the scope and magnitude of an integrated model approach. Furthermore, the authors identified the major aspects and impacts of a virtual store system in a rail passenger transport operation. The developed ILM can be tailor-made - through customisation, with varying levels of complexity - to suit any complex organisation or system. For large organisations like PRASA, it is designed to manage the complexity of international and local supply chains and logistics networks to improve service delivery. The developed ILM can be interfaced with existing processes. The iterative stages of the model should be regarded as decision gates where approvals need to be done. The testing of the model produced results that included time and cost as the variables for decision-making.
REFERENCES
[1] Wang, R. & Wang, X. 2011. Virtual store design in collaborative virtual environments: History, characteristics, and culture. In: Proceedings of the 2011 15th International Conference on Computer Supported Cooperative Work in Design (CSCWD), pp. 793-800. [ Links ]
[2] Radharamanan, R. 2002. Virtual manufacturing: An emerging technology. Age (Omaha) 7:1. [ Links ]
[3] Luzanin, O. & Plancak, M. 2008. Virtual reality technologies in virtual manufacturing: Notes on current trends and applications. J Technol Plast., 33(1-2). [ Links ]
[4] Bharath, V.G. & Rajashekar, P. 2015. Virtual manufacturing: A review. In: National Conference Emerging Research Areas Mechanical Engineering Conference Proceedings, pp. 355-364. [ Links ]
[5] Marinov, V.R. & Seetharamu, S. 2004. Virtual machining operation: A concept and an example. In: SPIE Conference on Intelligent Systems in Design and Manufacturing, pp. 25-26. [ Links ]
[6] Sarkar, A. 2007. GIS applications in logistics: A literature review. US SBA Grant No. SBAHQ-06-1-0046: pp. 1-11. [ Links ]
[7] Gürder, F. 2012. Geographic information systems in strategic decision making in logistics companies. Int J Bus Soc Res. 2(4), pp.76-86. [ Links ]
[8] Longley, P. 2005. Geographic information systems and science. England: John Wiley & Sons. [ Links ]
[9] Bramel, J. & Simchi-Levi, D. 1997. Logic of logistics: Theory, algorithms, and applications for logistics management. New York: Springer. [ Links ]
[10] Miller, H.J., Wu, Y.-H. & Hung, M.-C. 1999. GIS-based dynamic traffic congestion modeling to support time-critical logistics. In: Systems Sciences, 1999 HICSS-32 Proceedings of the 32nd Annual Hawaii International Conference on IEEE, p. 9. [ Links ]
[11] Tarantilis, C.D. & Kiranoudis, C.T. 2002. Using a spatial decision support system for solving the vehicle routing problem. Inf Manag., 39(5), pp. 359-375. [ Links ]
[12] Church, R.L. 1999. Location modelling and GIS. Geogr Inf Syst.,1, pp. 293-303. [ Links ]
[13] Vlachopoulou, M., Silleos, G. & Manthou, V. 2001. Geographic information systems in warehouse site selection decisions. Int J Prod Econ., 71(1), pp. 205-212. [ Links ]
[14] Ratliff, H.D. & Nulty, W.G. 1997. Logistics composite modeling. In: The planning and scheduling of production systems. Springer. pp. 10-53. [ Links ]
[15] Niharika, G. & Ritu, V. 2015. Cloud architecture for the logistics business. Procedia Comput Sci., 50, pp. 414-20. [ Links ]
[16] Ekene, N.U. 2018. Application of lean tools in rolling stock procurement supply chain management. Stellenbosch: Stellenbosch University. [ Links ]
Submitted by authors 18 Jan 2018
Accepted for publication 10 Jul 2018
Available online 31 Aug 2018
* Corresponding author cjf@sun.ac.za

