


Services on Demand
Article
 English (pdf)
 Article in xml format
 Article references
Indicators

Related links
-
 Cited by Google
 -
 Similars in Google
Share

 Permalink
South African Journal of Industrial Engineering
On-line version ISSN 2224-7890
Print version ISSN 1012-277X
S. Afr. J. Ind. Eng. vol.29 n.2 Pretoria Aug. 2018
http://dx.doi.org/10.7166/29-2-1867
GENERAL ARTICLE
Optimisation of stock keeping unit placement in a retail distribution centre#
S.A. van HeerdenI, II ; J.H. van VuurenI, *
IStellenbosch Unit for Operations Research in Engineering, Department of Industrial Engineering, Stellenbosch University, South Africa
IIAt the time of writing, the author was enrolled for an MEng (Industrial) degree in the Department of Industrial Engineering, Stellenbosch University, South Africa
ABSTRACT
The retail problem of slotting refers to the assignment of stock keeping units (SKUs) to the available storage locations in a distribution centre (DC). Generally, the expected total distance travelled by stock pickers during an order consolidation and the resulting level of congestion experienced within aisle racking are common considerations when making these assignments. These criteria give rise to a bi-objective optimisation model with the aim of identifying multiple stock setups that achieve acceptable tradeoffs between minimising the criteria on expectation. A mathematical framework is established in this paper, based on these two criteria, for evaluating the effectiveness of a given stock setup. In the framework, a stock picker's movement between various storage locations is modelled as a Markov chain in order to quantify his or her expected travel distance, while a closed queuing network model is used to devise a suitable measure of congestion. This optimisation model framework forms the basis of a flexible decision support system (DSS) for the purpose of discovering high-quality stock assignment trade-off solutions for inventory managers. The DSS is applied to a special case study involving data from a real DC, and the desirability of the recommended stock configurations is compared with that currently implemented within the DC.
OPSOMMING
Die kleinhandelprobleem van die plasing van voorraadhoudings-eenhede (VHEs) verwys na die toewysing van VHEs aan beskikbare posisies in 'n verspreidingsentrum (VS). Die verwagte totale afstand deur n voorraadkonsolideerder afgelê en die gevolglike verwagte vlak van opeenhoping wat deur hierdie konsolideerders in die roetes van die VS ondervind word, is twee populêre plasingskriteria. Hierdie kriteria gee aanleiding tot n tweedoelige optimeringsbenadering, waarvolgens verskeie voorraadplasings gevind kan word met aanvaarbare kompromieë tussen die kriteria. n Wiskundige raamwerk wat op hierdie twee plasingskriteria berus word in hierdie artikel voorgestel waarvolgens die doeltreffendheid van n gegewe voorraadopset in n VS gemeet kan word. In hierdie raamwerk word die beweging van n voorraadkonsolideerder tussen verskillende VHE-liggings as n Markov-ketting gemodelleer om sodoende sy of haar verwagte reisafstand te skat, terwyl 'n geslotetou netwerkmodel gebruik word as 'n opeenhopingsmaatstaf. Hierdie tweedoelige raamwerk dien as basis van n besluitsteunstelsel (BSS) vir die bepaling van goeie voorraadplasings in n VS. Die BSS word toegepas op n spesiale gevallestudie wat op data van n werklike VS gebaseer is, en die geskiktheid van die aanbevelings in terme van voorraadplasings deur die BSS word vergelyk met die huidige voorraadopset in die VS.
1 INTRODUCTION
Large retailers face the challenge of effectively managing and coordinating multiple activities that make up their sophisticated supply chains. One of these activities involves the efficient storage and consolidation of finished goods within a distribution centre (DC). The retail problem of slotting refers to the assignment of stock keeping units (SKUs) and replenishment stock to available spaces in a fixed warehouse racking infrastructure, forming slots. Research has shown that stock picking operations may contribute as much as 50 per cent to a DC's total operating expense [1, 2]. DC picking operations are typically performed by human stock pickers, with the majority of a stock picker's working hours being spent travelling to and from pick slots within the DC [3].
Various slotting criteria have been derived from generally accepted best practices [4, 5]. These criteria are considered by inventory managers during slotting decisions. The selection of a slotting strategy usually occurs in accordance with a slotting criterion specified by the inventory manager for a particular picking section within a DC. More often than not, combinations of these different criteria are adopted, and trade-offs are pursued between these criteria during slotting decisions. Most of these goals, however, are conflicting in nature. For example, the goals of minimising the distance a stock picker travels and minimising aisle congestion experienced by a stock picker are in direct competition with one another. This is the case because, if frequently picked SKUs are placed in pick slots located far from one another, the stock picker would, on average, be required to travel a larger distance each time these specific SKUs are ordered. Frequently picked SKUs positioned in close proximity to one another, on the other hand, are expected to result in increased congestion [6, 7]. This type of goal trade-off is an important aspect to consider when organising SKUs by popularity. The two above-mentioned criteria are among the most popular in analyses of slotting decisions [8, 9], and are therefore explicitly considered in the analysis conducted in this paper.
The primary aim in this paper is to design and demonstrate the practical workability of a flexible DSS capable of providing high-quality dedicated stock assignment recommendations, as well as an efficient stock picker routing strategy, for a retail DC. The DSS should provide the slotting decision-maker with a viable set of stock setups that represent desirable trade-offs between the conflicting objectives of minimising, on expectation, the aforementioned objectives. The scope of our research does not, however, encompass improvements to the physical design of an existing DC layout, since an established DC will, for the most part, not be willing to change its layout, given the time and cost associated with such a task. The focus, rather, is on providing practical slotting recommendations within the existing floor layout of a DC. For reasons of simplicity, we also limit our scope to a single DC section in which stock pickers begin and end their picking assignments from a single starting and ending point, and are required to pick stock from only one rack shelving level (on ground level).
This paper is organised as follows. A brief review of the literature related to DC management is conducted in §2, while §3 is devoted to the establishment of a mathematical model according to which the quality of a particular stock setup may be evaluated in respect of the two aforementioned slotting criteria. This model forms the working basis of a flexible DSS, which is presented in §4. This section also includes a description of a small hypothetical slotting problem instance employed for the purpose of model validation. An assessment of the effectiveness of the DSS in the context of a real DC environment is then conducted in §5. The paper closes in §6 with a summary of the work presented, as well as suggestions for possible follow-up work.
2 LITERATURE REVIEW
The aim in this section is to provide a brief review of the literature required for SKU placement optimisation within a DC, as discussed in the introductory section. First, various routing strategies typically used during order picking are reviewed in §2.1. The focus then shifts in §2.2 to existing techniques that have been proposed for the assignment of SKUs to slot locations in a DC. It is assumed that the reader is familiar with the quintessential operations research notions of the classical assignment problem (AP) [10] and the travelling salesman problem (TSP) [11], as well as the theory related to Markov chains [12] and queuing theory in general [13].
2.1 Stock picker routing strategies
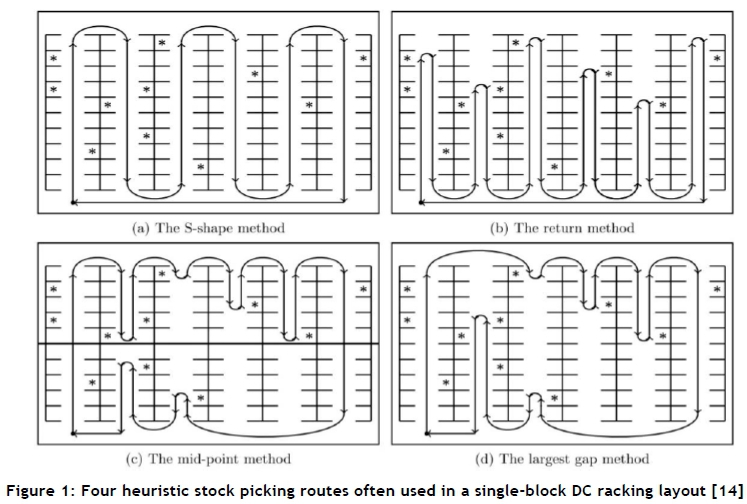
The route that a stock picker follows when travelling to each individual slot for picking purposes is typically pre-determined according to some heuristic method [14, 15]. The route produced by the heuristic method is usually dictated by a precedence protocol in which slots must be visited, called a picking sequence. Such a picking sequence may either be static, in the sense that all picking routes are dictated by one 'master' sequence, or dynamic, in which case an SKU picking sequence is determined afresh for every new picking order. Figure 1 contains schematic representations of the most common picking sequence heuristics used for a single-block racking setup, each for the same customer order. Asterisks indicate the locations of ordered products that must be picked, while arrows indicate the route along which, and the direction in which, the stock picker travels. The simplest and most common of these heuristics is the static S-shape method, depicted in Figure 1 (a). The static return method, illustrated in Figure 1 (b), requires that a stock picker always exit an aisle from the same end as that from which (s)he entered. The static mid-point method involves partitioning the aisles into two equal sections. As may be seen in Figure 1(c), a stock picker only picks SKUs that are situated no farther away than halfway down an aisle. The dynamic largest gap method, depicted in Figure 1(d), employs a similar approach to that of the mid-point method; however, instead of travelling no further than halfway down an aisle, a stock picker now travels to one of two successive ordered products in an aisle that exhibits the largest distance between them.
It has been shown that the time required by a stock picker to travel to the individual stock locations contributes to approximately half of the overall order fulfilment time [3]. Therefore, the focus should also be on finding an efficient picking sequence that minimises the likely distance a stock picker travels during a typical order, in addition to finding a suitable DC stock location setup. For modelling simplicity, we assume use of a static picking sequence for a DC section such as the one under consideration.
2.2 Existing models used for stock placement
The notion of a DC storage assignment policy was first conceived by Heskett [16]. In his 1963 paper, he introduced the well-known cube-per-order index (COI) storage policy, which aims to position SKUs that are frequently picked in the slots that are closest to defined stock picker starting and ending points of a storage section within the DC. Heskett used an integer linear programming model in the formulation of his storage policy, which attempts to minimise the impact of overall stock picker travel distance when assigning m SKUs to η storage locations with q starting and ending points.
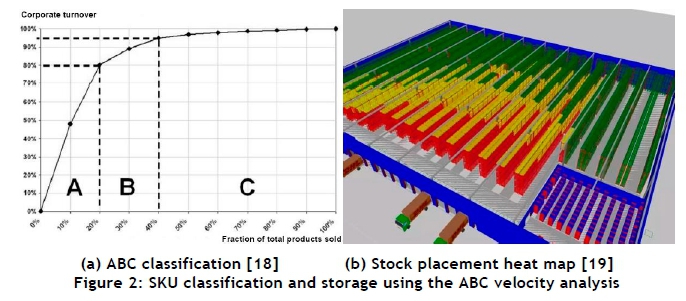
Derived from the notion of a Pareto analysis, a class-based storage policy commonly used in DCs is the ABC velocity analysis [17]. This type of analysis is typically used by inventory managers to classify their stock as Type A, Type B, or Type C, based on the corporate turnover generated by SKUs [18], as shown in Figure 2(a). Stock picking often follows the well-known Pareto principle in that only a small percentage of stored SKUs contribute to the majority of order fulfilments. Figure 2(b) contains a heat map illustration of a typical DC floor plan, in which the different stock colours represent their popularity in terms of order membership. Typically, all Type A SKUs are positioned in slots close to the dispatch bays (from where outbound delivery vehicles depart), and infrequently picked SKUs are positioned in slots located near the back of the DC. This is because dispatch bays commonly signify the starting and ending points in a stock picker's assignment. In reality, this approach usually cannot be fully implemented: high pick frequency SKUs are often rather spread out in a bid to avoid long queues at specific SKUs within aisles [6].
In addition to the previously mentioned stock placement policies, there are three further generally accepted storage policies [20]. The simplest of these is known as the random storage policy, in which incoming SKUs are allocated any available slot location. On the other hand, a DC may implement a dedicated storage policy, which requires each SKU type to have its own pre-specified slot location. A shared storage policy falls between these two extremes of random and dedicated storage policies. This policy allows a slot location to hold different SKU types over time (still restricted to one SKU per slot at any given time), where the fast-moving SKUs are preferentially allocated to available slots located closer to the defined starting and ending points of order picking.
In a more recent paper, Huber [8] used various queuing models to calculate the throughput of a manual order picking system under congestion considerations for many alternative aisle designs. His results suggest that throughput of an order picking system is significantly hampered as the number of stock pickers within a DC section increases. In terms of layout design, Huber concluded that designs with a few long aisles experience more congestion than designs with many short aisles. Furthermore, Huber showed that, in terms of throughput, class-based storage does not necessarily outperform random storage. In order to reduce congestion, Huber advised distributing frequently picked items evenly over an entire DC section instead of clustering them into distinct groups. This finding is also confirmed by other literature sources [7].
3 SKU PLACEMENT QUALITY EVALUATION
This section is devoted to establishing a mathematical framework for quantifying the impact of a particular SKU placement on the expected distance travelled and congestion experienced by a stock picker. In §3.1, we attempt to quantify the distance a stock picker is expected to travel, given a particular stock setup and previous order picking demand data. The focus shifts in §3.2 to the formulation of an appropriate measure of congestion that accounts for the close-proximity placement of popular SKUs. The results of the preceding subsections are unified in §3.3 in the formulation of a bi-objective optimisation model for SKU placement in pursuit of a trade-off between the aforementioned placement criteria. Finally, a metaheuristic approach used to solve the model approximately is discussed in §3.4.
3.1 Modelling a stock picker's expected travel distance
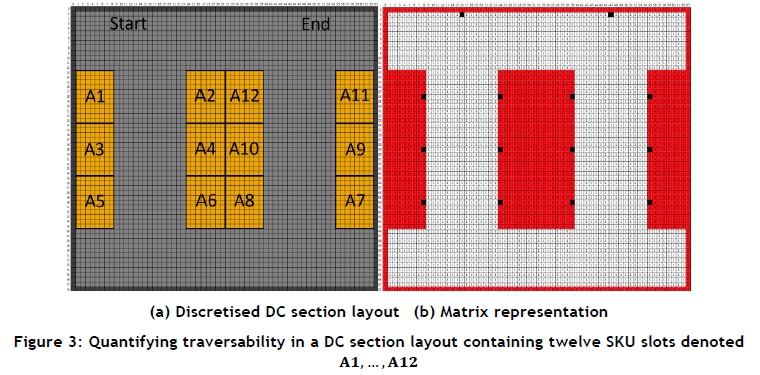
Use of a dedicated storage policy is assumed for the purpose of deriving a mathematical description of the expected travel distance of a stock picker in a DC. In this case, the distance a stock picker is likely to travel is assumed to be a direct result of the locations of the individual SKUs within the DC section and the picking sequence employed. Since the location of a specific slot does not change over time, distances between individual slots are fixed quantities that arise from slot dimensions and existing aisle configurations within a DC. The total distance a stock picker travels during a stock picking assignment is simply the sum of the individual distances travelled between respective SKU-slot pairs that must be visited in order to fulfil a specific order. In order to determine these respective slot distances, the physical DC section layout in question must first be quantified. The input to the process of determining slot distances is a binary matrix of entries corresponding to a rectangular grid discretisation of the DC section layout (as illustrated in Figure 3(a) for a DC section containing twelve SKU slots), where each cell in the grid is defined as either traversable (represented by a unit entry in the binary matrix) or non-traversable (represented by a zero entry in the binary matrix). The binary matrix corresponding to the grid of Figure 3(a) is shown in Figure 3(b). A cell can be classified either as forming part of a slot or boundary of some sort, in which case it is deemed non-traversable; or as forming part of the section's aisles, in which case it is deemed traversable. If there are s - 2 SKU slots in the DC section, in addition to a single starting and ending point for order picking, then a set S = {1,2, ...,s} of nodes may be defined to represent the locations a stock picker may visit when consolidating an order (represented by the black cells in Figure 3(b)), where nodes 1 and s represent the defined start and end points respectively.
The A* pathfinding algorithm is a best-first search algorithm often used to find the shortest path in a two-dimensional grid between two nodes [21]. This algorithm may be used to determine the distance between all slot pairs in the DC section. A complete description of the working of the A* pathfinding algorithm is provided by Wenderlich [22]. The input to this algorithm is a binary matrix indicating the traversability of the DC section and two specified nodes contained in the set 5. The output is the shortest traversable distance between the two specified nodes. In this way, an sxs distance matrix D may be constructed for the DC section in question. There are, of course, many alternative algorithms that may be employed to populate the matrix D, such as Dijkstra's algorithm [23] or Floyd's algorithm [24].
The next step is to define the sequence in which slots are to be visited by a stock picker when consolidating an order. The route that a stock picker follows is determined by the picking sequence employed, as discussed in §2.1. It is for this reason that a pre-optimisation step is introduced that may be implemented by the decision-maker to determine a static sequence in which slots must be visited in order to ensure that an efficient route is typically followed by stock pickers. This may be achieved by thinking of each node in S as a city that a travelling salesman (represented by a stock picker) must visit exactly once. In this way, a standard TSP model may be adopted from the literature to determine the shortest route that a stock picker would have to travel, starting and ending his or her picking assignment at the set locations 1 and s respectively, and visiting every slot in the DC section. A binary sxs decision matrix W with rows and columns corresponding to nodes in S is introduced to capture this TSP route, where the entry in row i and column j is 1 if node i is an immediate predecessor of node j in the picking sequence.
Suppose there are q ≤ s - 2 SKUs that have to be located in the s - 2 slots of the DC section. Each SKU may be seen as possessing a certain probability of being picked. When SKU i e {1, ...,q} is placed in a specific slot, the slot would then acquire a certain probability viof being visited, which is dictated by the popularity of SKU i. In order to determine the quantity v£, one may analyse past SKU data in which the pick frequencies of all SKU have been recorded. A column vector
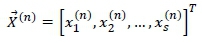
may thus be populated to contain the visitation probabilities associated with the q SKUs to be assigned to the respective pick slots. In order to ensure a balanced SKU-slot assignment problem in the case where q < s - 2, a total of (s - 2) - q fictitious (or 'dummy') SKUs, each having a zero pick frequency, may be introduced and appended to the vector Κ. During the assignment stage, any slot associated with these fictitious SKUs would, in reality, be empty. Likewise, a further two fictitious SKUs with unit pick frequencies should be assigned to the defined start and end nodes 1 and s, thereby ensuring that a stock picker always begins and ends a picking assignment at these locations. A balanced assignment problem may therefore be solved to determine the assignment of SKUs to pick slots within the DC section. The placement of a selected SKU at the nthnode in the picking sequence is captured by a binary decision column vector
where

and where the matrix  contains all the decision column vectors that define a feasible stock setup.
The distance a stock picker travels during an assignment may be thought of as the sum of the individual distances travelled between consecutive nodes along his or her picking route. The expected travel distance may therefore be found if the probability of travelling the distance dtj between node i and node j is known for all i,j Є {1, ...,s}. The probability that a stock picker travels between respective slots is a direct result of the assignment of individual SKUs to specific slots. Let tij be the conditional probability that a stock picker travels from node i to node given that (s)he is currently at node i within a particular stock setup X. Now, suppose a stock picker is currently positioned at node i and is required to visit some node j next, which is positioned k steps later in the picking sequence defined by W. The probability of this occurring is the combined probability of the events of the stock picker first being required to visit node i, then not being required to visit (or skipping) the k - 1 intermediate node(s) i + 1,i + 2,...J - 1 (if applicable), and lastly, being required to visit node The probability of visiting the nth node in the pick sequence may be calculated by the dot product  . Care should, however, be taken to ignore a set of picker movements that are deemed impossible. If, for example, a stock picker is currently located at the mth node in the picking sequence W, (s)he will never travel k> 0 positions back to the (m - k)th node in the picking sequence. Likewise, a stock picker may also not remain at the same node where (s)he currently finds him/herself. Any node pair conforming to one of these cases may be assigned a conditional travel probability of ttj = 0. This set of impossible travel movements is encapsulated in an s χ s matrix EΔ, which contains as entry in row i and column j the value 1 if it is possible to travel from the ith node in the pick sequence to the jth node in the pick sequence, or a value of 0 if this is not possible. Given a set of SKU assignments defined by X, the probability that a stock picker travels from node i to node j during a picking assignment is therefore given by
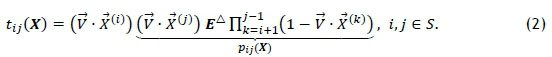
For the sake of simplicity, we adopt a Naive Bayes modelling approach, in that the event of visiting or skipping a particular slot is assumed to be independent of the event of visiting or skipping any other slot. The probability of a combined event is, therefore, merely the product of the probabilities of individual events. In this way, a conditional travel probability matrix T(X) may be constructed that contains the value ttj(X) as entry in row i and column The unconditional probability Pi¡(X) of transitioning from node i to node j is calculated in a similar fashion. The difference, however, is that the transition probability Pij(X) does not require the initial location of the stock picker at node i. The transition probability from node i to node j is then only the product of the probabilities of the events of the stock picker not being required to visit k - 1 intermediary node(s) (if applicable) and being required to visit node j directly after node i. In this way, a transition probability matrix P(X) may also be constructed, containing the value Pi¡(X), indicated in (2) above, as entry in row i and column j.
The total distance a stock picker is expected to travel during a picking order may be seen as the combined sum of probabilistically traversing each individual distance dijj- between nodes i and j. The travel probability matrix Τ contains the probabilities that a stock picker traverses each of these distances. The expected stock picker travel distance L(X), given a particular stock setup X, is therefore the sum of all the elements of the entrywise product D ° T(X), or

3.2 Modelling the level of congestion
The placement of high pick frequency SKUs in close proximity to one another leads to a higher level of local congestion [6]. Since there is no universal measure for such congestion, we characterise the level of congestion as being proportional to the expected numbers of stock pickers at a particular slot once a steady-state distribution of stock pickers has been reached within the DC. Each node within the discretisation of the DC section (as exemplified in Figure 3) may be modelled as an individual queuing system forming part of a larger closed queuing network. The nature of this queuing network is dictated by the stock setup and the picking sequence W employed. Within this queuing network, stock pickers transition between respective queues with specified probabilities. The network is closed because it contains a fixed number of customers who remain entirely within the network.
Suppose there are s queues (corresponding to nodes) in a stock setup X within this network; and recall that the probability that a stock picker transitions directly from node i to node j during the picking of an order is denoted by Pi¡(X). The mean number of visits e¡(X) (also known as the visit ratio) of a stock picker at the ;'-th node may be determined by solving the system of equations
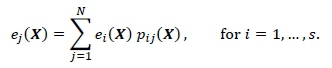
When solving this system of equations, the first step is to determine the network's so-called argument matrix Pa(X), which is calculated directly from the transition probabilities, as
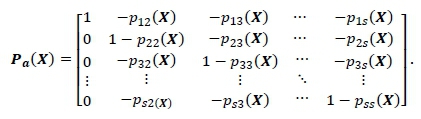
The visit ratios are given by the first row of the argument matrix's inverse [11].
The state of the queuing network is a specification of the number of pickers present at each node at a particular point in time. If ki pickers are present at node i at a particular instant, then the state of the network is denoted by (k1, ...,ks) at that time. Since the number of stock pickers within the queuing network remains constant, the number of possible states in which the stock pickers can be distributed among the slots is finite. For a network containing s slots and κ stock pickers, the total number of possible network states of the form (k1, ...,ks) is given by the binomial coefficient
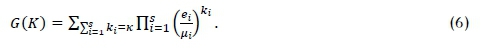
Arguably, the fundamental problem of queuing theory is the determination of the steady-state probability ∏(k1,...,ks) for each of the possible states (k1,...,fcs) of the network. Once calculated, the mean values of all other important performance measures of the network may be determined from these values. In this case, the steady-state distribution of the number of stock pickers in the network may be calculated by invoking the Gordon-Newell theorem [25] as

where G(K) is a normalisation constant governed by the condition that all steady-state probabilities should sum up to one, and μiis the service rate of the queue experienced at node i. The entire state space must be enumerated in order to determine the normalisation constant as
The service rate μiin (3)-(4) may be expressed as

where gi denotes the average pick quantity of SKUs stored in slot i, and where δ denotes the average time it takes a stock picker to pick a single SKU.
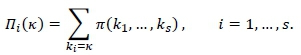
The marginal probability nt(k) that slot i contains exactly kt = k stock pickers once a steady-state has been reached may be found by calculating the sum of the number of stock pickers in each state multiplied by its respective steady state probability. That is,
The mean number of stock pickers at each slot is therefore given by
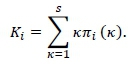
This allows for the construction of a column vector Κ = [K1,K2,...,Ks]T, which contains the distribution of the expected number of stock pickers for each SKU (such that  ). This result gives an indication of how busy each node is likely to be within the DC section if SKUs are assigned to slots according to the matrix.
The dot product  represents the expected number of stock pickers present at slot i after a steady-state has been reached. The quantity
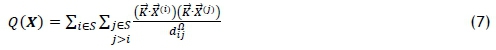
may therefore be defined to represent the level of congestion associated with a stock setup , where Ω is called the penalty exponent. Notice that, if the quantities  and
and  are relatively large and the distance
  is relatively small, Q(X) will be large, and vice versa. The value of the penalty exponent Ω may be specified by the decision-maker. A large value of Ω would, in effect, penalise SKUs with large queues positioned close to one another by inflating the severity of these placements. The summation of all the individual congestion effects between each of the respective slot-SKU pairs results in an overall measure of the expected level of congestion associated with the particular stock setup X.
3.3 Mathematical model formulation
In view of the discussion in §3.1 and §3.2, a good placement of q ≤ s - 2 SKUs is one that achieves a suitable trade-off between
minimising L(X) (8)
and
minimising Q(X), (9)
subject to the constraints
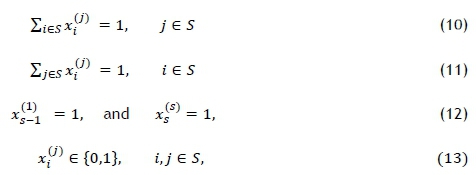
where L(X) and Q(X) are defined in (3) and (7) respectively. Constraint set (10) ensures that exactly one SKU is assigned to node e 5, while constraint set (11) ensures that SKU i e 5 is assigned exactly one node. Constraint set (12) ensures, furthermore, that the start and end nodes are visited first and last respectively. Finally, constraint set (13) ensures the binary nature of the decision variables in X. Since the objectives (8) and (9) are conflicting, there is no single optimal solution to the model (8)-(13). Instead, there may be multiple trade-off solutions to the model that may all be considered optimal. A summary of the nomenclature of the model may be found in Table 1.
A decision matrix  satisfying these constraints is called a feasible solution to (8)-(13), where
is defined in (1) for all η = 1, ...,s. Such a feasible solution X is said to dominate another feasible solution X' if the inequalities L(X) < L(X') and Q(X) < Q(X') are satisfied, and at least one of the inequalities L(X) ≤ L(X') or Q(X) ≤ Q(X') also holds. If there is no feasible solution to (8)-(13) that dominates a particular feasible solution X, then X is said to be Pareto-optimal [11]. The set of all Pareto-optimal solutions in decision space forms the Pareto-front of (8)-(13) in the two-dimensional objective function space.
3.4 Approximate model solution by simulated annealing
The brute-force computational complexity associated with optimally assigning η distinguishable SKUs to η distinguishable slots is 0(n\). Consequently, finding the full set of Pareto-optimal solutions to a realistically-sized problem instance through a brute-force search of the decision space of the model (8)-(13) is not computationally feasible. Various (meta)heuristic solution methodologies may instead be considered in order to determine a high-quality, but not necessarily truly Pareto-optimal, set of trade-off solutions to this problem within a reasonable time frame. Of these methods, the probabilistic technique of simulated annealing (SA) was selected for use in this paper due to its relative simplicity, ease of implementation, and general effectiveness over a wide range of problems. A complete description of the working of single-objective SA is provided by Kirkpartick et al. [26], while the extensions required in a multi-objective context are described by Smith et al. [27]. We applied the energy difference method of Smith et al. [28] when archiving non-dominated solutions to (8)-(13). An initial temperature was selected according to the average increase method proposed by Busetti [29], for use in conjunction with a geometric cooling schedule. Neighbouring solutions were generated by means of a swap operator that exchanges two random SKUs in the stock setup X while keeping the locations of the remaining SKUs unchanged. We used the criteria proposed by Dreo et al. [30] to conclude an SA search epoch. Finally, the SA algorithm was terminated when three successive epochs had elapsed without the acceptance of a new, non-dominated solution to (8)-(13).
4 DECISION SUPPORT SYSTEM
In this section, the development and implementation of a computerised DSS is described that employs the mathematical framework of §3 to determine high-quality SKU placements. The section opens in §4.1 with an overview of the graphical user interface (GUI) of the DSS. A small hypothetical test case is considered in §4.2 for the purpose of verifying and validating the results returned by the DSS.
4.1 Graphical user interface
The primary focus of the DSS's GUI design is to enable a non-mathematically inclined user easily to configure each of the required model inputs, thereby facilitating use of the mathematical model framework developed in §3. This is accomplished by separate tabs created within the user interface, each of which assists the user in completing a series of pre-processing steps. The following four steps must be performed sequentially by the user before a viable SKU placement recommendation can be made by the DSS:
1. In the Layout Editor tab, the user is first required to build a discretised representation of the DC section under consideration, as illustrated in Figure 4. The user must refer to an existing floor plan of the DC section under consideration, and replicate the schematic on the interface's grid canvas. This may be achieved by inserting a boundary (indicated by dark gray cells), a roadway (indicated by light gray cells), or a pick slot (indicated by yellow, orange, and brown cells) corresponding to the three radio buttons on the left-hand side of the window. Once the DC layout has thus been built, the user is required to input the cell coordinate positions corresponding to the picking order start and end points; this updates the appropriate cell to green or red respectively.
2. In the SKU Data tab, the user imports a CSV file containing the required data for each of the SKUs to be assigned to the available slots. These data include the item code, total visit frequency, and total quantity picked in the past for each SKU under consideration. The successfully imported SKU data are then displayed to the user as confirmation.
3. In the Sequence tab, two options are available to the user: either the user provides his or her preferred static picking sequence, or the user executes a function to solve for an efficient static picking sequence. As described in §3.1, a standard TSP model is adopted to determine the shortest route that a stock picker would have to travel when starting and ending his or her picking assignment at the defined starting and ending cells, and visiting every slot in the DC section.
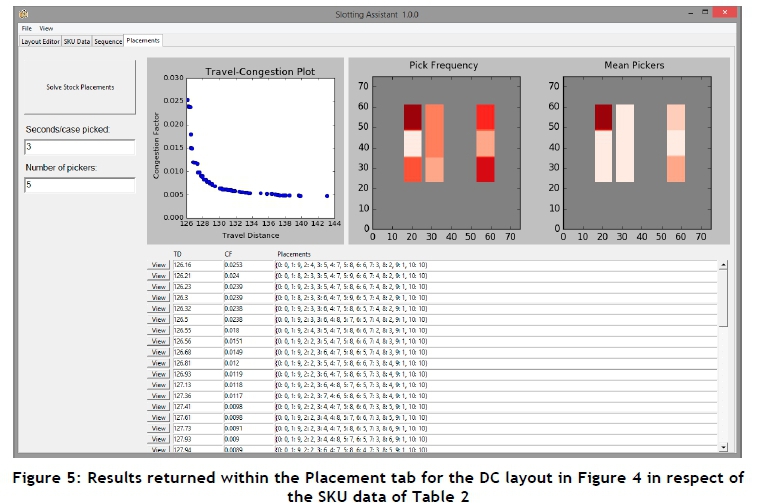
4. In the Placement tab, the user is first required to input two model parameters - namely, the amount of time required to pick a single SKU case in sec/case (i.e., the quantity δ) and the number of stock pickers assigned to the DC section (i.e., the quantity κ), as may be seen in Figure 5. The user may request stock setup recommendations by clicking the Solve Stock Placement button. During the execution of the algorithm launched for this purpose, all GUI features are unavailable until the completion of the SKU-to-slot assignment computation. Upon completion, the user is presented with three pieces of information: a plot in objective function space of the trade-off solutions found by the Sa algorithm, a list of corresponding stock setups, and two heat maps corresponding to selected stock setups from the list. A travel-congestion plot illustrates the trade-off between the set of non-dominated stock setup solutions with respect to the expected stock picker travel distance and the associated congestion factor. Each solution is presented to the user in a list format in ascending order of expected travel distance, together with the respective congestion factor and stock placements. In order to make an informed decision, the user may click the View button corresponding to a solution, which prompts the creation of two heat maps. The first heat map, labelled Visit Probability, illustrates the probability that a slot containing a particular SKU is visited (i.e., the quantity vt for SKU i) where a dark colour indicates a slot containing an SKU with a high probability of being picked. The second heat map, labelled Picker Distribution, illustrates the expected number of stock pickers who are likely to be at a particular slot at any point in time (i.e., the quantity K¿ for SKU t), where a dark colour indicates a slot that occupies a large proportion of the total number of stock pickers assigned to the DC section. This may assist the user in making an informed solution selection by taking into account the likely trade-off effects associated with a potential stock setup.
4.2 System verification and validation
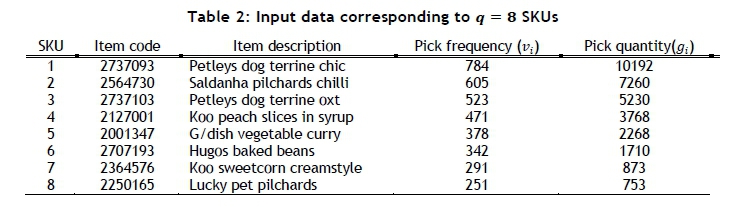
For the purpose of verifying and validating the DSS implementation, a hypothetical test case is considered. This test case is based on the small hypothetical DC section in Figure 4, which consists of s - 2 = 9 pick slots to which a total of q = 8 SKUs must be assigned. The data pertaining to each of the SKUs under consideration were derived by sampling real-world data from an industry partner so that similar SKU trends may be replicated on a smaller scale. These data are shown in Table 2, where 'pick frequency' indicates the number of slot visits pertaining to a specific SKU in a specified time frame, while 'pick quantity' indicates the total number of SKU cases picked in that time frame. Suppose a total of κ = 5 stock pickers have been confined to this DC section with a case picking time of 5 = 3 sec/case. A picking sequence was selected, according to which a stock picker starts an assignment by travelling up aisle B and returns down aisle A.
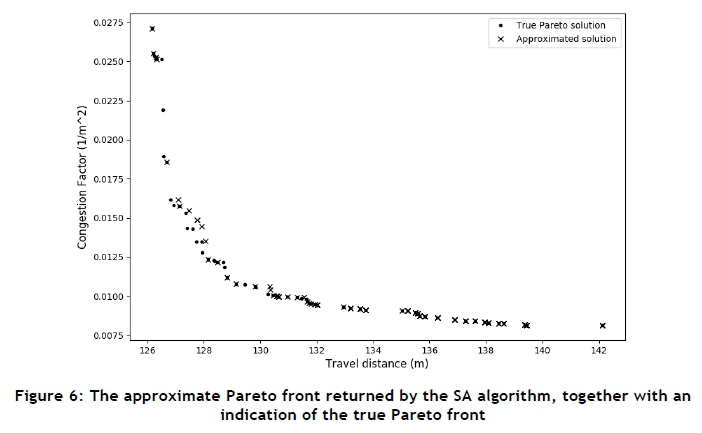
In order to evaluate the quality of the mathematical model solutions produced by the DSS, the non-dominated set of solutions obtained by the SA algorithm embedded within the DSS are shown in objective function space in Figure 6, together with all truly Pareto-optimal solutions (computed through a brute-force enumeration of all
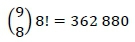
possible SKU placement decisions). As may be seen, the approximate Pareto front produced by the SA algorithm (indicated by crosses in the figure), coincides for the most part with the true Pareto front (indicated by dots). Upon further inspection, it was found that the SA algorithm was able to discover 40 of the 64 truly Pareto-optimal solutions. This result also illustrates the conflicting nature of the two SKU placements objectives.
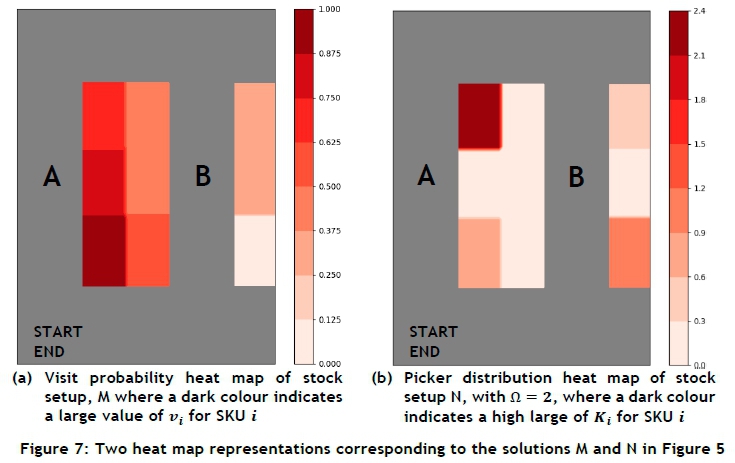
The DSS output is verified by examining the stock setups in solution space corresponding to the extremal solutions denoted by M and N in objective function space in Figure 6. The visit probability heat map associated with stock setup M in Figure 6 may be seen in Figure 7(a). The slot numbers (positioned in the top left-hand corner of each slot) in this case also represent the order in which slots must be visited, as defined by the picking sequence employed. As may be seen in the figure, SKUs with large probabilities of being picked are located in slots closest to the order starting and ending point, while SKUs with a smaller probability of being picked are located in slots furthest away from the order starting and ending point. A stock picker can, for the majority of picking orders, expect only to be required to pick SKUs in aisle A, skip aisle B altogether, and then progress directly to the order ending point. Overall, this stock setup serves as confirmation of the intuitive hypothesis that positioning frequently picked SKUs in close proximity to an order's starting and ending point results in a stock picker travelling a shorter expected distance. As previously explained, however, the problem with such a solution is the significant congestion caused by positioning all frequently picked SKUs in close proximity to one another.
This leads to the second consideration of investigating the nature of the stock setup that results in the smallest congestion factor. The picker distribution heat map corresponding to stock setup N in Figure 6 may be seen in Figure 7(b). An investigation into the effects of the penalty exponent Ω led to the conclusion that, for increasing values of Ω, SKUs requiring a significantly large proportion of available stock pickers are placed in slots furthest away from each other, thereby minimising the overall congestion factor, as intended.
5 A REALISTIC CASE STUDY
In this section, the results of a real-world case study, based on data pertaining to a section of a working retail DC, are reviewed in an attempt to demonstrate the practical workability and performance of the DSS proposed in §4. The section opens in §5.1 with a discussion of the data received from the industry partner, which comprises information about the DC section layout under consideration as well as the associated slot and SKU data. The slotting solutions recommended by the DSS are formally presented in §5.2, and are subsequently compared with the existing stock setup in the industry partner's DC.
5.1 Input data
A floor plan of a DC section was obtained from an industry partner. The section consists of 297 slots arranged in eight aisles (HA-HI). A total of 284 SKUs are confined to this section, and the pick frequencies and pick quantities of these SKUs were obtained for these SKUs. The DC section in question is also fitted with specialised pick slots (called roller-racking) that may hold more than one pallet of stock and, as a result, are typically reserved for fast-moving or promotional goods. These slots are located between aisle pairs HA-HE, HB-HC, and HC-HD. Consequently, the industry partner is not willing to re-allocate any SKUs currently stored in these respective slots. The industry partner was also not willing to change its current picking sequence, given the significant amount of administration required to undertake such a task. A total of κ = 5 stock pickers are dedicated to this DC section, each with a case picking time of approximately 5 = 3 sec/case.
5.2 Stock placement suggestions and evaluation
Using the floor plan provided by the industry partner, a grid representation of the aforementioned section of the industry partner's DC was constructed. After having imported the relevant SKU data into the DSS, the distance matrix D was populated. Due to matrix symmetry, it was only necessary to compute the upper triangular part of the distance matrix. Furthermore, since the industry partner was not willing to change its current picking sequence, the matrix W was populated according to the industry partner's preferred picking sequence. At this point, a total of 26 SKUs were also manually constrained to the roller-racking pick slots, as required by the industry partner. A penalty exponent of Ω = 2 was selected in order to ensure that a significant penalty is incurred when popular SKUs are placed in close proximity to one another.
Due to the significant amount of computation time required to calculate approximately 1012 possible network states (as per equation (4)), a subset of 42 SKUs with the highest average quantity picked per slot visit (i.e., the quantity gtfor SKU t) were considered for the purpose of congestion quantification. As a result, all other SKUs were assumed to have a negligible effect on congestion in the DC section. This is a reasonable assumption, since it was found that, for any stock setup X, the low pick frequency SKUs make a negligible contribution to the measure Q(X).
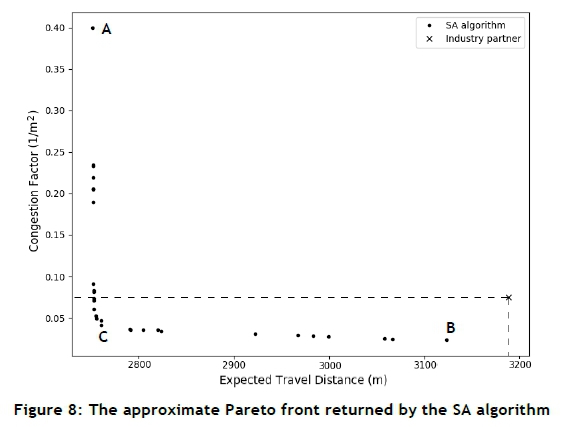
An approximate Pareto front obtained after nine single starts of the SA algorithm is shown in Figure 8. For the purpose of assessing the quality of the stock setup recommendations provided by the DSS, a comparison was made of the relative performance of these recommendations and that of the current setup employed at the retail DC. The current stock setup of the industry partner was evaluated according to the two model objectives of expected stock picker travel distance and aisle congestion. As may be seen in Figure 8, the industry partner's stock setup is dominated by 19 solutions recommended by the DSS (the solutions within the dashed box portion of the figure). The industry partner may, therefore, select any one of these proposed stock setups for a likely reduction in the expected time a stock picker spends travelling when consolidating an order as well as a reduction in the level of congestion the stock picker is likely to experience. A recommendation to the industry partner in this respect may take the form of the stock setup corresponding to the point labelled C in Figure 8, as this stock setup results in a 13.69 per cent reduction in stock picker travel distance and a marginal reduction in the level of congestion experienced by a stock picker.
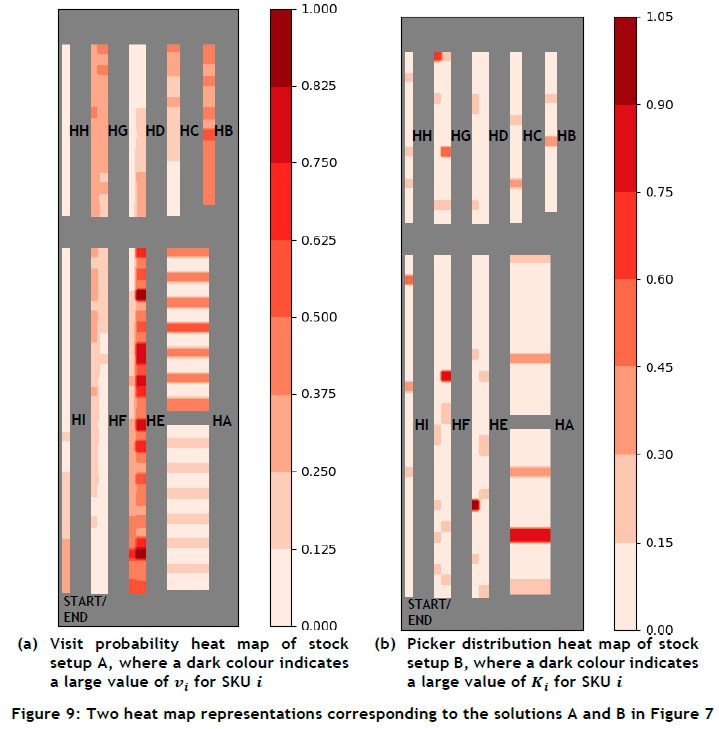
The visit probability heat map for the stock setup labelled A in Figure 8 is shown in Figure 9(a). When minimising the expected stock picker travel distance, high pick frequency SKUs are placed close to the roller-racking (specifically, in aisle HE). The reason for these placements is that significantly high pick frequency SKUs were initially constrained to the roller-racking between aisle pairs HA-HE, HB-HC, and HC-Hd. As a result, there is a high probability of a stock picker visiting these aisles in a typical assignment. It is therefore wise to position all other high pick frequency SKUs near the roller-racking and as close to the defined start and end point as possible, since a stock picker may thus easily retrieve numerous other SKUs that are likely to be in his or her picking order.
The picker distribution heat map for the stock setup labelled B in Figure 8 is shown in Figure 9(b). As with the hypothetical test case, SKUs requiring a relatively large proportion of the available stock pickers are placed in slots furthest away from each other when minimising the congestion factor, thereby reducing congestion. As a result, popular SKUs are also placed further from the section's start/end point (specifically, in aisles HD, HG, and HH), leading to a longer expected stock picker travel distance.
6 CONCLUSION AND FURTHER WORK
The specific focus of this paper was on the efficient placement of stock in a DC making use of manual stock picking operations. Although this consolidation method is still widely used and applicable in many retail DCs, the significant advancements in automated storage and retrieval systems tend to result in the partial replacement nowadays of the human stock picking element by computer-controlled systems. These computer-controlled systems achieve significantly higher throughputs than manual stock picking operations, and alleviate the occurrence of picking errors [31]. On the other hand, the costs associated with the implementation of such sophisticated computer-controlled systems are significant [32], and would typically require a complete redesign of an existing DC layout if such a system were to be implemented. As a result, companies focusing on cost-effective operations often still opt for a manual storage and consolidation process.
During a preliminary analysis of a hypothetical test case, the computation time associated with the construction of the required distance matrix D was deemed satisfactory. The iterative application of the A* pathfinding algorithm, however, proved to be very time-consuming in the large-scale case study. Dijkstra's well-known algorithm [23] may be a better candidate for this purpose, due to its ability to analyse the traversable distances between multiple sets of nodes in a single iteration, as opposed to only one distance between a particular node pair at a time.
The swap move operator used in the SA algorithm was a simplified approach to determining neighbouring solutions. This method proved effective for the purpose of determining a feasible stock setup, but was very time-consuming in determining a feasible solution to the TSP formulation when attempting to construct an efficient picking sequence for large problem instances. This problem may be alleviated by the application of constructive TSP heuristics, such as the nearest neighbour algorithm [33] or Christofides' algorithm [34], or by an investigation into iterative improvement heuristics, such as the pairwise exchange (2-opt) technique of Lin and Kernighan [35] or the more advanced variable-opt heuristic [35].
Due to its relative simplicity and effectiveness over a wide range of problems, the SA metaheuristic was selected as an approximate solution methodology in this paper. The search performance of the SA algorithm may be improved, however, by considering the incorporation of alternative cooling schedules, such as multiplicative/additive monotonic cooling or non-monotonic adaptive cooling [26, 36, 37]. There are also many other mataheuristics in the literature, such as the method of tabu search [38], genetic algorithms [39], and particle swarm optimisation [40], to name a few. As a result, a comparison may be performed between the individual performances of these algorithms in the context of the problem considered in this project, so as potentially to improve upon the quality of the solution presented to the user.
For simplification purposes, only the case where a DC section consists of pick slots located on one rack shelving level was considered in this paper. In reality, however, DC layouts may contain pick slots with multiple shelving levels in which SKUs may be placed. Furthermore, the problem considered in this paper only involved the case where one order start and end point can be defined. Again, there may be multiple points in the DC where a stock picker may start and end the fulfilment of his or her order. To incorporate these concerns would require further modifications of the mathematical framework and DSS architecture presented in this paper.
As stated in the introductory section, the travel distances and levels of congestion experienced by stock pickers are among the most popular criteria considered when determining feasible stock setups. There are, however, other considerations that DC managements may like to incorporate when formulating a slotting strategy. For example, a DC management may also wish to reduce the likelihood of picking errors by placing similar SKUs further away from one another, or by assigning SKUs with large volumes to the largest slots in a DC section in order to minimise the number of pick slot replenishments. The DC manager may also require specific SKUs to be constrained to particular pick slots. These situations may be accommodated by appending further model objectives and/or constraints to the existing model framework proposed in this paper.
REFERENCES
[1] Frazelle, E., 2001. World-class warehousing and material handling, 1st ed. New York: McGraw Hill Professional, New York (NY). [ Links ]
[2] Roodbergen, K. J. and De Koster, R., 2000., Routing order pickers in a warehouse with a middle aisle, European Journal of Operations Research, 133(1), pp. 32-43. [ Links ]
[3] Thompkins, J. A., White, J. A., Bozer, Y. A. and Tanchoco, J. M., 2003. Facilities planning, 3rd ed. John Wiley & Sons, Hoboken, NJ: John Wiley & Sons. [ Links ]
[4] Barry, F. C. , 2016. Warehouse layout design principles. [Online]. Available: http://www.fcbco.com/blog/warehouse-layout-design-principles. [Accessed 18 February 2016]. [ Links ]
[5] Cruz-Domínguez, O. and Santos-Mayorga, R., 2016. Artificial intelligence applied to assigned merchandise location in retail sales systems. South African Journal of Industrial Engineering, 27(1), pp.112-124. [ Links ]
[6] Gue, K. R., Meller, R. D. and Skufca, J. D., 2006. The effects of pick density on order picking areas with narrow aisles. IIE Transactions, 38(10), pp. 859-868. [ Links ]
[7] Hagspihl, R. and Visagie, S.E., 2014. The number of pickers and stock-keeping unit arrangement on a unidirectional picking line. South African Journal of Industrial Engineering, 25(3), pp.169-183. [ Links ]
[8] Huber, C., 2011. Throughput analysis of manual order picking systems with congestion consideration. Karlsruhe: KIT Scientific Publishing, Karlsruhe. [ Links ]
[9] Karásek, J. H., 2013. An overview of warehouse optimization. International Journal of Advances in Telecommunications, Electrotechnics, Signals and Systems, 2(3), pp. 111-117. [ Links ]
[10] Khan, H. W., 1955. The Hungarian method for the assignment problem. Naval Research Logistics Quarterly, 2, pp. 83-97. [ Links ]
[11] Winston, W. L., 2004. Operations research: Applications and algorithms, 4th ed. Belmont: Brooks/Cole, Belmont. [ Links ]
[12] Markov, A. A., 1906. Extension of the law of large numbers to dependent quantities. Izvestiia Fiz.- Matem. Obsch. Kazan Univ., (2nd Ser), 15, pp. 135-156. [ Links ]
[13] Bolch, G., Greiner, S., De Meer, H. and Trivedi, K. S., 2006. Queueing networks and Markov chains: Modeling and performance evaluation with computer science applications, 2nd ed. Hoboken (NJ): Wiley-Interscience, Hoboken (NJ). [ Links ]
[14] Scott, M., 2009. Optimisation of a single-aisle picking line. Hons BSc year project, Stellenbosch University, Stellenbosch. [ Links ]
[15] De Koster, R., Le-Duc, T. and Roodbergen, K.J., 2007. Design and control of warehouse order picking: A literature review. European Journal of Operational Research, 182(2), pp. 481-501. [ Links ]
[16] Heskett, J. L., 1963. Cube-per-order index - A key to warehouse stock location, Transportation and Distribution Management, 3(1), pp. 27-31. [ Links ]
[17] Bartholdi, J. J. and Hackman, S. T., 2011. Warehouse & distribution science, (unpublished manuscript), Atlanta (GA). [ Links ]
[18] Woe, J., ABC-analysis | Everything about logistics. 2010. [Online]. Available: https://johanneswoe.wordpress.com/2010/05/23/abc-analysis/. [Accessed 29 March 2016]. [ Links ]
[19] Kasten Storage., 2016. Warehousing, storage, archiving and logistics solutions. [Online]. Available: http://www.kasten-storage.com/Products/Storage-Machines-and-WMS/WarehouseInt-Systems-WIS/. [Accessed 22 March 2016]. [ Links ]
[20] Heragu, S. S., 2016. Facilities dDesign, 4th ed. CRC Press, Boca Raton (FL): CRC Press. [ Links ]
[21] Bourg, D. M. and Seemann, G., 2004. AI for game developers. O'Reilly, Sebastopol (CA): O'Reilly. [ Links ]
[22] Wenderlich, R., 2011. Introduction to A* pathfinding. [Online]. Available: https://www.raywenderlich.com/4946/introduction-to-a-pathfinding. [Accessed 10 April 2017]. [ Links ]
[23] Dijkstra, E. W., 1959. A note on two problems in connexion with graphs. Numerische Mathematik, 1, pp. 269-271. [ Links ]
[24] Cormen, T. H., Leiserson, C. E., Rivest, R. E. and Stein, C., 1990. Introduction to algorithms, 3rd ed. MIT Press and McGraw-Hill, Cambridge (MA): MIT Press and McGraw-Hill. [ Links ]
[25] Gordon, W. J. and Newell, G. F., 1967. Closed queuing systems with exponential servers. Operations Research, vol. 15, pp. 254-265. [ Links ]
[26] Kirkpatrick, S., Gelatt, C. D. and Vecchi, M. P., 1983. Optimization by simulated annealing. Science, 220(4598), pp. 671-680. [ Links ]
[27] Smith, K., Everson, R. M., Fieldsend, J. E., Murphy, C. and Misra, R., 2008. Dominance-based multiobjective simulated annealing, IEEE Transactions on Evolutionary Computation, 12(3), pp. 323-342. [ Links ]
[28] Smith, K., Everson, R. M. and Fieldsend, J. E., 2004. Dominance measures for multi-objective simulated annealing, Congress on Evolutionary Computation, 23-30. [ Links ]
[29] Busetti, F., 2003. Simulated annealing overview. [Online]. Available: http://www.cs.ubbcluj.ro/~csatol/mestint/pdfs/BusettiAnnealing Intro.pdf. [Accessed 12 September 2016]. [ Links ]
[30] Dreo, J., Petrowski, A., Siarry, P. and Taillard, E., 2006. Metaheuristics for hard optimization - Methods and case studies. , Berlin: Springer-Verlag., Berlin. [ Links ]
[31] Forgert, G., 1991. How Ford cuts orderpicking cycles by 60% with centralized storage. Modern Material Handling, 46, pp. 52-54. [ Links ]
[32] Zollinger, H., 1999. AS/RS application, benefits and justification in comparison to other storage methods: A white paper. Houghton, MI: Automated storage retrieval systems production section of the material handling industry of America. Houghton, MI. [ Links ]
[33] Lawler, E. L., Lenstra, J. K., Rinnooy Kan, A. H. G. and Shmoys, D. B., 1985. The traveling salesman problem: A guided tour of combinatorial optimization. Wiley and Sons, Chichester: Wiley and Sons. [ Links ]
[34] Christofides, N., 1976. Worst-case analysis of a new heuristic for the travelling salesman problem. Report 388, Graduate School of Industrial Administration, Carnegie Mellon University. Pittsburgh (PA). [ Links ]
[35] Lin, S. and Kernighan, B. W., 1973. An effective heuristic algorithm for the traveling-salesman problem. Operations Research, 21(2), pp. 498-516. [ Links ]
[36] Locatelli, M., 2000. Simulated annealing algorithms for continuous global optimization: Convergence conditions,." Journal of Optimization Theory and Application, 104(1), pp. 121-133. [ Links ]
[37] Luke, B. T. , 2007. Simulated annealing cooling schedules. [Online]. Available: http://www.btluke.com/simanf1.html. [Accessed 23 October 2016]. [ Links ]
[38] Glover, F., 1986. Future paths for integer programming and links to artificial intelligence. Computers and Operations Research, 13(5), pp. 533-549. [ Links ]
[39] Holland, J. H. 1975, Adaptation in natural and artificial systems. Ann Arbor (MI): The University of Michigan Press, Ann Arbor (MI). [ Links ]
[40] Kennedy, J. and Eberhart, R., 1995. Particle swarm optimization, Proceedings of the IEEE International Conference on Neural Networks,. Washington, pp 1942-1948. [ Links ]
Submitted by authors 23 Jul 2017
Accepted for publication 31 Jul 2018
Available online 31 Aug 2018
# This is an extended version of a paper presented at the 46 th annual conference of the Operations Research Society of South Africa (ORSSA) held from 10-13 September 2017 in Central Drakensberg, South Africa
* Corresponding author vuuren@sun.ac.za

