


Serviços Personalizados
Artigo
 Inglês (pdf)
 Artigo em XML
 Referências do artigo
Indicadores

Links relacionados
-
 Citado por Google
 -
 Similares em Google
Compartilhar

 Permalink
South African Journal of Industrial Engineering
versão On-line ISSN 2224-7890
versão impressa ISSN 1012-277X
S. Afr. J. Ind. Eng. vol.29 no.2 Pretoria Ago. 2018
http://dx.doi.org/10.7166/29-2-1813
GENERAL ARTICLE
An intelligent RTP-based household electricity scheduling with a genetic algorithm in a smart grid
B.-Y. KimI, II; H. SeokI, * ; Y. KangI
IDepartment of Industrial Engineering, Hongik University, Seoul, Republic of Korea
IIFAB4 Group, Samsung electronics, Republic of Korea
ABSTRACT
Electricity scheduling for households based on real-time pricing (RTP) allows flexible and efficient consumption planning. However, this creates errors in predicted costs. Therefore this study used a genetic algorithm (GA) to reduce the error in predicted costs and suggested a model that offered better consumption planning. This model comprises a provider that supplies electricity and a subscriber that consumes electricity. Each subscriber has an energy management controller (EMC) that selects the optimal electricity scheduling. The provider and subscriber exchange real-time predicted costs and consumption plans to achieve an appropriate balance. During this process, the aforementioned prediction error - i.e., the difference between the predicted cost for each time slot and the final actual cost - occurs. This was addressed in this study using a GA. As a result, the presented model produced consumption plans with costs that were 22.60 per cent lower than the non-scheduled case, and 3.34 per cent lower than the model from a previous study. Furthermore, the fairness for each subscriber was improved by 15.96 per cent compared with the non-scheduled case, and by 0.62 per cent compared with the previous study model.
OPSOMMING
Die skedulering van elektrisiteit vir huishoudings op grond van reële-tyd pryse lei tot buigsame en doeltreffende beplanning. Dit lei egter tot foute in vooruitgeskatte kostes. Hierdie studie gebruik 'n genetiese algoritme om die fout in die vooruitgeskatte kostes te verminder en stel n model voor met verbeterde verbruiksbeplanning. Hierdie model bestaan uit n elektrisiteitsverskaffer en n eindverbruiker. Elke eindverbruiker het n energiebestuurbeheerder wat die optimale elektrisiteitskedule kies. Die verskaffer en verbruiker ruil reële-tyd vooruitgeskatte kostes en verbruiksplanne om n gepaste balans te vind. Gedurende hierdie proses is daar egter n voorspellingsfout, dit is die verskil tussen die vooruitgeskatte koste vir elke tydgleuf en die werklike finale koste. Dit is deur die genetiese algoritme aangespreek. Die resultaat toon dat die kostes 22.6% laer is as die ongeskeduleerde geval en 3.34% laer as n vorige studie. Verder is die regverdigheid vir elke verbruiker met 15.96% verhoog in vergelyking met die ongeskeduleerde geval en 0.62% in vergelyking met 'n vorige studie.
1 INTRODUCTION
The recent implementation of a smart grid has allowed real-time monitoring of electricity consumption. Thus it is becoming possible for electricity pricing systems to determine costs based on real-time monitoring. Many households have begun using Internet of Things (IoT) products to help facilitate this monitoring process. In order to prepare for increasing electricity consumption, providers depend on the demand response (DR) program to decentralise subscribers from peak usage times [1].
Real-time pricing (RTP) is considered to be an effective way to use DR [2, 3, 4]. Providers use RTP to report predicted electricity costs 15 minutes ahead of time. The recent technological development of smart meters has increased reliability and security, and consequently allowed information exchange between providers and subscribers. Subscribers rely on energy management controllers (EMCs) to find the appropriate balance between electricity cost and subscriber preference.
Most previous studies on optimising electricity cost used the day-ahead method - which applies the actual electricity cost from the day before to the next day - or suggested smart RTP-based power scheduling using the Stackelberg game model [5, 6, 7]. However, these studies have shortcomings: either the delay costs arising from subscribers delaying usage times were not considered, or the problems arising due to discrepancies created between subscriber-expected prediction costs and post-determined actual costs in the midst of finding the appropriate balance were not considered. This could create problems in scheduling when subscribers chose and moved to the most cost-efficient times; subscribers ahead of the peak time would not be able to predict the changes due to the delay time caused by subscribers after the peak time, and this could result in financial loss.
This study therefore aimed to predict electricity consumption cost for every 10 minutes using a genetic algorithm (GA). It also aimed to minimise the error costs with which subscribers must cope as a result of prediction errors and delay costs. Electricity cost data obtained from the prior 10 weeks was used to predict future costs1. The appropriate weights between these predicted costs and real-time predicted costs were then calculated and used to reduce cost errors.
2 PREVIOUS STUDIES
To deal with the risk of price volatility and to manage supply and demand, a day-ahead optimisation has frequently been discussed in power grids [8]. Under the day-ahead pricing scheme, the electricity unit price in each time slot is set by the supply-side in the day-ahead market clearing process [9]. Based on such a predetermined price, a centralised decision-making unit (a sort of headquarters) decides an optimal consumption scheduling of subscribers and of the corresponding planned supply. In this condition, subscribers follow the schedule strictly, regardless of the actual condition.
Various studies have sought to find suitable profits for providers while further reducing costs for subscribers - in particular, by predicting electricity consumption and cost. Garcia, Contreras, Van Akkeren, and Garcia [9] predicted electricity costs for the next day by applying predicted costs from the previous day to the generalised autoregressive conditional heteroskedastic (GARCH) method. For short-term predictions, Szkuta, Sanabria, and Dillon [10] used the artificial neural network (ANN) method to suggest a prediction method using a developed model based on previous data. Contreras, Espinola, Nogales and Conejo [11] used the auto-regressive integrated moving average (ARIMA) method that was based on past-time series data to suggest a method that predicted electricity costs for the next day. Wang, Chen and Yang [12] used a semi-parametric regression approach to forecast electricity consumption in China, but this is inappropriate for short-term scheduling.
For more flexible demand management, Chen, Kishore and Snyder [5] aimed to predict costs by sharing costs in real-time in a distributed manner that also allowed subscribers to move to minimal-pricing times in real-time, thus subsequently minimising the overall costs. A cost scheduling model based on real-time pricing (RTP) was used, and a model was suggested that described the movement of subscribers moving to minimal-pricing times in real-time.
2.1 Shortcomings of previous studies
Previous studies predicted electricity costs using prediction methods such as GARCH and ARIMA, based on RTP and day-ahead models [5, 9, 10, 11].
However, [9] had limitations because peak times were moving towards neighbouring times, based on the peak times reported from the day before. There are also significant shortcomings in such a mechanism [9, 13, 14]: the computational complexity of a centralised decision-making unit significantly increases as the number of subscribers increases; it is risky to hand over subscribers' private information to a centralised unit; and it is unreasonable for each subscriber strictly to follow the given consumption schedule, even though unpredicted consumption/price fluctuations can occur in practice. We have thus considered a distributed decision-making model reflecting both the subscriber's and the service provider's perspectives.
The model of [10] did not select delay costs, so the impact that subscribers experienced from the delay was not considered. The model of [5] had prediction errors because there were discrepancies between the costs resulting from subscribers moving usage times and the actual future costs. This created problems for subscribers who had first delayed using appliances. In addition, this error increased with an increase in the number of subscribers using appliances before noon.
The current study suggested a method that reduced the differences between the actual and the predicted costs, together with a pricing policy strategy to reduce maximum electricity consumption - especially in a distributed manner. The suggested method minimises the cost prediction error made by the RTP-based scheduling model based on a GA to predict real-time electricity costs.
3 MODEL
Based on Stackelberg game theory [5], this study used a GA in order to allow subscribers to save costs through more accurate predictions, while achieving an appropriate balance between subscriber cost and provider profit. GA is a method of problem-solving based on natural selection, and can be used as a predicting method [8, 15].
Notation
i subscriber (t = 1,..., n)
t time slot (1t = 10 min, t =1,..., T)
k household appliance (fc = 1-3, dishwasher, clothes dryer, washing machine) likappliance usage time cikelectricity consumption
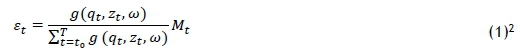
qt predicted electricity consumption for time slot t ztactual electricity consumption for time slot t ω coefficient of the service provider ε£ price gap in time slot t
φ ι wholesale price
π£ retail price

a coefficient of wholesale cost
β coefficient of real price
 unit penalty cost of appliance k
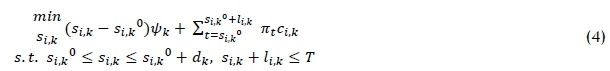
dk maximum delay time of appliance k
si,k° initial start time of subscriber i's appliance k
si,k start time of subscriber i's appliance k
 electricity consumption vector

The purpose of an EMC is to minimise subscriber cost. Thus sik*, which is the optimal time for subscribers to start using appliances, should be determined. Electricity costs can be reduced if appliance use is delayed to times of low pricing; however, a penalty cost,  occurs due to the inconvenience. The estimated value of dk, which is the maximum delayed time acceptable to subscribers, was therefore used. An EMC can schedule within 24 hours (T=144). The start time, si,k*, was calculated with Eq. (4) [5].
Service providers supply electricity to subscribers at the price of nt, which was assumed to be the sum of the wholesale price, φ ί , and the provider profit, st.

Providers received data on s, ci,k, and li,kfrom subscribers, and an electricity consumption vector, P, was created so that the actual consumption ztcould be updated in real time. The total profit of a provider was  and the net profit was calculated by subtracting the wholesale price and the mismatch cost3 from the total profit.
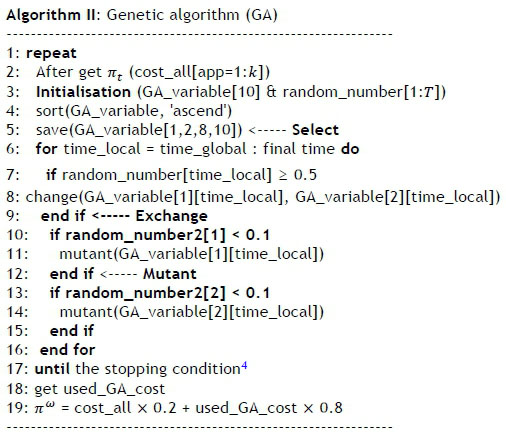
Each ω interacted with the stvalue and was selected by a provider. Depending on the updated ω, subscribers also update si?k*. This approach was used to find the equilibrium between s i,k* , when the cost for subscribers was at a minimum, and ω*, when provider profit was at a maximum [5]. Algorithm I represents the procedure of RTP-based consumption scheduling of subscribers, and Algorithm II is a GA to predict the real-time price on each time slot. We have used the backward induction with ω = [ω1, ...,(ωm ].

4 EXPERIMENT AND ANALYSIS
The experiment was coded in MATLAB. This study assumed that the daily electricity consumption was similar to that recorded for the corresponding days of the week during the previous 10-week period. Consequently, this study performed experiments using electricity costs generated on the same day of the week during the 10 weeks. Each 24-hour period was divided into 10-minute intervals and represented in rows, and the electricity cost for each week was represented in columns.
Parameter settings, described in Table 1, are as follows (referring to [5]). Eighty subscribers were selected for the experiment (η=80). It was assumed that each subscriber used three types of scheduled appliances (k =1,2,3: dishwasher, clothes dryer, and washing machine) that were controlled by EMCs. Furthermore, it was assumed that li,k followed an exponential distribution with an average of li,k, and the total time (T) was set from 7:00 AM to 7:00 AM the next day. The time was divided into 10-minute intervals. The appliances were used more frequently by subscribers between 5:00 AM and 8:00 PM, and so this interval included the peaks for electricity consumption.

4.1 Settings of genetic algorithm (GA)
The population for the GA comprised the electricity costs for the same day of the week from the previous 10 weeks. The size of a population is 10 for each time slot. We have referred to the default settings of GA in MATLAB. In short, the mask parameter during the crossover operation was randomly selected from values between 0 and 1; if the selected value was 0.5 or higher, it selected parent 1; and if the selected value was lower than 0.5, it selected parent 2. The mutation probability was set to five per cent for this process. With increasing iterations of the GA, all the solutions in the population continued to converge in real time to the cost value of each time slot. Ultimately, all solutions converged at the end of the one-day cycle. The computation time of GA is less than a minute. This is reasonable for a 10-minute RTP.
4.1.1 Select operation
Two parent solutions were selected from the population for the select operation. The difference between solutions from the population and the cost, Z, measured in real time, was chosen as the fitness. The better- and worse-fitting solutions were distinguished according to this difference, and eight better-fitting solutions (approximately the top 18 per cent of the population) were selected so that the algorithm could evolve toward better solutions.
4.1.2 Crossover operation
Crossover produces a new solution by partially crossing the genes of two fitter parent solutions. This study used uniform crossover, with a mask parameter of 1 to Τ random values. If the mask parameter is 0, it crosses two parent solutions of the time slot, but not when it is 1.

4.1.3 Mutation
Mutation was implemented in the process to produce new child solutions from the crossover. With mutation, the existing child solution became a random value, which helped the gene pool to converge toward better solutions.
4.2 Performance evaluation
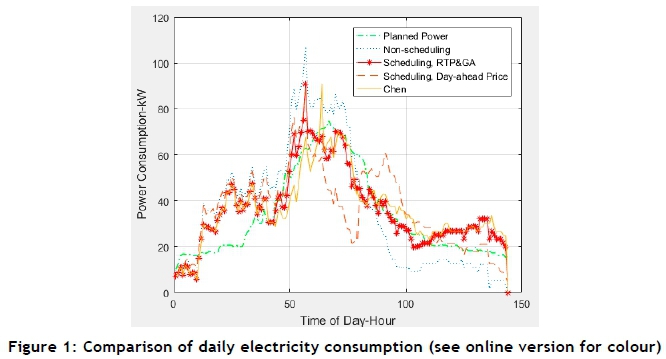
Figure 1 shows a comparison of the total electricity consumptions from RTP & GA-based scheduling, the Chen [5] model, and day-ahead scheduling5. The peak consumption was 107 kW for non-scheduling, 89.2 kW for day-ahead scheduling, 91 kW for Chen scheduling, and 90.8 kW for RTP & GA-based scheduling. The RTP & GA-based scheduling was similar to the planned power curve.
Figure 2 shows a comparison of the peak-to-average values that were obtained by dividing the maximum electricity consumption over the total time period by the overall average. The GA generated a peak-to-average value of 2.498, which improved the value by 17.84 per cent, compared with 2.943 when scheduling was not applied. The Chen model generated a peak-to-average value of 2.503, a 17.58 per cent improvement over non-scheduling. Furthermore, the GA slightly improved the values by 0.22 per cent compared with the Chen model.

Figure 3 is a graph comparing the sums of daily costs for 80 subscribers. Applying the GA generated a cost of $60.80, which was 22.60 per cent lower than the $74.55 generated when scheduling was not applied. The Chen model generated $62.84, which was 18.63 per cent lower than when scheduling was not applied. Furthermore, the GA improved the cost by 3.34 per cent compared with the Chen model.

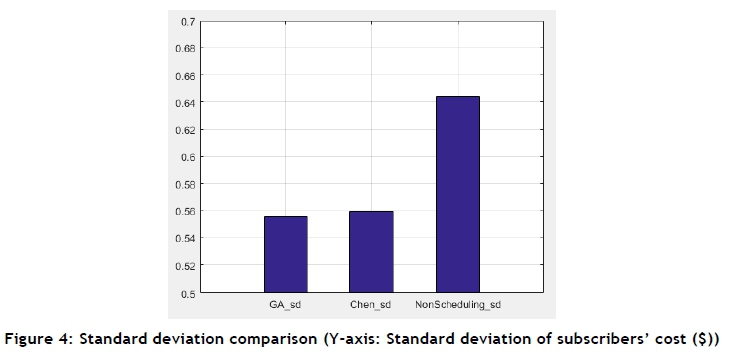
Figure 4 compares the standard deviations of the daily electricity costs of 80 subscribers. Applying the GA resulted in a standard deviation of 0.555. This was 15.96 per cent lower than the standard deviation of 0.644 when scheduling was not applied. The Chen model generated a standard deviation of 0.559, which was 15.24 per cent lower than when scheduling was not applied. Furthermore, the GA slightly improved the standard deviation by 0.62 per cent compared with the Chen model.
5 CONCLUSION AND FUTURE WORK
Controlling electricity consumption with an EMC using appliance scheduling based on real-time pricing creates a prediction error due to variations in future electricity consumption. In this study, a GA was used to decrease this prediction error; the results showed a 3.34 per cent reduction in electricity cost compared with the existing model.
Although this study aimed to reduce prediction error by using a GA - which was a problem in previous studies - the predictions still have limitations. Methods potentially exist to reduce errors more effectively. One way is to divide subscribers into groups according to electricity consumption, and then make predictions for each group. Another approach is to use an energy storage system (ESS) to save electricity beforehand, to reduce inconsistencies in prediction error. Such studies will be continued, and a seasonality effect will also be considered in the future.
ACKNOWLEDGEMENTS
This work was supported by the National Research Foundation of Korea (NRF), with a grant funded by the Korean government (MSIT) (No. 2016R1C1B1015974).
REFERENCES
[1] Berlink, H., Kagan, N. & Costa, A.H.R. 2015. Intelligent decision-making for smart home energy management. Journal of Intelligent & Robotic Systems, 80, p. 331. [ Links ]
[2] Goldman, C., Hopper, N., Sezgen, O., Moezzi, M., Bharvirkar, R., Neenan, B. & Pratt, D. 2004. Customer response to day-ahead wholesale market electricity prices: Case study of RTP program experience in New York. Lawrence Berkeley National Laboratory (LBNL), Berkeley, CA (United States). [ Links ]
[3] Mohsenian-Rad, A.H. & Leon-Garcia, A. 2010. Optimal residential load control with price prediction in real-time electricity pricing environments. IEEE Transactions on Smart Grid, 1(2), pp. 120-133. [ Links ]
[4] Samadi, P., Mohsenian-Rad, A.H., Schober, R., Wong, V.W. & Jatskevich, J. 2010. Optimal real-time pricing algorithm based on utility maximization for smart grid. In Smart Grid Communications (SmartGridComm), 2010 First IEEE International Conference on Smart Grid Communications, pp. 415-420. [ Links ]
[5] Chen, C., Kishore, S. & Snyder, L.V. 2011. An innovative RTP-based residential power scheduling scheme for smart grids. In 2011 IEEE International Conference on Acoustics, Speech and Signal Processing (ICASSP), pp. 5956-5959. [ Links ]
[6] Khodaei, A., Shahidehpour, M. & Choi, J. 2013. Optimal hourly scheduling of community-aggregated electricity consumption. Journal of Electrical Engineering and Technology, 8(6), pp. 1251-1260. [ Links ]
[7] Oh, E., Park, J.B. & Son, S.Y. 2014. Group building based power consumption scheduling for the electricity cost minimization with peak load reduction. Journal of Electrical Engineering & Technology, 9(6), pp. 1843-1850. [ Links ]
[8] Seo, Y-R., Yoon, S-Y., Jang, H-R. & Bahn, H. 2011. Power scheduling of smart building using genetic algorithms. Korean Institute of Information Scientists and Engineers 2011 fall workshop presentation file, The 38th Parallel, No.2 (B), 38(2B), pp. 331-334. [ Links ]
[9] Garcia, R.C., Contreras, J., Van Akkeren, M. & Garcia, J.B.C. 2005. A GARCH forecasting model to predict day-ahead electricity prices. IEEE Transactions on Power Systems, 20(2), pp. 867-874. [ Links ]
[10] Szkuta, B.R., Sanabria, L.A. & Dillon, T.S. 1999. Electricity price short-term forecasting using artificial neural networks. IEEE Transactions on Power Systems, 14(3), pp. 851-857. [ Links ]
[11] Contreras, J., Espinola, R., Nogales, F.J. & Conejo, A.J. 2003. ARIMA models to predict next-day electricity prices. IEEE Transactions on Power Systems, 18(3), 1014-1020. [ Links ]
[12] Wang, X., Chen, Z., and Yang, S. 2012. Forecasting modeling and simulation analysis of a power system in China, based on a class of semi-parametric regression approach. South African Journal of Industrial Engineering, 23(3), pp. 154-168. [ Links ]
[13] Chow, J.H., De Mello, R.W. & Cheung, K.W. 2005. Electricity market design: An integrated approach to reliability assurance. Proceedings of the IEEE, 93(11), pp. 1956-1969. [ Links ]
[14] Joe-Wong, C., Sen, S., Ha, S. & Chiang, M. 2012. Optimized day-ahead pricing for smart grids with device-specific scheduling flexibility. IEEE Journal on Selected Areas in Communications. 30(6), pp. 1075-1085. [ Links ]
[15] Guo, F., Peng, H. & Tang, J. 2016. Genetic algorithm-based parameter selection approach to single image defogging. Information Processing Letters, 116(10), pp. 595-602. [ Links ]
Submitted by authors 23 Jul 2017
Accepted for publication 31 Jul 2018
Available online 31 Aug 2018
* Corresponding author hseok@hongik.ac.kr
1 We have not considered seasonality in the study. The consumption pattern is assumed to be similar across 11 weeks.
2 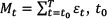 is current time slot.
3 Cost arising from discrepancies with predicted consumption.
4 If the derived value is more than twice the same as before, GA stops.
5 The service provider notifies the day-ahead price for each time slot, and subscribers reschedule the consumption based on that [2].

