


Serviços Personalizados
Artigo
 Inglês (pdf)
 Artigo em XML
 Referências do artigo
Indicadores

Links relacionados
-
 Citado por Google
 -
 Similares em Google
Compartilhar

 Permalink
South African Journal of Industrial Engineering
versão On-line ISSN 2224-7890
versão impressa ISSN 1012-277X
S. Afr. J. Ind. Eng. vol.29 no.1 Pretoria 2018
http://dx.doi.org/10.7166/29-1-1680
GENERAL ARTICLE
Client project time schedule controls - An empirically-based system dynamics conceptual model
A.M. Chitongo*, #; L. Pretorius
Department of Engineering and Technology Management, University of Pretoria, South Africa
ABSTRACT
Different project participants often have different objectives and expectations, and implement different controls aimed at advancing their interests. This article investigates project controls taken by the client during the project design stage to improve project time schedule performance. Dynamic hypotheses and a System Dynamics conceptual model of client controls and their ripple effects are formulated in this article from a combination of the existing literature, mental models of project managers gathered through an embedded multiple-case study, and Systems Thinking. The results suggest that client controls that are aimed at improving project time schedule performance generate ripple effects that worsen the performance.
OPSOMMING
Verskillende projekdeelnemers het dikwels verskillende doelwitte en verwagtings, en neem verskillende kontrole aksies wat daarop gemik is om hul belange te bevorder. Hierdie artikel ondersoek projekkontrole aksies wat die kliënt tydens die projek-ontwerpstadium geneem het om die tydskeduleprestasie van die projek te verbeter. Dinamiese hipoteses en 'n sisteem dinamika konseptuele model van kliëntkontroles en hul rippeleffekte word in hierdie artikel geformuleer uit 'n kombinasie van die bestaande literatuur, denkmodelle van kliënt projekbestuurders wat ingesamel is deur 'n geintegreerde meervoudige gevallestudie, en stelseldenke. Resultate dui daarop dat kliëntkontroles, wat daarop gemik is om die prestasie van die projek tydskedule te verbeter, rippeleffekte oplewer wat die prestasie verswak.
1 INTRODUCTION
The execution of engineering projects generally entails design and construction, as is evident from Parvan [1]. Project execution is the most challenging phase to manage in a project life cycle. Yet it is the most crucial, as its final output needs to be handed over to the client as a complete system, ready for the effective and efficient realisation of the intended project benefits. It also involves numerous interactions and interdependencies among a number of project stakeholders. Those project stakeholders who are actively involved in the execution of the project are, in this article, referred to as 'project participants', in line with Shen, Song, Hao and Tam [2]. According to Ngacho and Das [3] and Toor and Ogunlana [4], key participants during project execution include the client, the engineering consultant, and the contractor. This article focuses only on the design stage, where the key project participants are the client and the engineering consultant.
Different project participants have different objectives [5] and competing expectations [6] during project execution. They therefore tend to take different control actions to try to influence project execution so that it is in line with their interests, as highlighted by Lyneis and Ford [7], and Sutterfield, Friday-Stroud and Shivers-Blackwell [8]. However, the well-intentioned decisions and control actions ('project controls') of the project participants often generate some undesirable and unintended consequences (ripple and knock-on effects) that militate against the intended effects, as highlighted by Lyneis and Ford [7]. For instance, in a bid to try to bring a project that is behind schedule back on track, a project manager may decide to apply pressure on the workforce to work faster; however, this may increase errors ('haste makes waste'), leading to work having to be repeated, which increases project time schedule delay, according to Lyneis and Ford [7].
Thus project control (in particular, project time schedule control) is inherently characterised by dynamic complexities, as is evident in the research of Ford, Lyneis and Taylor [9], Nasirzadeh and Nojedehi [10], and Rodrigues and Williams [11]. For instance, there tend to be delays between the controls (decisions and actions) of one project participant, their effects (some of which are unintended and counterintuitive), and the responses (balancing or reinforcing feedbacks) of the other project participants; and there are often differences between short-run and long-run results; all of which are key characteristics of dynamic complexity, according to Sterman [12].
Solving system problems that involve dynamic complexity, such as project time schedule control, is not possible with the human mind alone; computer modelling and simulation (such as System Dynamics) is needed to support human decision-making and management policies, as highlighted by Forrester [13] and Sterman [12]. System Dynamics is thus used in this study to model the control actions taken by the client in an effort to protect project time schedule performance during the design part of project execution.
A review of the existing literature, highlighted in the next section, shows that many studies investigated and modelled (using System Dynamics) project time schedule controls taken by the engineering consultant or construction contractor. However, as is evident from the literature reviewed, project time schedule controls (and the System Dynamics modelling thereof) taken by the client, and their impact on project performance, remain largely under-researched. Accordingly, the objectives of this article are to investigate, from the existing literature and empirically, the controls taken by the client in a bid to protect project time schedule performance; any primary unintended consequences (ripple effects) of such controls; and how the client project time schedule controls and their ripple effects may be conceptually modelled using System Dynamics.
To achieve these objectives, this article proceeds with a critical but relevant review of the extant project performance, project controls, and System Dynamics literature. An account of the research methodology followed in this study ensues, followed by a presentation of the key empirical findings. Next, the empirical findings are discussed, with comparisons with the appropriate extant literature; and dynamic hypotheses and a System Dynamics conceptual model of the client project time schedule controls and associated ripple effects are formulated. Subsequently, conclusions are drawn, and some recommendations for further research are made.
2 LITERATURE REVIEW
2.1 Project performance measures
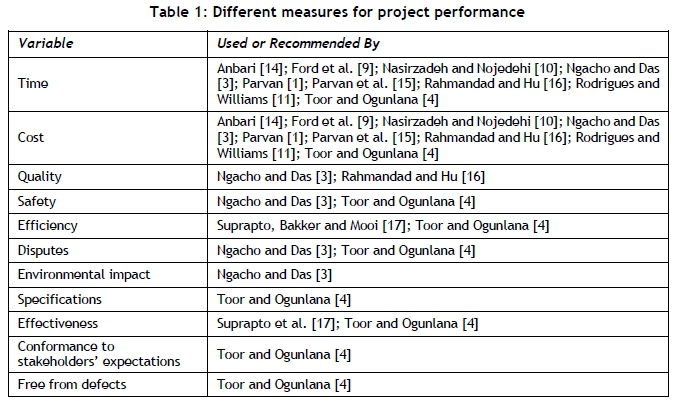
During project execution, the client is particularly interested in project performance and its associated measures, and sets targets and priorities accordingly. A review of some relevant extant project management literature shows different ways of measuring project performance. The number of key indicators used to measure project performance, in the literature reviewed, varies from two to nine. For instance, the Earned Value Method measures project performance using time schedule and cost, as highlighted by Anbari [14]. Other researchers who also measured project performance using only time schedule and cost include Nasirzadeh and Nojedehi [10], Parvan [1], and Parvan, Rahmandad and Haghani [15]. Some scholars, such as Rahmandad and Hu [16], used three key indicators (time schedule, cost and quality), the so-called 'Iron Triangle'. Ngacho and Das [3] found six key performance indicators for project performance: time; cost; quality; safety; site disputes; and environmental impact.
At the far end of the scale, Toor and Ogunlana [4] identified nine key indicators for project performance: on time; on cost budget; according to specifications; safety; efficiency; doing the right thing (effectiveness); free from defects; conformance to stakeholders' expectations; and minimised construction aggravation, disputes and conflicts. Table 1 summarises the different measures used or identified for project performance by the different scholars in the reviewed literature.
The use of different project performance measures by different researchers, as shown in Table 1, suggests little or no consensus in the reviewed literature on the manifest variables that must be used to measure project performance. Nonetheless, the focus of this study is to investigate the project controls taken by the client to protect project time schedule, as one key measure of project performance, during the design part of project execution.
2.2 Project controls and System Dynamics
Different project participants have different objectives [5] and competing expectations [6] during project execution. They therefore naturally tend to take different control actions to try to influence the project execution so that it is in line with their objectives and expectations, as indicated by Lyneis and Ford [7], and Sutterfield et al. [8]. Key project stakeholders during the design part of project execution include the client and the engineering consultant. Generally, both the client and the engineering consultant are interested in seeing the project perform well. As discussed in the preceding section, there are many key indicators that may be used to measure project performance; for instance, Rahmandad and Hu [16] used time schedule, cost budget, and quality. This article considers only project time schedule.
The existing project management literature is replete with discussions of control actions taken by the engineering consultant or construction contractor during project execution to ensure that a project is delivered within the planned time schedule. For instance, according to Ford et al. [9], a project manager may: add more people to the project workforce; make the project workforce work overtime; or make the project workforce work faster by applying pressure on them. Lyneis and Ford [7] discuss another System Dynamics project model with similar project time schedule controls. However, both the models of Ford et al. [9] and Lyneis and Ford [7] have one notable short-coming: only the management controls taken by the project manager (belonging to only one project participant) are included. It is not clearly stated to which project participant (client, engineering consultant, or contractor) this project manager belongs. However, considering that the client does not normally have direct control over the project workforce, it can be argued (and thus assumed in this article) that the project manager in the models of Ford et al. [9] and Lyneis and Ford [7] is that of the engineering consultant or construction contractor. Thus the models of Ford et al. [9] and Lyneis and Ford [7] exclude the client project time schedule controls (and associated ripple and knock-on effects); yet, arguably, they are key to project dynamics and project performance.
A more recent study by Nasirzadeh and Nojedehi [10] developed a System Dynamics simulation model of labour productivity in a construction project. Labour productivity was shown, through their model, to influence the work done and the subsequent total project cost and time duration [10]. Their model included two project control actions taken by the contractor's project manager: adding/reducing the workforce; and making the workforce work overtime [10]. However, their model does not include the management control actions (and associated ripple and knock-on effects) taken by other project participants, such as the client.
When a project is behind time schedule, the client basically has three options to take: extend the project time schedule deadline; take some control actions that aim to bring the project back on track; or both [11]. Consistent with previous studies, such as those of Lyneis and Ford [7] and Ford et al. [9], the current study is aimed at advancing project management effectiveness, and thus focuses on investigating the client control actions aimed at bringing a poorly-performing project back on time schedule.
Von Branconi and Loch [18] highlighted that when a project is delayed, the client may institute a 'liquidated damages penalty' against the construction contractor. However, they warn that the contractor often makes a trade-off analysis between the delay damages and the cost of accelerating the project, and may even decide to stop executing the project if the acceleration costs exceed the delay damages[18]. In System Dynamics terminology, this effectively suggests a primary undesirable and unintended effect (ripple effect) of the delay damages penalty. The study of Von Branconi and Loch [18], however, did not include any System Dynamics modelling and simulation to demonstrate the impact of schedule delay damages penalty (as a project time schedule control) on project completion, and a ripple effect on contractor productivity.
Earlier, Rodrigues and Williams [11] developed a System Dynamics model that indicated that poor project time schedule performance results in the client losing trust in the contractor and, subsequently, taking two control actions in a bid to try to bring the project back on time schedule: demanding more progress reports from the contractor; and not tolerating any delays in attaining project milestones. Their model further showed that such client controls (negative feedbacks) tend to generate some ripple effects; for instance, an increase in progress reports results in a decrease in productivity, and consequently a decrease in the project work completion rate and an increase in the project time schedule delay [11]. However, their study was not specific enough about how the intolerance in project milestone delays is manifested.
Zhu and Mostafavi [19] highlight that project complexity has two key dimensions: detail complexity (time-independent and arising from a large number of project variables); and dynamic complexity (time-dependent and arising from cause and effect relationships between the variables, which may be unclear and change with time). They emphasise the importance of understanding project dynamic complexity as key to enhancing project performance. Human behaviour is one of the key factors influencing project dynamic complexity, according to Lyneis and Ford [7], Martinez-Moyano and Richardson [20], Sterman [12], and Zhu and Mostafavi [19].
Project control, which essentially involves human behaviour, is thus inherently characterised by dynamic complexity, as is evident in the works of Ford et al. [9], Nasirzadeh and Nojedehi [10], and Rodrigues and Williams [11]. For instance, there tend to be delays between the controls (decisions and actions) of one project participant, their effects (some unintended and counterintuitive), and the responses of the other project participants; and there are often differences between short-run and long-run results; all of which are key characteristics of dynamic complexity, according to Sterman [12].
Solving system problems (such as project time schedule control) involving dynamic complexity is not possible with the human mind alone; computer modelling and simulation (such as System Dynamics) is needed to support human decision-making and management policies, as highlighted by Forrester [13] and Sterman [12]. Thus, System Dynamics is used in this study to model client project time schedule controls.
Lyneis and Ford [7] indicate that the main objective of applying System Dynamics to project management is to improve project performance. For this, one needs to compare the actual project performance against the targeted project performance, and then take appropriate management decisions and control actions (project controls) aimed at closing the gap between the targeted and the actual project performance [7]. As highlighted by Ford et al. [9] and Lyneis and Ford [7], adverse project dynamics that result in poor project performance largely emanate from four key structures: the rework cycle (discovery of errors in previously completed work, prompting repetition of the work); controlling feedbacks (project controls taken by management in a bid to try and bring a poorly-performing project back on track); ripple effects (primary undesirable and unintended consequences of the management project controls); and knock-on effects (secondary and tertiary undesirable and unintended consequences of the management controls). This study focuses on project controls and ripple effects and, in particular, on client project time schedule controls and ripple effects, and their System Dynamics modelling.
The rework cycle is the main cause of many detrimental project dynamics, as highlighted by Ford et al. [9], Lyneis and Ford [7], and Rahmandad and Hu [16]. Ford et al. [9] also make the point that ripple and knock-on effects tend to increase project work errors or reduce project workforce productivity. An increase in errors leads to more rework, which in turn leads to more errors: a recursive cycling of tasks around the rework cycle that results in a greater workload, longer project duration, and more resources than initially planned, as illuminated by Ford et al. [9], and Rahmandad and Hu [16]. Thus, as Lyneis and Ford [7] highlight, minimising the rework cycle and the ripple and knock-on effects of management control actions can significantly reduce project dynamics, thereby enhancing project performance.
System Dynamics has been extensively applied to project controls, particularly with regard to project time schedule controls taken by engineering consultants or construction contractors, as the preceding literature review highlights. However, project time schedule controls taken by the client and their System Dynamics modelling were sparingly covered in the literature reviewed. Hence, as indicated in Section 1, the objectives of this article are focused on client project time schedule controls.
The next section outlines the research methodology followed in this study.
3 RESEARCH METHODOLOGY
As indicated in Section 1, this research study is aimed at formulating dynamic hypotheses and a System Dynamics conceptual model of the project controls (and their associated ripple effects) usually taken by the client, during the design part of project execution, to protect the project time schedule performance. Effectively, this means covering the first two stages (problem identification and definition, and system conceptualisation) of the six-stage System Dynamics modelling process recommended by Martinez-Moyano and Richardson [20]. The research design for this study is an exploratory, embedded multiple-case study, in line with Cooper and Schindler [21], Parvan et al. [15] and Yin [22]. Furthermore, the research design is exploratory and qualitative because the purpose here is to capture current practices and experiences [21] from contemporary client project managers during the design part of project execution. Put differently, the intention includes capturing mental models of contemporary client project managers, in line with Luna-Reyes and Andersen [23], Martinez-Moyano and Richardson [20], and Sterman [12].
For a qualitative study, only non-probability sampling (e.g., accidental, purposive, snowball, or convenience) is applicable, as the intent is not to obtain a sample that is representative of the population (randomly selected and adequate size for quantitative analyses), but to obtain information from appropriate and insightful sources [21] that are purposefully selected [24]. This is also in line with the System Dynamics emphasis on capturing mental models of system actors, as highlighted above. Accordingly, this research study used a purposefully-selected key engineering consulting firm with many infrastructure projects (the focus of this article) in South Africa. Non-project-specific qualitative data was collected using individual face-to-face semi-structured interviews, similar to Mikulskiene and Pitrenaite-Zileniene [25], Nasirzadeh and Nojedehi [10], and Parvan et al. [15]; non-participant casual observation during the interviews [22]; and document analysis, similar to Nasirzadeh and Nojedehi [10]. The use of different sources of qualitative empirical evidence enables the production of research findings that are supported by multiple sources of evidence (triangulation), thereby enhancing the construct validity of the case study, as recommended by Yin [22]. The specific focus on infrastructure projects was inspired by the fact that infrastructure development is essential for the economic development of any country; yet there are many cases of poor project performance, according to Ansar, Flyvbjerg, Budzier and Lunn [26].
The research participants included five client project managers (from five different organisations (clients), sharing the same engineering consultant); and six project managers from the engineering consulting firm in question. The number of research participants used in this study is comparable to some previous studies, such as Mikulskiene and Pitrenaite-Zileniene [25] and Parvan et al. [15]. The data gathered were non-project specific, and were not necessarily limited to the engineering consultant in question.
The non-project-specific qualitative empirical data gathered in this research study were analysed using a three-streamed, iterative, qualitative data analysis process recommended by Miles, Huberman and Saldana [27]. ATLAS.ti, a computer-assisted qualitative data analysis software [28], was used in this research study to aid the qualitative data analysis. According to Miles et al. [27], the first stream of qualitative data analysis is 'data condensation', which involves sorting, clustering, selecting portions of, coding, and summarising the gathered qualitative empirical data. In this study, data condensation was conducted using ATLAS.ti software after the gathered qualitative empirical data (interview write-ups, non-participant casual observation notes, and non-project-specific organisational documents) were imported into ATLAS.ti and grouped according to their type.
The second stream of qualitative data analysis, according to Miles et al. [27], is called 'data display', which involves presenting information from the empirical data in an organised, compact form (such as with tables, matrices, causal network diagrams, or graphs) that simplifies the drawing of conclusions. Ackermann and Alexander [29] highlighted the value of causal maps/networks (in particular, systemic view and improved understanding of project dynamics), and subsequently called for more project management research using causal maps. Accordingly, in this research study, data display was done using the Network View tool of ATLAS.ti software, yielding causal networks, as shown in the next section.
The last stream of qualitative data analysis, as recommended by Miles et al. [27], is called 'conclusion drawing and verification', and entails documenting and verifying the research findings (meanings, explanations, causal relationships, themes, or patterns). In this research study, research conclusions were also done in ATLAS.ti using memos. Empirical data from multiple sources of evidence (interview write-ups, non-participant casual observation notes, and non-project-specific organisational documents) were used to verify and support the conclusions, thereby enhancing the construct validity of the case study, in line with Yin [22].
The results of the qualitative empirical data analysis were discussed and compared with appropriate extant literature. Subsequently, a System Dynamics conceptual model of the client project time schedule controls (and associated ripple effects), taken during the design part of the project execution, was formulated by integrating the results of the qualitative empirical data analysis with the extant literature using System Dynamics' Systems Thinking tools (causal loop diagrams). This is in line with Martinez-Moyano and Richardson [20], and Sterman [12]. Using a combination of existing literature, mental models of contemporary clients' and engineering consultant's project managers, and System Dynamics' Systems Thinking tools in the formulation of the dynamic hypotheses and System Dynamics conceptual model helps to strengthen their validity, as recommended by Barlas [30], Luna-Reyes and Andersen [23], Martinez-Moyano and Richardson [20], Sterman [12], and Oosthuizen [31].
The next section presents key findings from the embedded multiple-case study.
4 EMPIRICAL RESEARCH STUDY FINDINGS
Key findings emanating from the analysis of the qualitative empirical data gathered in this study are highlighted in the next two sub-sections.
4.1 Client project time schedule controls
In this research study, it was found that when a project is (or is forecast to be) behind time schedule during the design stage of project execution, the client's trust in the engineering consultant diminishes: the higher the project time schedule delay, the less the client's trust. One of the client project managers interviewed quipped:
"... the more the project is behind time schedule, the less I trust the engineering consultant. You just cannot trust a non-performer!" [Client Project Manager, Questionnaire Reference Number: C01].
Further analysis of this study's empirical data showed that, as the client's trust in the engineering consultant decreases due to poor time schedule performance, the client takes corrective control actions. Table 2 summarises the time schedule controls usually taken by the interviewed client project managers.
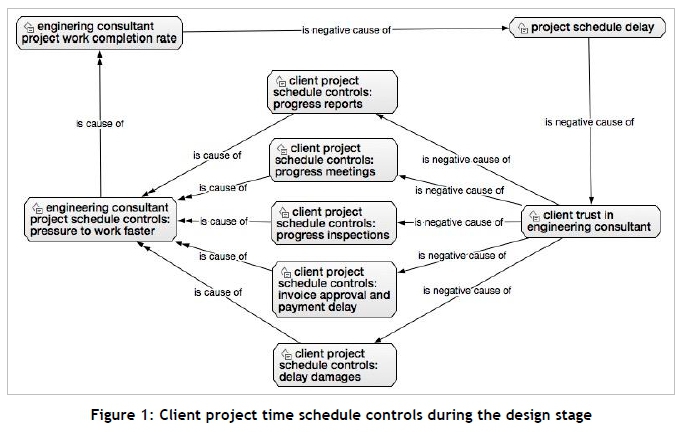
Figure 1 is a causal network display (generated using ATLAS.ti), in line with Miles et al. [27], of the five client project time schedule controls presented in Table 2.
As shown in Figure 1, the client project managers interviewed in this study indicated that the above-mentioned time schedule controls are aimed at putting pressure on the engineering consultant to speed up project work completion. One of the interviewees highlighted this as follows:
"I take these control actions not as punitive measures, but to try and apply some pressure on the engineering consultant to work faster." [Client Project Manager, Questionnaire Reference Number: C03].
In an ATLAS.ti network view (such as Figure 1), the relationship between two codes (variables, constructs, or concepts) is indicated by an arrow (showing the direction of the relationship) and a name in the middle of the arrow indicating the type of the relationship [28]. ATLAS.ti has standard relations, such as 'isa' (is a) and 'is cause of' (one variable causes another variable), and also allows the creation of user-defined relations [28]. The 'is negative cause of' (one variable negatively causes another variable) was specifically created for this study. In Figure 1, the 'is cause of' (causes) and the 'is negative cause of' (negatively causes) relations indicate the type of relationship between the associated two variables, as identified from the gathered empirical data during data analysis in ATLAS.ti. Figure 1 is read as follows, using the top route for illustration: 'project schedule delay' negatively causes 'client trust in engineering consultant', which in turn negatively causes 'progress reports'; 'progress reports' causes 'pressure to work faster', which in turn causes 'work completion rate'; 'work completion rate' negatively causes 'project schedule delay'.
4.2 Ripple effects of client project time schedule controls
Further analysis of the empirical data gathered in this study revealed that the client project time schedule controls, described in the preceding section, generate some undesirable and unintended consequences (ripple effects). Table 3 summarises the ripple effects of the client project time schedule controls, as evident from the responses of the interviewed client and engineering consultant project managers.
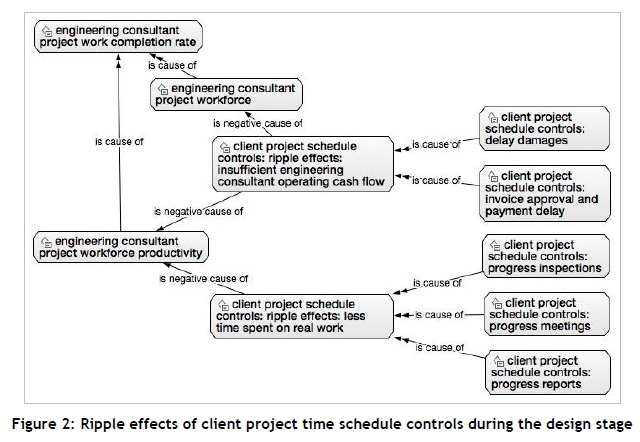
Firstly, it was found, as shown in Table 3, that producing more project progress reports, holding more progress meetings, and conducting more progress inspections consumes a significant amount of time, resulting in less time being available for the engineering consultant to carry out real project work (e.g., producing design calculations, specifications, and drawings), thus reducing the engineering consultant's productivity, which in turn decreases project work completion.
Secondly, also as shown in Table 3, it was found that instituting delay-damages penalties or delaying approval and payment of the engineering consultant's invoices sometimes leads to insufficient project operating cash flow for the engineering consultant. This makes it difficult for the engineering consultant to resource the project fully, thus putting more strain on the engineering consultant's work completion rate.
Figure 2 shows the two ripple effects of the client project schedule controls in the form of a causal network, in line with Miles et al. [27], generated using ATLAS.ti.
Figure 2 is read in a similar way to that described for Figure 1 in the preceding section.
The next section discusses these research findings, and formulates a System Dynamics conceptual model for the client project time schedule controls and associated ripple effects.
5 DISCUSSION AND FORMULATION OF A SYSTEM DYNAMICS CONCEPTUAL MODEL
5.1 Client project time schedule controls
In this study, a client's trust in the engineering consultant was found to decrease with increasing project time schedule delay; this corroborates the findings of Manu, Ankrah, Chinyio and Proverbs [32], and Rodrigues and Williams [11]. It was further found in this study that, as the client's trust in the engineering consultant diminishes due to poor project time schedule performance, the client implements one or more controls (i.e., demanding more project progress reports; conducting more progress meetings; conducting more progress inspections; delaying approval and payment of engineering consultant's invoices; and applying delay-damages penalties) aimed at putting pressure on the engineering consultant to work faster and increase project work completion. Some of these client project time schedule controls corroborate the works of previous scholars. For instance, demanding more project reports is in line with Rodrigues and Williams [11], who also focused on the design stage. Similarly, applying delay-damages penalties is in line with Von Branconi and Loch [18], who covered both design and construction stages. For client delays in payment of the engineering consultant' s invoices, Manu et al. [32] found a similar tendency, with the main contractors often delaying making payments to their subcontractors during construction.
The 'is cause of' and 'is negative cause of' relations used in ATLAS.ti, as shown in Figures 1 and 2, effectively express what System Dynamics theory calls ' dynamic hypotheses', and are represented on causal loop diagrams using arrows with (+/-) signs [12]. Indeed, causal networks (such as those shown in Figures 1 and 2) are used to illuminate causal relationships between variables/constructs, according to Miles et al. [27]. This means that the causal network displays shown in Figures 1 and 2 can easily be converted into a causal loop diagram, a useful Systems Thinking tool used in System Dynamics, according to Sterman [12] and Martinez-Moyano and Richardson [20].
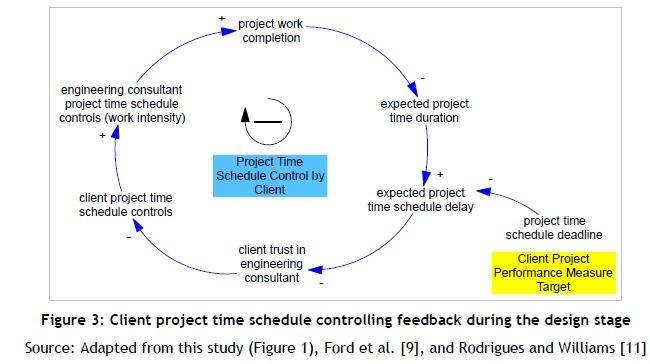
Evident in the models of Ford et al. [9], Lyneis and Ford [7], and Nasirzadeh and Nojedehi [10] is that a higher project work completion rate leads to a lower expected project time duration. Combining this dynamic hypothesis with Figure 1 effectively forms a negative (balancing) feedback loop around 'project time schedule delay', 'client trust in engineering consultant', 'client time schedule control actions', engineering consultant's 'pressure to work faster', 'project work completion', and 'expected project time duration'. Ford et al. [9], and Lyneis and Ford [7] refer to the engineering consultant's 'pressure to work faster' as 'work intensity'. The resulting negative feedback loop formed by integrating the findings of this study with previous research is shown as a System Dynamics causal loop diagram in Figure 3.
According to Sterman [12], every negative feedback loop must aim at closing the gap between the target and the current/forecast state. In the negative feedback loop in Figure 3, the target is the project time schedule deadline, and the gap (expected project time schedule delay) to be closed is the difference between the expected project time duration and the project time schedule deadline. Sterman [12] highlights that, in System Dynamics causal loop diagrams (e.g., Figure 3), arrows and their polarity (+/-) indicate causal relationships (positive or negative influences); and the short circular arrows with polarity (+/-) at the centres show the direction (clockwise/anticlockwise) and polarity (positive/reinforcing or negative/balancing) of the causal loop. Each set consisting of two variables linked by an arrow with a positive or negative sign, on a System Dynamics model, represents a dynamic hypothesis. Dynamic hypotheses are read following the direction of the arrows and loops. For example, in Figure 3 the higher the 'expected project schedule delay', the lower the 'client trust in engineering consultant'.
5.2 Ripple effects of client project time schedule controls
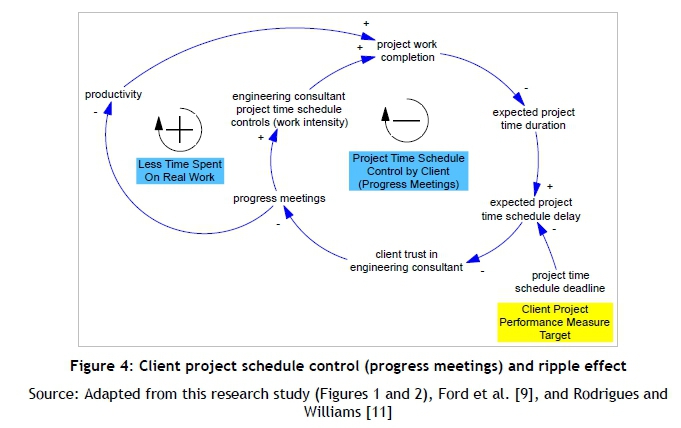
Two key ripple effects of client project time schedule controls were found in this study. Firstly, demanding more progress reports was found to lead to less time spent by the engineering consultant on carrying out real project work (e.g., producing design drawings), effectively decreasing the project workforce productivity and the project work completion rate. This finding corroborates the work of Rodrigues and Williams [11]. It was also revealed in this study that conducting more progress meetings and/or inspections yields a similar ripple effect. This ripple effect forms a positive (reinforcing) loop [12], 'less time spent on real work', which opposes the well-intentioned client project time schedule control. Figure 4 shows the controlling (negative) feedback loop and its associated ripple effect (positive loop) for one of the client project time schedule controls (conducting more progress meetings).
Two other project time schedule controls by the client (demand for progress reports from the engineering consultant, and conducting more progress inspections with the engineering consultant) yield loops similar to those shown in Figure 4.
The second ripple effect of client project time schedule controls found in this study is that instituting a delay-damages penalty or delaying approval and payment of the engineering consultant's invoices sometimes leads to insufficient project operating cash flow for the engineering consultant. This makes it difficult for the engineering consultant to resource the project fully, thus degrading the engineering consultant's work completion rate. Figure 5 shows the controlling (negative) loop and its associated ripple effect (positive loop) for client delay in approving and paying the engineering consultant's invoices.
Applying a delay-damages penalty yields loops similar to those shown in Figure 5. Other researchers, such as Ford et al. [9], Lyneis and Ford [7], and Nasirzadeh and Nojedehi [10], also highlighted that the lower the workforce productivity, the less the work completion rate, and the higher the project schedule delay.
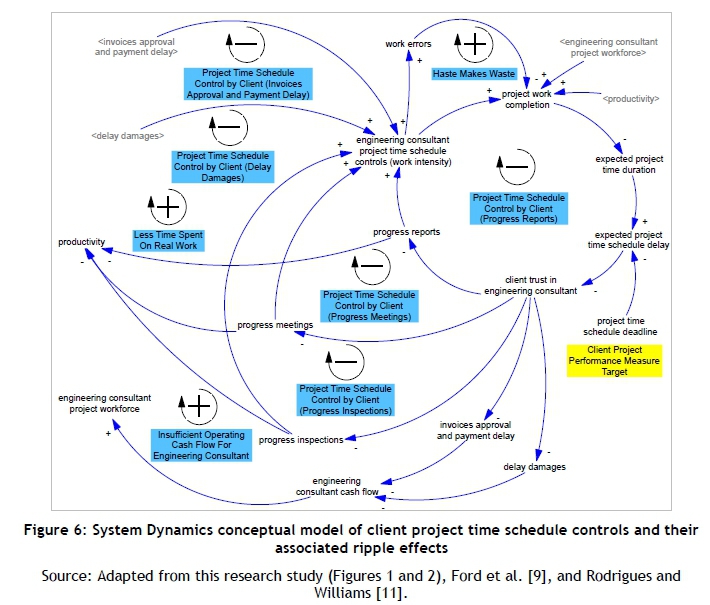
5.3 The overall System Dynamics conceptual model
Applying pressure on project workforce to work faster (work intensity) yields a ripple effect of increasing errors on project deliverables (lowering quality of deliverables), thereby decreasing the project work completion rate, according to Ford et al. [9], and Lyneis and Ford [7]. Integrating this with Figures 4 and 5, and including all five client project time schedule controls found in this study, yields the overall System Dynamics conceptual model shown in Figure 6.
In Figure 6, the five negative feedback loops represent the five client project time schedule controls found in this research study (some of which corroborated the extant literature, as discussed in the preceding sub-sections). The positive feedback loops represent the ripple effects of the client project time schedule controls. Effectively, as shown in Figure 6, the positive/reinforcing feedback loops militate against the intended negative/balancing feedback loops, further degrading project time schedule performance. Put differently, the client's control actions, which are aimed at increasing the project work completion rate and reducing/eliminating the project time schedule delay, tend to generate some primary unintended and counteractive consequences (ripple effects) that reduce the project work completion rate and increase the project time schedule delay. This key finding is effectively the main dynamic hypothesis presented in Figure 6.
As is evident throughout this article, the System Dynamics conceptual model of client project time schedule controls and their associated ripple effects, shown in Figure 6, was formulated from a combination of the extant literature; the key findings from an empirical research study that captured the mental models of the client's and the engineering consultant's project managers; and one of System Dynamics' Systems Thinking tools (the causal loop diagram). This helps to strengthen the validity of the dynamic hypotheses and model presented in Figure 6, as recommended by Barlas [30], Luna-Reyes and Andersen [23], Martinez-Moyano and Richardson [20], and Sterman [12].
6 CONCLUSION AND RECOMMENDATIONS
This article aimed to investigate the project controls (and associated ripple effects) usually implemented by a client during the design part of project execution, to bring a project that is (or is forecast to be) behind time schedule back on schedule. An embedded multiple-case study was conducted, supported by a critical literature review foundation. Analysis of the gathered qualitative empirical data was done using ATLAS.ti, and the key findings were grouped into two main categories. The first category of the key findings concerned the client project time schedule controls. These findings suggest that the client's trust in the engineering consultant decreases with increasing project time schedule delay. It was also found in this study that, as the client's trust in the engineering consultant diminishes due to poor project time schedule performance, the client implements one or more of the following controls: demanding more project progress reports; conducting more progress meetings; conducting more progress inspections; delaying approval and payment of the engineering consultant's invoices; and applying delay-damages penalties. These controls were found to be aimed at putting pressure on the engineering consultant to work faster and increase project work completion.
The second group of the empirical study's findings concerns the ripple effects of the client project time schedule controls. Two key ripple effects were found. Firstly, demanding more project reports, conducting more progress meetings, and conducting more progress inspections were found to decrease the engineering consultant's workforce productivity, resulting in a decrease in the project work completion rate. Secondly, instituting a delay-damages penalty or delaying approval and payment of the engineering consultant's invoices were found, potentially, to lead to insufficient project operating cash flow for the engineering consultant, leading to a decrease in the engineering consultant's project workforce, and consequently decreasing project work completion. Some of these findings from the empirical study were found to corroborate the works of previous scholars.
Subsequently, dynamic hypotheses and a System Dynamics conceptual model of the client project time schedule controls (and their ripple effects) were formulated from a combination of the existing literature, key findings from the empirical study, and the use of System Dynamics' Systems Thinking tools. The main dynamic hypothesis shown in the System Dynamics conceptual model formulated in this article is that the client's control actions (negative feedback loops), aimed at increasing the project work completion rate and reducing/eliminating the project time schedule delay (improving project performance), tend to generate ripple effects (positive feedback loops) that reduce the project work completion rate and increase the project time schedule delay (worsening project performance).
While this article managed to address all of its objectives, its findings are not free of limitations. For instance, compared with the six-stage System Dynamics modelling process (problem identification and definition; system conceptualisation; model formulation; model testing and evaluation; model use, implementation and dissemination; and design of learning strategy/infrastructure) recommended by Martinez-Moyano and Richardson [20], this article effectively covers only the first two stages, which produced a causal loop diagram. Ackermann and Alexander [29] highlighted that a causal map can provide a solid foundation on which a quantitative model can be formulated. Further research studies thus need to build on where this article left off: to develop an associated full System Dynamics simulation model, calibrate and further validate it using empirical data, and test the dynamic hypotheses, similar to the approach recommended by Parvan et al. [15].
Future studies may also integrate the client project time schedule controls with the engineering consultant's project time schedule controls - i.e., integrate the findings of this article with the work of Ford et al. [9]. The authors of this article are currently involved in further research studies aimed at System Dynamics modelling of a client's project cost controls and an engineering consultant's project revenue and cash flow controls. Further studies may also consider controls taken by the client to protect other project performance measures, such as quality, and by the engineering consultant (and construction contractor) to protect their other business performance measures, such as profit. It would be interesting if all these future studies were to consider the ripple and knock-on effects of such controls on project performance, and on the business performance of the engineering consultant (and construction contractor).
REFERENCES
[1] Parvan, K. 2012. Estimating the Impact of Building Information Modeling (BIM) Utilization on Building Project Performance. PhD Thesis. University of Maryland. [ Links ]
[2] Shen, L., Song, S., Hao, J. & Tam, V.W. 2008. Collaboration Among Project Participants Towards Sustainable Construction- A Hong Kong Study. Open Construction and Building Technology Journal, 2(2008), pp. 59-68. [ Links ]
[3] Ngacho, C. & Das, D. 2014. A Performance Evaluation Framework of Development Projects: An Empirical Study of Constituency Development Fund (CDF) Construction Projects in Kenya. International Journal of Project Management, 32(3), pp. 492-507. [ Links ]
[4] Toor, S.R. & Ogunlana, S.O. 2010. Beyond the 'Iron Triangle': Stakeholder Perception of Key Performance Indicators (KPIs) for Large-Scale Public Sector Development Projects. International Journal of Project Management, 28(3), pp. 228-236. [ Links ]
[5] De Wit, A. 1988. Measurement of Project Success. International Journal of Project Management, 6(3), pp. 164-170. [ Links ]
[6] Project Management Institute 2013. A Guide to the Project Management Body of Knowledge (PMBOK® Guide), 5th ed. Pennsylvania: Project Management Institute. [ Links ]
[7] Lyneis, J.M. & Ford, D.N. 2007. System Dynamics Applied to Project Management: A Survey, Assessment, and Directions for Future Research. System Dynamics Review, 23(2-3), pp. 157-189. [ Links ]
[8] Sutterfield, J.S., Friday-Stroud, S.S. & Shivers-Blackwell, S.L. 2007. How not to manage a project: Conflict management lessons learned from a DOD case study. Institute of Behavioral and Applied Management, 8(3), pp. 218-238. [ Links ]
[9] Ford, D.N., Lyneis, J.M. & Taylor, T. 2007. Project Controls to Minimize Cost and Schedule Overruns: A Model, Research Agenda, and Initial Results. International System Dynamics Conference, pp. 1-27. [ Links ]
[10] Nasirzadeh, F. & Nojedehi, P. 2013. Dynamic Modeling of Labor Productivity in Construction Projects. International Journal of Project Management, 31(6), pp. 903-911. [ Links ]
[11] Rodrigues, A.G. & Williams, T.M. 1998. System Dynamics in Project Management: Assessing the Impacts of Client Behaviour on Project Performance. Journal of the Operational Research Society, 49(1), pp. 2-15. [ Links ]
[12] Sterman, J.D. 2000. Business Dynamics: Systems Thinking and Modeling for a Complex World, 1st ed. Chicago: Irwin/McGraw Hill. [ Links ]
[13] Forrester, J.W. 2007. System Dynamics - The Next Fifty Years. System Dynamics Review, 23(2-3), pp. 359-370. [ Links ]
[14] Anbari, F.T. 2003. Earned Value Project Management Method And Extensions. Project Management Journal, 34(4), pp. 12-23. [ Links ]
[15] Parvan, K., Rahmandad, H. & Haghani, A. 2015. Inter-Phase Feedbacks in Construction Projects. Journal of Operations Management, 39(2015), pp. 48-62. [ Links ]
[16] Rahmandad, H. & Hu, K. 2010. Modeling the Rework Cycle: Capturing Multiple Defects per Task. System Dynamics Review, 26(4), pp. 291-315. [ Links ]
[17] Suprapto, M., Bakker, H.L. & Mooi, H.G. 2015. Relational Factors in Owner-Contractor Collaboration: The Mediating Role of Teamworking. International Journal of Project Management, 33(6), pp. 1347-1363. [ Links ]
[18] Von Branconi, C. & Loch, C.H. 2004. Contracting for Major Projects: Eight Business Levers for Top Management. International Journal of Project Management, 22(2), pp. 119-130. [ Links ]
[19] Zhu, J. & Mostafavi, A. 2017. Discovering complexity and emergent properties in project systems: A new approach to understanding project performance. International Journal of Project Management, 35(1), pp. 1-12. [ Links ]
[20] Martinez-Moyano, I.J. & Richardson, G.P. 2013. Best Practices in System Dynamics Modeling. System Dynamics Review, 29(2), pp. 102-123. [ Links ]
[21] Cooper, D.R. & Schindler, P.S. 2014. Business Research Methods, 12th ed. New York: MacGraw-Hill/Irwin. [ Links ]
[22] Yin, R.K. 2014. Case Study Research: Design And Methods, 5th ed. California: SAGE Publications, Inc. [ Links ]
[23] Luna-Reyes, L.F. & Andersen, D.L. 2003. Collecting and Analyzing Qualitative Data for System Dynamics: Methods and Models. System Dynamics Review, 19(4), pp. 271-296. [ Links ]
[24] Morse, J.M. & Niehaus, L. 2009. Mixed Method Design: Principles and Procedures., 1st ed. California: Left Coast Press Inc. [ Links ]
[25] Mikulskiene, B. & Pitrenaite-Zileniene, B. 2013. From Stakeholders' Competition to the Balance of Interests: System Dynamics Model of Participatory Policy. International Journal of Technology, Policy and Management, 13(3), pp. 294-312. [ Links ]
[26] Ansar, A., Flyvbjerg, B., Budzier, A. & Lunn, D. 2016. Does infrastructure investment lead to economic growth or economic fragility? Evidence from China. Oxford Review of Economic Policy, 32(3), pp. 360-390. [ Links ]
[27] Miles, M.B., Huberman, A.M. & Saldana, J. 2014. Qualitative Data Analysis: A Methods Sourcebook, 3rd ed. California: SAGE Publications Incorporated. [ Links ]
[28] Atlas.Ti. 2016. ATLAS.ti Manuals and Documents [Online]. Available from: http://atlasti.com/manuals-docs/ [Accessed 04 April 2016 2016]. [ Links ]
[29] Ackermann, F. & Alexander, J. 2016. Researching Complex Projects: Using Causal Mapping to Take a Systems Perspective. International Journal of Project Management, 34(6), pp. 891-901. [ Links ]
[30] Barlas, Y. 1996. Formal Aspects of Model Validity and Validation in System Dynamics. System Dynamics Review, 12(3), pp. 183-210. [ Links ]
[31] Oosthuizen, R. 2014. Modelling Methodology for Assessing the Impact of New Technology on Complex Sociotechnical Systems. PhD Thesis. University of Pretoria. [ Links ]
[32] Manu, E., Ankrah, N., Chinyio, E. & Proverbs, D. 2015. Trust Influencing Factors in Main Contractor and Subcontractor Relationships During Projects. International Journal of Project Management, 33(7), pp. 1495-1508. [ Links ]
Submitted by authors 30 Oct 2016
Accepted for publication 19 Apr 2018
Available online 31 /May 2018
* Corresponding author u12279422@tuks.co.za
# The author was enrolled for a PhD (Project Management) degree in the Department of Engineering and Technology Management, University of Pretoria, South Africa

