


Services on Demand
Article
 English (pdf)
 Article in xml format
 Article references
Indicators

Related links
-
 Cited by Google
 -
 Similars in Google
Share

 Permalink
South African Journal of Industrial Engineering
On-line version ISSN 2224-7890
Print version ISSN 1012-277X
S. Afr. J. Ind. Eng. vol.28 n.4 Pretoria Dec. 2017
http://dx.doi.org/10.7166/28-4-1766
GENERAL ARTICLES
An approach to improving customer on-time delivery against the original promise date
G.M. RamachandranI, *; S. NeelakrishnanII
IDepartment of Mechanical Engineering, PSG College of Technology, Anna University, Coimbatore- 641 004, India
IIDepartment of Automobile Engineering, PSG College of Technology, Anna University, Coimbatore - 641 004, India
ABSTRACT
One of the main challenges that a low-volume high-variety (LVHV) product manufacturing industry faces is to improve customer on-time delivery (OTD) against the original promised date (OPD) in a make-to-order (MTO) situation. A systematic root-cause analysis is carried out in the LVHV industry to find the true root cause and eliminate it. This paper proposes a methodology that incorporates the lean thinking methodology, a lean live tracking (LLT) tool, and cross-functional team (CFT) approaches to improve OTD. These are tested using real-time data from an industrial valve manufacturing LVHV firm, resulting in an average OTD improvement from 30 percent to 90 percent in about eight months.
OPSOMMING
Een van die hoofuitdagings waarmee 'n lae volume, hoë variëteit produkvervaardigingsindustrie gekonfronteer word, is om betydse aflewering te verbeter in 'n maak-op-bestelling situasie. 'n Sistemiese worteloorsaakanalise is van stapel gestuur in dié industrie om die ware oorsaak op te spoor en te elimineer. Hierdie artikel fokus op 'n metodologie wat van lenige denkmetodologie, regstreekse lenige monitering, en oorkruis funksionele spanbenaderings gebruik maak om betyds aflewering te verbeter. Dit word getoets aan die hand van regstreekse data van 'n industriële klepvervaardiger en die resultate toon n gemiddelde verbetering wat wissel tussen 30 en 90 persent gedurende 'n periode van agt maande.
1 INTRODUCTION
Lean manufacturing (LM) is a proven manufacturing philosophy that shortens the time between the customer's order and the product-build-to-shipment by eliminating sources of waste. The current marketplace needs optimised design-for-use, frequent design changes, and smaller production runs of greater variety, all with fluctuating demands. These demands make the manufacture of low-volume high-variety (LVHV) products a complex process. The main road blocks to implementing LM in such industries are a lack of understanding of the correct lean tools, and people's attitudes [16]. Customer responsiveness and product quality are improved by adapting LM and lean thinking. On-time delivery (OTD) is one of the top industrial metrics that needs to be met by the firm's original promised date (OPD) to the customer. To improve OTD, on-time receipt (OTR) of material from suppliers and subcontractors is required. To achieve any realistic and sustained improvement in OTD performance, all the functional units and associated systems must be considered. Applying lean techniques in the office is more critical than on the shop floor to eliminate waste and to achieve the targeted customer response [17]. Realising the importance of such an approach, this study proposes a solution to improve OTD performance. The system and the people involved in the planning and manufacturing for the control and maintenance cycles of LVHV situations are integrated with a user interface to support CFT operations through basic and transactional data. The detailed research analysis, the performance of internal operations, and the methods of component sourcing strategies are presented in this work. During the course of this research, a user interface called the lean live tracking (LLT) tool was developed. The LLT is incorporated in ERP (BaaN, version IV) from the outside in manufacturing and inventory modules between material planning and production planning. The proposed model is implemented in a selected LVHV manufacturing situation. This paper is organised as follows: first there is a review of the relevant literature, with a problem definition from the case industry, followed by the research methodology that was adopted. Then, based on the systematic investigation of OTD data with 'why-why' analysis, a solution is found, its implementation is proposed, and conclusions are drawn.
2 LITERATURE REVIEW
MRP and ERP in the marketplace fail to meet important lean goals such as OTD and low work-in-progress (WIP) inventory throughout the LVHV environment, because they do not address the problem of variety in low-volume product orders, staying dynamic in operational and customer requirements. This also extends to the coordination of suppliers in acquiring products as make-to-order (MTO) is being followed, and responding to unpredictable customer orders [2]. The multi-product industry offers a variety of choices; but again, in a multi-product situation, it is difficult to meet all the requirements of the customer's package with detailed specifications [6]. Industries intend to meet these demands by offering a wide variety of products. Industries that try to satisfy the rapidly changing needs and wants of customers quickly with appropriate products have an advantage over their competitors. In response to technological innovation and constantly varying customer requirements, a shift from conventional mass production to batch production has accelerated in recent years [1]. At the macro-level, high variety products improve sales and profits, but the law of diminishing returns means that the benefits are not maintained in the long run. High variety does not increase the total demand, but firms increase variety to ring-fence their customers [13]. High variety increases the engineering workload through the creation of bills of material (BOM) and general arrangement drawings (GAD) of new product variants [9]. Modular product design is one of the productive ways of achieving product variety [3]. The modular approach enables producers to offer a greater range of end products without increasing the variety of components [3,11]. Through the use of modularity to configure the design of product variations, the negative impact of product variety on operational performance can be reduced [9]. A mature industry must consider product familial synergy and achieve commonality between components and subsystems [12]. Industries can offer high variety in the market through component-sharing while retaining low variety in their operations [14]; but this is not common to all industrial products. Mandal [18] found that firms face challenges in remaining in the market due to increasing customer preferences for newer technologies. The case study of Vanpoucke, Vereecke and Muylle [19] found that leveraging the impact of supply chain integration through information technology in industries. The case study of Ketsarapong, Suwantaranrangsr, Phusavat and Lin [20] found that the critical factors for successful lean implementation are a commitment from management and the involvement of every operator, and that these are more important than the technical aspects.
LVHV increases purchasing and material costs [15]. Increased purchasing costs can be mainly attributed to the increase in variety and the reduction in volume of purchased parts and components [5]. Suppliers may experience losses due to component variety, with a potentially negative impact on component prices, delivery times, and component inventory levels [7]. In LVHV manufacturing, it is difficult to develop the most profitable partnership with the supplier in achieving delivery quantity, frequency, and price [9]. Increasing product variety increases the costs and complexity of manufacturing [3]. When product variety increases, the performance of the firm's internal operations decreases due to higher direct manufacturing costs, increased manufacturing overheads, longer delivery times, and higher inventory levels [7]. With an increase in variety, assembly line balancing becomes problematic, and component planning and production scheduling become more complex [4]. Focusing on the MTO environment and using queuing models, conditions were created in which an increase in product variety improves both individual product performance and system performance [8]. Studies of how lean manufacturing can be applied to LVHV segments have been carried out [9]. Increasing variety has an impact on various logistics and operational costs. Variety includes many indirect costs that are difficult to predict, and are often neglected when making decisions about introducing variety [10]. A high level of mismatched sets of component causes poor OTD and a low inventory turn-around, leading to cash flow issues and the inability to meet OPD commitments to the customer.
3 METHODOLOGY
Most researchers have discussed empirical research using a systematic approach. In this paper, the research problem is derived from a real-time LVHV manufacturing firm and subjected to detailed analysis. The firm has very little control over the business process, as orders are dynamic and low-volume; thus, they need to focus on moment-to-moment issues in the process. The methodology adopted is to define the problem, measure the data, investigate and analyse the data, propose solutions to make improvements, implement, and control for sustainability.
4 PROBLEM DEFINITION
LVHV products are complex in execution, resulting in low OTD and inventory turn-around. This leads to customer dissatisfaction and to cash flow issues for the firm [9]. OTD is measured, based on the OPD given to the customer. Therefore, OTD involves meeting the OPD without any delays. LVHV industries prefer MTO to avoid any inventory stagnation. Most of the studies have concentrated on localised improvements such as lot sizing, inventory, forecasts, and operations. Product design, planning, expediting, and shipment processes are not discussed in relation to achieving OPD.
An industrial valve manufacturing company has 738 variant finished product line items, requiring 3,508 components. This makes it complex to find which product has complete matched sets to release assembly orders. In this case, the typical ERP does not help to track all the items in a multilevel BOM to know its exact status. The existing ERP is not user-friendly and updated; thus, it is a tedious task to find matched sets and to expedite their delivery from the suppliers. Furthermore, capacity planning and utilisation are not possible because of volatility in the volume and variety of parts. A very high level of manual intervention is required to find matched set to schedule/plan and release the final assembly production orders. Moreover, the in-house manufacturing status is not able to track the various stages such as welding, assembly, testing, quality control (QC), customer or third-party inspections (TPI), inspection release note (iRN) status, finish goods (FG) update, or shipping clearance note (SCN).
4.1 On-time delivery (OTD):
The firm's order processing system seems not to deliver well, and the results of OTD performance to customers against OPD are poor.

It can be seen from the LVHV industrial valve manufacturing firm's delivery performance trend chart for the previous ten months (Figure 1) that most of its customers are unhappy. It is evident that the firm has encountered a huge crisis in failing to meet OTD, leading to the considerable disadvantage of customer dissatisfaction. The trend indicates that the firm's delivery performance is steadily declining due to LVHV.
4.2 Original promise date (OPD)
OPD is a function of various concurrent and sequential elements that require BOM, ERP, inventory on hand, on-time release purchase order (PO) to supplier, OTR, capacity, customer approval for manufacturing, on-time production (OTP), inspection, and SCN. It also requires the involvement, participation, and collaboration of all the functional units, making it even more complex.

4.3 On time receipt (OTR):
Among the various elements, poor OTR contributes to the steady decline of the firm's delivery performance. The LVHV product manufacturing firm tends to have an unstable supply chain. The OTR of material from the suppliers has been studied in a valve manufacturing firm since October 2015, revealing a trend of 60 percent OTR, as shown in Figure 1, in which the OTR is calculated against the material planned delivery date (MPDD) for each line item mentioned in the PO.

5 EXPERIMENTAL INVESTIGATION
To understand the firm better, the product variety and volume are reviewed using the past thirty-six months' data (Figure 2). The data dump contains the invoice number and date, the customers' details, the product details of every line item (such as the figure number and a description of the product and its quantity), unit price, and sales value details in US dollars. From the data, for the purpose of analysis, the product figure number is labelled 'variety', and the invoiced quantity is labelled 'volume'. The limitation of this analysis is that some instances have been omitted or treated as a single occurrence per product figure number over the period of thirty-six months. The product figure number is kept unique, and the quantity invoiced is combined for the entire period, ignoring the shipping instances.
This data is further grouped as 'runners', 'repeaters', and 'strangers' (80 percent, 15 percent, and five percent respectively), based on quantity (volume) invoiced on each product figure number against the total quantity invoiced. The analysis found that 80 percent of the variety contributed to five percent of the volume (strangers), 15 percent of the variety contributed to 20 percent of the volume (repeaters), and five percent of the variety contributed to 75 percent of the volume (runners). Since 20 percent of the variety of both runners and repeaters contributes to 95 percent of the volume, while five percent of the stranger's volume contributes to the 80 percent of the variety. According to the detailed survey and comparison of various characteristics of lean plant and LVHV plant are discussed [9] based on annual volume, from 100,000 to 1,000,000+ units per year are lean plant or high volume low variety industry and from 20 - 500 and 5,000 - 20,000 units per year are said to be LVHV industry. From the data in Figure 2, it is observed that 11,204 items (five percent of the quantity) was produced from 575 (80 percent) product figure numbers of the variety. Thus, by comparing both the data the industry can be described as LVHV products manufacturing industry. However, the sales value data confirms that strangers contribute to 69 percent of the firm's total sales value. For that reason, the management is deeply committed to improving overall operational efficiency through suitable lean strategies.
5.1 Supplier delivery performance analysis
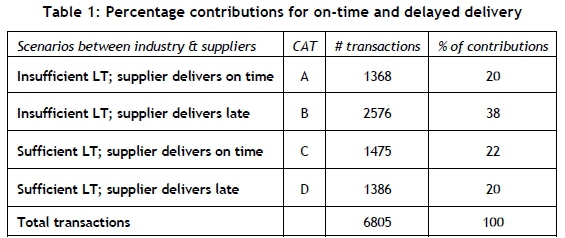
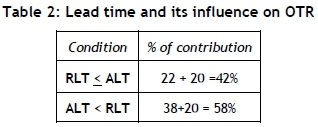
The supplier's delivery status is further analysed in relation to components. This includes components delivered as raw materials and components delivered to ready for the assembly of products. The expected target level for component-related delivery performance has been set at 60 percent. To begin with, the lead time (LT) analysis has been done using the previous year's data. Based on the LT data and the supplier OTD, as shown in Table 1, the relationship between the industry and its suppliers has been grouped under four different scenarios based on LT data. The LT contribution on supplier OTD is shown in Table 2, it is found that LT has more influence on OTR. It is found that, out of 6,805 transactions, 58 percent have been given insufficient LT to process the order, and 42 percent were given enough lead time to process the order. Another inference is that, irrespective of the lead time given, 42 percent suppliers delivered on time, while despite the insufficient lead time given them for 20 percent.
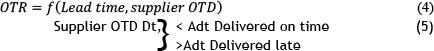
where 'Dt' is the delivery date of the supplier, and 'Adt' is the planned delivery date (PDD) requested by the industry from the supplier. Equation 5 denotes the criterion applied to suppliers, based on their delivery to the firm.
where 'RLT' is required lead time and 'ALT' is agreed lead time. To analyse the supplier delivery performance, the main factors affecting the OTR are LT and supplier delay, as listed in Table 2. Further occurrence of the causes has been carefully observed and found to be a major contributing factor to the LT. Table 3 elucidates the OPD factors and their contributions.
5.2 Why-why analysis
'Why-why' is an iterative interrogative technique used to explore the cause-and-effect relationships underlying a particular problem. The primary goal of the technique is to determine the root cause of a problem. The brainstorming procedure uses an affinity diagram involving cross-functional teams (CFTs) consisting of nine members each, including executive managers (the functional heads) of seven departments - sales, engineering, planning, purchase, stores, maintenance, production, quality, and finance - along with the director of plant operations, to do the why-why analysis. It helps them to reveal the hidden cause behind the known cause of a problem. Figure 3 shows the why-why analysis of the insufficient lead time given to the supplier. It reveals that a delay in converting from the material requirement planning (MRP) to purchase request (PR) to purchase order (PO) is the major root cause of insufficient LT that needs to be addressed. Figure 4 shows the why-why analysis for supplier delay. It reveals that "no tracking control" is the major reason behind the supplier delay that also needs to be addressed. The major concerns are the lack of tracking control of components from the MRP-PO-PR conversion. Despite the dates being expedited, there is a gap between the agreed time and the actual time of delivering the components. They are found to be the major bottlenecks to achieving OTR and thus OTD.
6 PROPOSED SOLUTION
From the above analysis, it is found that the MRP-PR-PO conversion is not taking place within the specified time, mainly because the buyer's time is mostly taken up by manually tracking current orders to expedite and meet daily production demands. Hence, a lean live tracking (LLT) system should be designed and implemented for ease of tracking with very low manual intervention. The design of the LLT user interface, the parameters considered, and its functioning will be discussed in the section 6.1. LLT continuously traces the product flow, thereby greatly reducing the person-hours spent on tracking and expediting. This ensures that there is no delay in generating the PO and achieving OTR, resulting to OTD. LLT bridges the typical gap between ERP and manual tracking in processing orders to meet OPD. Moreover, a CFT enables the results from order to cash (OTC) that are involved in the functioning and working of LLT. Figure 5 shows the various attributes concerned with improving OTD and possible solutions to enhance OTD.
6.1 Innovative lean live tracking (LLT) system
The LLT system bridges the gap between PO releases to suppliers and production completion. The generation of a daily shortage report is possible through the user interface, at all levels of the child components of BOM, to help planners, buyers, and production staff to focus.
It checks the data given and compares it with pending PO MPDD at the suppliers and the WIP in the machine shop and the sub-contract shop. The respective CFT members give firm daily commitment dates against MPDD to determine firm commitment dates to release assembly orders at the product level. BOM, on-hand inventory, WIP, and pending PO are uploaded in spreadsheet format (preferable as .xls or .xlsx), as in the screenshot in Figure 7. For WIP, it is updated from the machine shop and from the sub-contractors, as shown in Figure 7. The pending POs are also given a commitment date for each line item by the purchasing team (Figure 8). Once the assembly production orders have been released from ERP, people update the status of various production stages to review and expedite them. LLT is a major aid in the LVHV production environment by feeding periodical data into the system. Data is imported from a typical ERP to the LLT user interface to update as per set frequency, followed by daily updates of necessary data. This enables the effective review and improving of the live status of all the items and production stages.
6.2 Order to cash team:
The OTC team is a CFT consisting of nine members from various functional units who work towards a common objective.
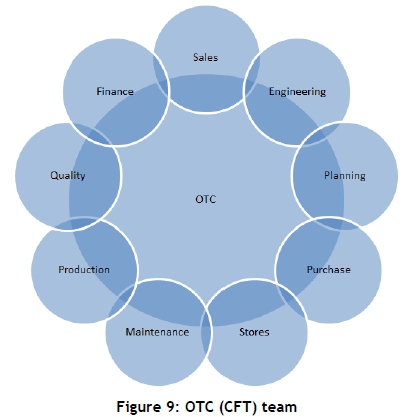
This team is created to communicate, prioritise, coordinate, review, and move together from the time of order placement to delivery. This team works along with an expediting team to take appropriate action. The composition of the team cuts across all functional units, with members from sales, planning, purchase, manufacturing, quality, engineering, stores, and maintenance representing their functions, as shown in Figure 9. The plant director mentors the team. It meets every day to coordinate and discuss the process. This helps to produce a process flow, instead of units being isolated as separate functional islands. Detailed updates from all the team members help to produce an accurate status, thereby helping to achieve OTD.
7 FEASIBILITY STUDY
Solutions that have been found to improve OTD performance are being tested for their feasibility and cost-benefit analysis.

Cf is the fine amount incurred by the industry if the product is not delivered on time, Ci is the cost incurred for performing activity 'i' in implementing that solution, and Ω is the arbitrary constant for profit or benefit earned because of implementing it. Ω has been kept as 50 percent of Cf. It has been noted that, in the financial year 2015-2016, the fine amount paid to customers for failure to deliver on time was around 20 million INR. The Σ Ci is found to be 1.5 million INR in this case. The value of Ω is 18.5 million INR, which is 92.5 percent of Cf, thereby gaining a positive result in the cost-benefit analysis.
8 RESULTS AND CONCLUSION
The framework of the LLT system and the OTC team has been combined in this paper to overcome the limitations of typical ERP and people involvement. The contribution of this paper is to plot the key notions in planning and optimising the production and manufacturing processes involved in industrial engineering and management. The summary below indicates that the OTC team get 'Andon' at critical milestones to take action, from the placement of customer order until the shipment to the customer. Andon is a systematic way of indicating a delay in the process so that the CFT can take appropriate action. Table 4 compares the typical ERP with the LLT.
This system has been implemented in the LVHV valve manufacturing industry since August 2016, and has been consistently monitored. With the support of LLT, the OTC team improved supplier OTR significantly; and that in turn influenced an improvement in OTD. The visibility of the LVHV industry is enhanced through the LLT, which also assures us that the chances of not meeting OPD due to a shortage of components and production delays are minimised. This enables the firm to deploy appropriate resources in a timely way to meet the OPD.
The user interface tool could be deployed in similar industries, particularly in LVHV industries, to eliminate the challenges of customisation and to standardise the flow of materials. The LLT system is a milestone in the LVHV environment that enables the tracking of products from the input of the raw material to the final product shipment to the customer, thus improving OTD performance.
The improved OTD percentage is shown in Figure 10. The fine amount to be paid is reduced to 7.5 million INR.
When two firms make and sell similar products for the same application, the differentiating factors are people, supply chain management, and optimisation of processes throughout the organisation; those are what will achieve competitiveness in the marketplace. In this paper, the OTD performance of a LVHV firm has been analysed, and the gap between current performance and targeted performance has been identified. Solutions have been proposed to bridge the gap in order to achieve results in quantitative terms. The LLT system has the complete collaboration of the firm's internal activities, making product tracking easier. TPI completion, production test completion, product assembly completion, material feeding to assembly completion, shortage report to get matched set components, and PO status update - the major processes in the flow towards achieving OTD - have been successfully captured and tracked in the LLT, which reduces human effort and helps to achieve OTD against OPD. This LLT can be implemented simultaneously in all MTO, engineer-to-order (ETO) and assemble-to-order (ATO) industries, reducing complexity and thereby ensuring OTD. OTC team formation depends on the criticality of the processes involved in achieving OTD, making it a flexible association to uphold the LLT system. It is seen that this methodology has resulted in an OTD improvement from 30 percent to 90 percent in about eight months.
REFERENCES
[1] Agarwal, A., Minis, I. & Nagi, R. 2000. Cycle time reduction by improved MRP-based production planning. International Journal of Production Research, 38(18), pp. 4823-4841. [ Links ]
[2] Ali, A., Seifoddini, H. & Lee, J. 2010. Efficient material allocations in high-mix low-volume manufacturing. Journal of Advanced Manufacturing Systems, 9(2), pp. 101-116. [ Links ]
[3] Alford, D., Sackett, P. & Nelder, G. 2000. Mass customization: An automotive perspective. International Journal of Production Economics, 65, pp. 99-110. [ Links ]
[4] Fisher, M.L., MacDuffie, J.P. & Sethuraman, K. 1996. Product variety and manufacturing performance: Evidence from the international automotive assembly plant study. Management Science, 42(3), pp. 350-369. [ Links ]
[5] Fisher, M.L. & Ittner C.D. 1999. The impact of product variety on automobile assembly operations: Empirical evidence and simulation analysis. Management Science, 45(6), pp. 771-786. [ Links ]
[6] Forslund, H. Johnsson, P. & Mattsson, S-A. (2009). Order-to-delivery process performance in delivery scheduling environments. International Journal of Productivity and Performance Management, 58(1), pp. 41-53. [ Links ]
[7] Forza, C., Rungtusanatham, M. & Salvador, F. 2002. Modularity, product variety, production volume, and component sourcing: Theorizing beyond generic prescriptions. Journal of Operations Management, 20, pp.549-575. [ Links ]
[8] Gupta, D. & Srinivasan, M.M. 1998. How does product proliferation affect responsiveness? Management Science, 44(7), pp. 1017-1020. [ Links ]
[9] Jina, J., Bhattacharya, A.K. & Walton, A.D. 1997. Applying lean principles for high product variety and low volumes: Some issues and propositions. Logistics Information Management, 10(1), pp. 5-13. [ Links ]
[10] Martin, M. & Ishii, K. 2002. Design for variety: Developing standardized and modularized product platform architectures. Research in Engineering Design, 13, pp. 213-235. [ Links ]
[11] McCutcheon, D.M., Raturi, A.S. & Meredith, J.R. 1994. The customization-responsiveness squeeze. Sloan Management Review, 35, pp.89. [ Links ]
[12] McDermott, C.M. & Stock, G.N. 1994. The use of common parts and design in high-tech industries: A strategic approach. Production and Inventory Management Journal, 35, pp. 65-68. [ Links ]
[13] Rajagopalan, S. & Swaminatham, J.M. 2001. A coordinated production planning with capacity expansion and inventory management. Management Science, 47(11), pp. 1562-1580. [ Links ]
[14] Ramdas, K., Fisher, M. & Ulrich, K. 2003. Managing variety for assembled products: Modeling component systems sharing. Manufacturing & Service Operations Management, 5(2), pp. 142-156. [ Links ]
[15] Ulrich, K. & Randall, T. 2001. Product variety, supply chain structure, and firm performance: Analysis of the US bicycle industry. Management Science, 47(12), pp. 1588-1604. [ Links ]
[16] Nordin, N., Md Deros, B. & Abd Wahab, D. 2010. A survey on lean manufacturing implementation in Malaysian automotive industry. International Journal of Innovation, Management and Technology,1(4), pp.374-380. [ Links ]
[17] Sabur, V.F. & Simatupang, T.M. 2015. Improvement of customer response time using lean office. International Journal of Services and Operations Management, 20(1), pp. 59-85. [ Links ]
[18] Mandal, S. 2016. An empirical investigation on integrated logistics capabilities, supply chain agility and firm performance. International Journal of Services and Operations Management, 24(4), pp. 504-530. [ Links ]
[19] Vanpoucke, E., Vereecke, A. & Muylle, S. 2017. Leveraging the impact of supply chain integration through information technology. International Journal of Operations & Production Management, 37(4) pp. 510-530. [ Links ]
[20] Ketsarapong, S., Suwantaranrangsr, K., Phusavat, K. & Lin, B. 2012. Sustaining supply chain operations through lean manufacturing. International Journal of Synergy and Research, 1(2), pp. 5-20. [ Links ]
Submitted by authors 28 Apr 2017
Accepted for publication 15 Nov 2017
Available online 13 Dec 2017
* Corresponding author ramgm27@gmail.com

