


Services on Demand
Article
 English (pdf)
 Article in xml format
 Article references
Indicators

Related links
-
 Cited by Google
 -
 Similars in Google
Share

 Permalink
South African Journal of Industrial Engineering
On-line version ISSN 2224-7890
Print version ISSN 1012-277X
S. Afr. J. Ind. Eng. vol.28 n.4 Pretoria Dec. 2017
http://dx.doi.org/10.7166/28-4-1771
GENERAL ARTICLES
The effect of multi-trailer systems on the efficiency of container movements between the ship and the stacks at the Durban container terminal
T. GovenderI, #; M.J. BrooksII, *; C. BemontII
ITransnet Engineering, Durban, South Africa
IISchool of Engineering, University of KwaZulu-Natal, Durban, South Africa
ABSTRACT
Tractor-trailer units are the primary horizontal transport medium between the ship and the stacking area in container ports, and their efficient operation has a strong influence on loading and unloading rates. This paper presents a comparative study of the vessel loading and unloading procedure at the Port of Durban for conventional tractor-trailer units versus short multi-trailer systems. A discrete event simulation approach was used to model the terminal's operations using the two types of vehicles, and to analyse the effect on the terminal's performance and operating costs. The results of the study showed that the current fleet of tractor-trailer units can be replaced by a fleet of multi-trailer systems capable of carrying four twenty-foot equivalent units (TEUs) each, resulting in equivalent quay crane productivity while reducing the terminal's operating cost per shift for the horizontal transport subsystem.
OPSOMMING
Perd-sleepwa vragmotoreenhede is die primêre horisontale vervoermiddel tussen die skip en stapelarea in skeepsvraghouer-hawes en die effektiewe bedrywing daarvan het 'n beduidende invloed op die laai- en aflaaitempo's. Hierdie artikel vergelyk die voertuig laai- en aflaaiprosedure van konvensionele perd-sleepwa eenhede en multi-sleepwa eenhede by die Durban Hawe. 'n Diskrete gebeurtenis simulasie benadering is gebruik om die bedrywighede van die twee voertuigkonfigurasies te modelleer en om die invloed daarvan op die hawe se vertoning en bedryfskostes te bepaal. Die resultate toon dat die huidige vloot van perd-sleepwa eenhede vervang kan word met n vloot van multi-sleepwa eenhede. Hierdie multi-sleepwa eenhede kan vier twintig voet skeepsvraghouers tegelyk vervoer. Hierdeur word die ekwivalente kaaihyskraan se produktiwiteit verhoog terwyl die terminus se bedryfskoste per skof afneem.
1 INTRODUCTION
Terminal tractor-trailer systems are a crucial part of the waterside horizontal-transport subsystem of a port terminal, and connect the terminal's ship-to-shore subsystem and the storage subsystem. Their function is to provide a smooth, efficient and fast transfer of containers between the quay cranes (QCs) and the storage yard of the terminal and vice versa [1]. A multi-trailer system (MTS) allows for the transportation of a larger number of containers using a single tractor, as opposed to the traditional tractor-single-trailer vehicle configuration. An MTS consists of a prime mover that pulls several trailers, with each trailer having a carrying capacity of two 20-foot equivalent units (TEU). Port terminal operators regard the use of multi-trailer systems as a potentially attractive option to increase port terminal container movement efficiencies; but to date, the use of multitrailer systems in South African ports has not been demonstrated, and the potential effects have not been investigated. Using vehicles that are capable of transporting larger numbers of containers in a single movement may enable South African terminal operators to reduce labour and equipment costs without negatively affecting the terminal's performance. No study has been done in this regard, and the Port of Durban has not considered the use of trailer systems capable of carrying more than two TEUs in the container terminal environment. This paper focuses on an ArenaTM-based discrete event simulation study of the quayside loading and unloading operation at Pier 1 of the Durban Container Terminal, and on the effect of using a semi-trailer-led MTS capable of carrying four TEUs, as opposed to the currently used single-trailer tractor-trailer units (TTUs), which have a maximum carrying capacity of two TEUs between the ship and the stacking area.
2 MULTI-TRAILER SYSTEMS
Multi-trailer systems can be found in three types [2]:
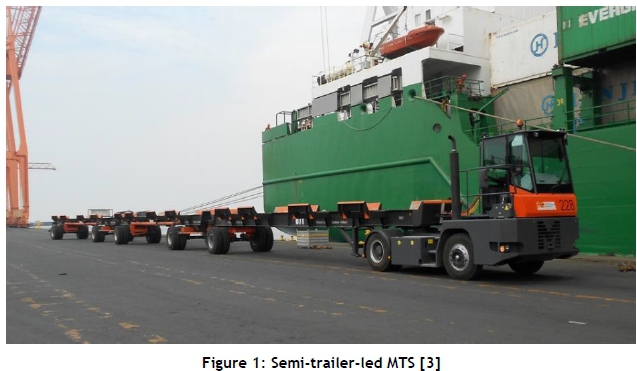
1. A semi-trailer-led MTS (short MTS) is made up of a terminal tractor, a lead semi-trailer, and a maximum of two drawbar trailers. During the operation of a semi-trailer-led MTS, the lead semi-trailer remains connected to the tractor, but the trailer set has a variable size (from one to three trailers).
2. A drawbar-trailer-led MTS (long MTS) is made up of several drawbar trailers pulled by a heavy-duty terminal tractor equipped with a ballast. The trailer set in a long MTS remains permanently intact.
3. A bidirectional MTS is similar to a drawbar-trailer-led MTS, except that the last trailer in the system has a drawbar installed at the rear, which allows the tractor to be connected on either side of the set. This configuration allows the MTS to change direction without turning around.
European container terminal operators have recently implemented MTSs with two to three trailers in a set for the short distance of the ship-to-stacks operation as a way to increase container transportation efficiency [2]. The individual trailers in the above configurations each have a carrying capacity of two TEUs, with the carrying capacity of each type of MTS being dependent on the number of trailers in the set. A semi-trailer-led MTS is usually kept to a maximum of three trailers when non-steerable axles are used. Longer configurations of the semi-trailer-led MTS and the drawbar-trailer-led MTS require steerable axles to improve manoeuvrability when turning the vehicle. Figure 1 shows an example of a semi-trailer-led MTS consisting of three trailers in the set.
3 CONTAINER TERMINAL OPERATION
3.1 Background
Steenken, Voß and Stahlbock [4] define a container terminal as "open systems of material flow with two external interfaces". These two interfaces are the quayside where ships are either loaded or unloaded with containers, and the landside system where containers are loaded or unloaded from external trucks or trains. When a container vessel arrives at a port, it is assigned to a berth equipped with QCs. The QCs are used to load/unload containers to/from the vessel. Unloaded containers are transported to the storage yard using equipment such as TTUs. These containers are then picked up by external trucks or placed on trains for transportation to their final destination. Containers to be exported are transported to the terminal by external trucks/trains, where they are then placed in the storage yard. The containers are subsequently transported from the yard to the QCs where they are loaded on to the vessel.
3.2 Quay crane operation
A QC is used at container terminals to load and unload containerised cargo from vessels. Unlike conventional cranes that use hooks, QCs are equipped with a handling device called a spreader; this is lowered on to the top of a container and then locked into its four corner castings. QCs usually transport a single container during movements; however, most modern QCs have the ability to move four TEUs at once (four 20-foot containers or two 40-foot containers).
3.3 Waterside horizontal transportation
Movement of containers between the quay cranes and the storage yard is achieved using equipment such as TTUs or MTSs. Certain container terminals use an alternative type of transporter known as a straddle carrier to move containers between the QCs and the storage areas. Trailer systems fall into the category of 'passive' vehicles since they are unable to lift containers by themselves. Loading and unloading of these trailers is done by cranes; either gantry or quay cranes.
3.4 Storage yard
The storage yard of a container terminal is a temporary storage area for containers waiting to be loaded on to a vessel for export, or imported containers waiting to be transported to their final destination by external trucks or train. Containers are stacked on top of each other, usually to a maximum of five or six containers high. For terminals using TTUs or MTSs as the horizontal transport medium, rubber-tyred gantry cranes (RTGs) are used to lift and place containers from the stacking areas on to the trailers and vice versa. Straddle carriers, however, are able to stack containers without the need for an RTG because they can lift and position containers.
4 DURBAN CONTAINER TERMINAL
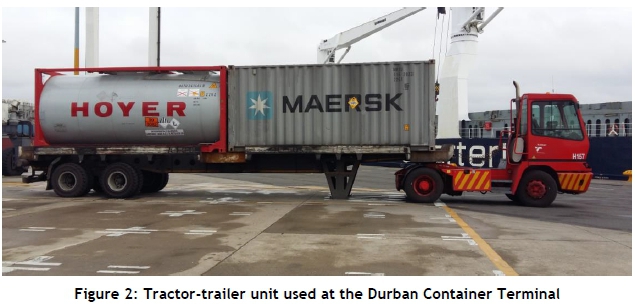
The Port of Durban has the largest container terminal in the Southern Hemisphere. It has seen continuous growth from 72,000 containers handled per year in 1979 to the current volumes of TEUs exceeding 1.2 million a year [6]. The Durban Container Terminal, which forms part of the Port of Durban, is divided into two areas: Pier 1 and Pier 2. Pier 1 uses TTUs to transport the containers between the QCs and the storage yard, where RTGs transfer containers between the trailer and the stacking area. A TTU used at the Durban Container Terminal is shown in Figure 2.
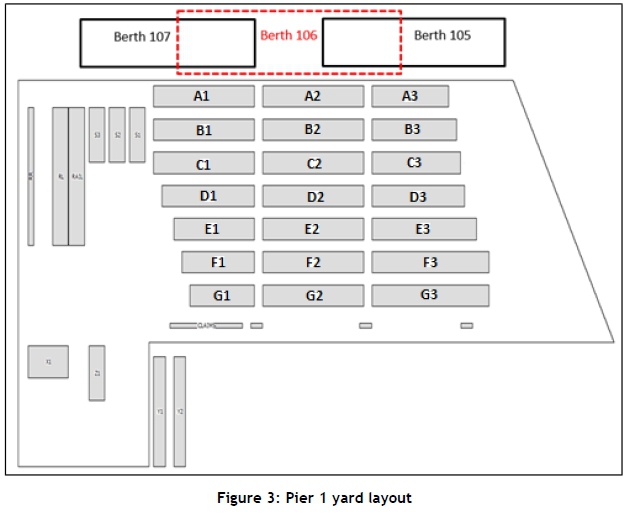
The operation at Pier 2 differs from Pier 1 in that straddle carriers are used as the transport medium between the QCs and the stacking area. Thus this study is restricted to a focus on Pier 1. Pier 1 has a total of three berths (berths 105 to 107). A vessel is said to be at berth 106 when it is positioned midway between berths 105 and 107. Six QCs service the three berths. The QCs and the RTGs at Pier 1 can only lift one container at a time. The storage yard for Pier 1 has 21 storage blocks (blocks A1 to G3), where containers are stacked five high and six wide. Figure 3 shows the yard layout of Pier 1.
4.1 Pier 1 vessel unloading procedure
Generally, three QCs are used per vessel for the offloading procedure at Pier 1 for vessels of more than 250 meters in length, which regularly have more than 2,000 containers on board. For smaller vessels (less than 250 meters), one or two QCs are used. The terminal uses a general rule of five TTUs per QC. However, the TTUs are not bound to a specific QC, but can service any QC being used to offload a vessel. Storage blocks D1 to G3 are allocated to imported containers (containers offloaded from a vessel). The terminal has a general rule of two RTGs per QC when determining the number of RTGs required for a vessel-unloading operation. These RTGs are positioned at the respective storage blocks to which the containers to be offloaded are assigned. The TTUs circulate between the QCs and the RTGs until all the containers to be unloaded from the vessel are stacked in the correct storage blocks. Unloaded containers are not given a predefined position in a stacking block; the position of a container is recorded after it has been placed. The quantitative data presented above was obtained from interviews with the operational manager at Pier 1 [7].
4.2 Pier 1 vessel loading procedure
Similarly to the vessel unloading procedure, three QCs are used per vessel for the loading procedure at Pier 1 for vessels in excess of 250 meters in length, which regularly have more than 2,000 containers on board. One or two QCs are used for smaller vessels. The general rule for determining the number of TTUs and RTGs required for the loading procedure is the same as that for the unloading procedure - that is, five TTUs and two RTGs per QC. Storage blocks A1 to C3 are designated for export containers (containers to be loaded on to a vessel). Unlike the vessel offloading procedure, the containers to be loaded on to a vessel have predefined blocks and stacking positions for storage in the yard. Five TTUs are designated to service one particular QC, and these TTUs will circulate between their assigned QC and the storage block that holds the containers to be loaded on to the vessel by the assigned QC. It is common practice for the terminal to keep most of the containers that are designated to be loaded on to the vessel by a particular QC in a single storage block. Export containers are generally stacked in the yard according to the order in which they are to be loaded on to the vessel - that is, containers to be loaded towards the bottom of the vessel are usually stacked towards the top end of the storage blocks. This is done in an attempt to minimise container shuffling in the yard - although this is a common occurrence. As with the information presented in section 4.1, the quantitative data for the vessel loading procedure followed at Pier 1 was obtained from interviews with the operational manager [7].
5 EXISTING PORT TERMINAL SIMULATION STUDIES
Several analyses of port terminals and their cargo transportation activities using simulation techniques can be found in the literature [4,8,9,10,11,12]. While queuing theory and mathematical algorithms are used by some authors to model the complex activities of a port terminal, simulation modelling has been adopted by numerous researchers as an alternative method to analyse port terminal systems at the macroscopic level of the terminal's operations. The use of queuing theory and other analytical methods for modelling provides acceptable results for non-complex systems; however, for systems where the probability distributions used to represent the service time of the various activities involved differ from the Erlang family, analytical methods have been found to lead to unsatisfactory results [8]. The complex and dynamic nature of a container terminal's operations can also make it difficult to obtain theoretical solutions using analytical methods [9].
Robinson [10] describes a discrete event simulation (DES) as "a simulation which models the operation of a system as a discrete sequence of events in time". Each event occurs at a particular instant in time, and marks a change of state of the system. The ability to model complex systems accurately has led various simulation studies to use DES for port terminal operations. A few authors have conducted studies on the operation of container terminals using DES. Adam [11] used DES to identify and investigate logistic bottlenecks at the Malé Commercial Harbour. The model was used to analyse vessel berthing time, berth capacity, yard capacity, and utilisation of the various container handling equipment at the port. The results showed that berth capacity was the main contributor to the long queues and ship delays experienced at the harbour. Kotachiav, Rabadib and Obei [12] proposed a generic DES that modelled container terminal port operations with various resource types that included the different container handling equipment. The analysis considered the effect of varying model inputs to measure the impact on the outputs, including equipment utilisation, waiting times, and throughput. Park [5] presented a DES model to analyse the performance of four Korean container terminals. The model focused on obtaining the optimal container throughput for each terminal, and the associated financial implication for the Korean Busan Container terminal for the optimum throughput. Data were collected at each of the terminals and used as inputs into the model created. The results showed that, for an optimal throughput of 550 000 TEU for the Korean Busan Container terminal, the associated social costs rise sharply, while there is only a minimal increase in corporate profit. Kulaka, Polata and Guentherb [13] developed an ArenaTM-based simulation model to analyse the operations of the Haydarpasa Container Terminal. This was aimed at identifying potential bottlenecks at the quay cranes, storage yard, and transportation system by examining the terminal's equipment productivity, utilisation, and average waiting times. Gori and Petrelli [14] developed a micro-simulation model using discrete events to analyse the operations at the Port of Civitavecchia. The entire process from vessel arrival to departure is modelled, including ship navigation to the berth, handling operations at the berth, and external truck arrivals. The model allows for specific calibration for each kind of ship and the type of freight transported.
The research presented by the above authors generally focused on port performance at a macroscopic level. Little work has been published on a dedicated analysis of the waterside horizontal system. Recently, Kulatunga et al. [15] investigated the effect of changing a container terminal's equipment fleet size on the performance of the terminal during the vessel unloading procedure only. The research methodology was twofold: the performance and operational efficiency for a generalised container terminal layout was determined analytically; thereafter, an optimised layout was determined using DES. The optimum TTU fleet size was then determined using DES for the previously determined optimal yard layout for a minimised QC idle time. One of the few available reports on the use of MTSs in container terminals was a dedicated investigation into the efficiency of MTSs used for transporting containers from the QC to the stacking area, conducted recently by Goussiatiner [2] using DES. The focus of the investigation was on the influence that the travel distance between the quayside and the stacking area has on the optimum trailer fleet size and container carrying capacity per MTS for maximised crane productivity. The study, which analysed the vessel offloading operation only, showed that for a ship-to-stacks distance exceeding 500 metres, a fleet of single TTUs can be replaced by a smaller fleet of double trailer MTSs while maintaining the same crane productivity at a lower operating cost per shift.
The study described here builds on the work done by Goussiatiner [2], who considered only a single QC and RTG for the unloading operation with assumed statistical distributions to represent the transporter cycle times. As an extension to that study, this study considers both the vessel loading and unloading operations with a larger fleet of QCs, TTUs, and RTGs, each represented by statistical distributions obtained from physically measured data sets. The model created in this study considers each of the individual activities of the various transporters during the loading and unloading process, and represents the cycle times of these activities as separate statistical distributions, whereas Goussiatiner adopted the use of single statistical distributions to represent the holistic cycle time for each type of transporter. Similarly, this study looks at reducing the operational costs of a container terminal by using MTSs instead of TTUs.
6 MODEL DEVELOPMENT
DES models were developed using Arena™ 14.0 to simulate the vessel loading and unloading procedure at Pier 1 of the Durban Container Terminal for the TTU vehicles currently used. The models were set up for a vessel with a length of 300 meters and a carrying capacity of 2,000 containers with a 45% 20 ft : 55% 40 ft container ratio [16]. The vessel length, and the quantity and ratio of containers selected, was based on the average vessel calling at Pier 1 of the Durban Container Terminal [6]. The vessel was positioned at berth 106 for each scenario. Three QCs, fifteen TTUs, and six RTGs were used in the simulations to conform to the general equipment assignment rule used by the terminal. The models were set up to represent the general procedure observed at the terminal for both the loading and the offloading procedures. The models were then modified by replacing the TTU fleet with a fleet of short MTSs capable of transporting four TEUs in a single movement. The aim of the simulation was to determine whether the fleet of TTUs currently used at the Durban Container Terminal could be replaced by a smaller fleet of short MTSs to reduce operational costs, without negatively affecting the performance of the terminal.
6.1 Vessel unloading model
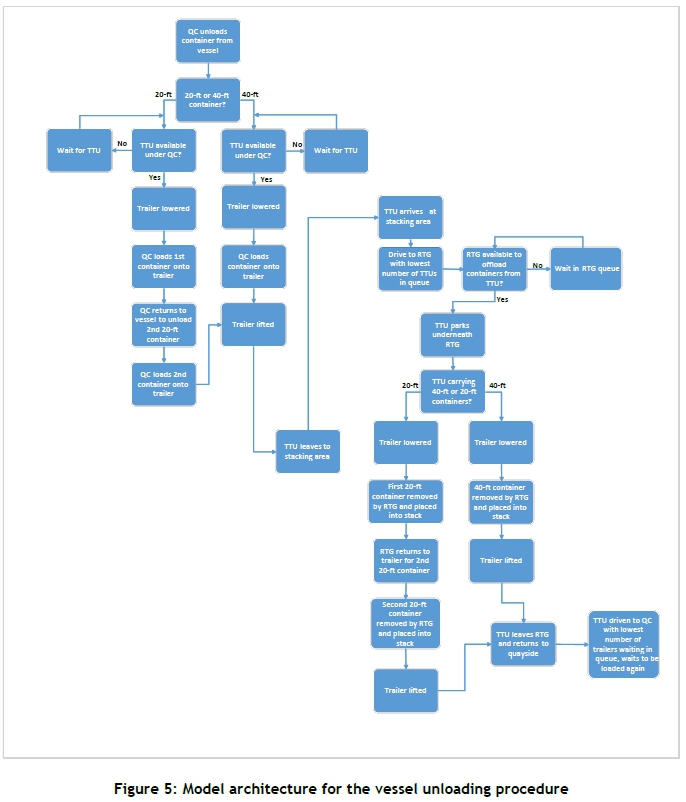
The storage blocks selected for the offloading simulation model are F1 to F3 and G1 to G3 (Figure 3). Each of these storage blocks operates with a single RTG. The three QCs are spaced equally along the length of the vessel, while the RTGs are positioned at the middle of each respective storage block. The QCs have an equal number of each type of container to unload from the vessel. When a QC offloads a container from the vessel, a TTU on to which to load the container is requested by the QC. If a 20-ft container is loaded, the trailer will wait underneath the QC for another 20-ft container to be loaded before it leaves for the stacking area. This is consistent with the operations at the terminal, to ensure that a TTU is loaded to its maximum carrying capacity of two TEUs to reduce the number of trailer movements required [6]. When the TTU leaves for the stacking area, it will travel along the side between blocks A1 to F1 and enter the stacking area between blocks F and G. Depending on RTG availability, a TTU will either drive up to a non-busy RTG or join a queue with the least number of TTUs at an RTG waiting to be served. The RTGs stack containers five high by six wide in the storage blocks. Once the TTU has been completely unloaded by the RTG, it will return to the quayside and be loaded by a QC that has requested its service, restarting the cycle. The TTUs are not bound to a specific QC or RTG for each operational practice. To compare the performance of the unloading procedure when using a fleet of MTSs instead of TTUs, a modified model was created with vehicle capacities of four TEUs to simulate a short MTS with two trailers in its set. Figure 4 shows the path followed by the vehicles. Figure 5 shows the model architecture for this procedure.
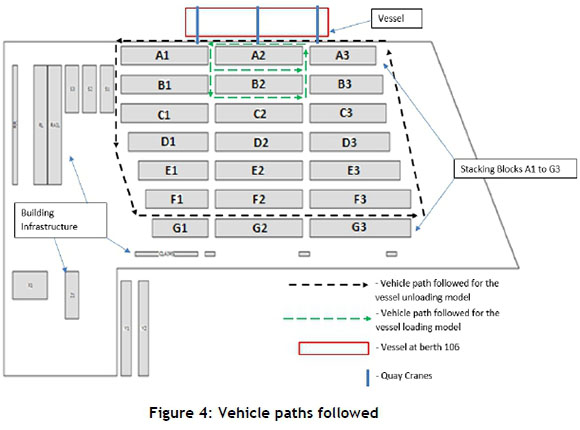
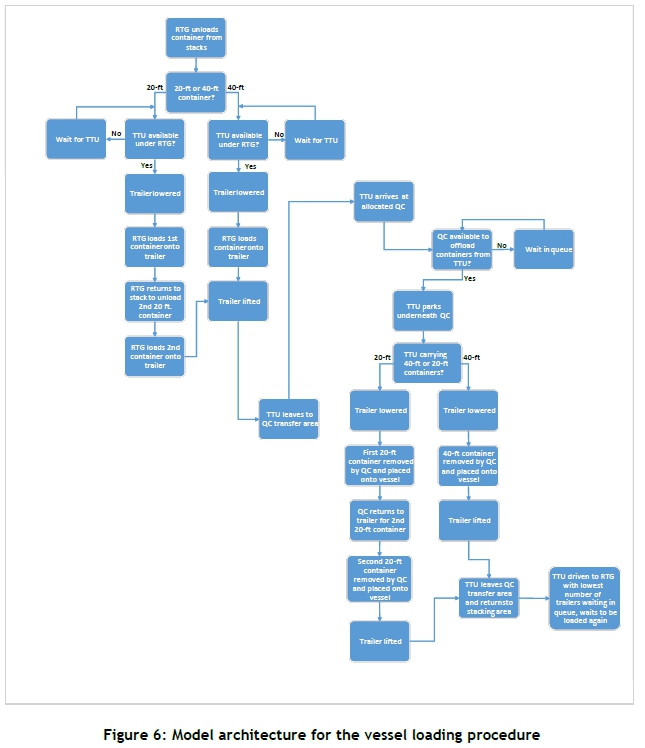
The storage blocks selected for the loading operation were blocks A2, B2, and C2 (see Fig. 4), analogous to the stacking configuration used at the Durban Container Terminal for the loading of vessels at berth 106. Two RTGs were assigned to each block, with each RTG having an equal number and the same type of container to be offloaded from the stacking area. All the containers from an individual block were assigned to a specific QC: containers from block A2 were assigned to QC 1, which was positioned towards the left-hand end of the vessel; containers from block B2 were assigned to QC 2, which was positioned at the middle of the vessel; and containers from block C2 were assigned to QC 3, which was positioned towards the right-hand end of the vessel. Unlike the multi-serving TTUs from the vessel unloading operation, the five TTUs per QC for the vessel loading operation circulate between a single QC and its corresponding storage block. The TTUs are loaded with either two 20-ft containers or one 40-ft container by the RTGs, and then travel to the respective QC to be offloaded. Once they have been offloaded, the TTUs travel back to the stacking area to be loaded with containers again, repeating the cycle until the storage blocks are void of all containers. To compare the performance of the loading procedure when using a fleet of MTSs, a modified model was created with vehicle capacities of four TEUs to simulate a short MTS with two trailers in the set. Figure 6 shows the model architecture for the vessel loading procedure.
6.3 Model inputs
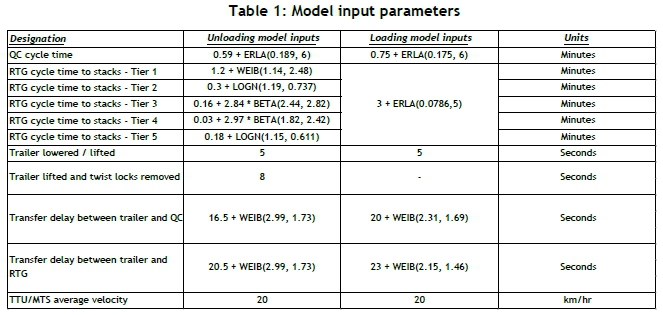
Qualitative data were obtained from interviews with the operational staff at the terminal about the operation and performance of the terminal with the current TTU setup, for both the loading and unloading procedures [6]. Quantitative data were obtained by conducting time studies at the terminal for the individual core processes that make up the complete operations. Data sets for the QC cycle time, RTG cycle times, and the various transfer delays observed were collected. Arena's™ Input Analyzer was used to assign appropriate statistical distributions to the collected data sets, which were used as inputs in the different models. Distance measurements were conducted for the TTU routeing from the quayside to the stacking areas and incorporated into the model. Table 1 shows the model input parameters used for the simulation.
It is noted that in Table 1 a single statistical distribution is used to represent the RTG cycle time in the loading model, as opposed to the RTG tier-based cycle time distributions used in the unloading model. This is due to the shuffling of containers in the yard during the loading process, where containers in the stack are sometimes moved around to get the next container to be loaded on to the vessel in the correct sequence. For the vessel unloading model, 20 per cent of each container type (20-ft or 40-ft) is assigned to a single tier, since different container types are not stacked on top of each other in the yard. An average velocity of 20 km/h was used to model the TTU/MTS movement (loaded and unloaded), analogous to the velocities used in the studies conducted by Goussiatiner [2] and Yun and Choi [16]. This velocity is approximately consistent with the average TTU velocity at the Durban Container Terminal - a maximum speed limit of 30km/h for these vehicles. The time involved to align the RTG or QC spreader when lifting a container from a trailer, and to align the trailer to accept a container from an RTG or QC, was based on observation and modelled as a transfer delay using Weibull distributions.
7 RESULTS
Each of the models was run for 20 statistically independant replications. The average values of the results are reported below.
7.1 Model validation
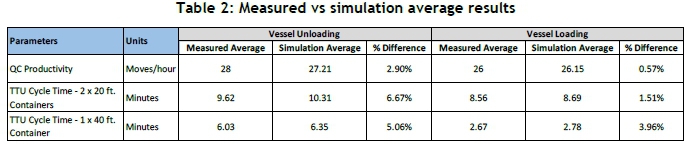
Quay crane productivity, which is measured as the average number of containers moved per hour by the QCs, is the parameter used by the terminal to measure its vessel loading and unloading performance, as this level of productivity determines the total time required to load/offload a vessel. The total number of containers that are loaded/unloaded from a vessel is divided by the sum of the individual operation times for the QCs used, yielding the average QC productivity for the vessel concerned. The general terminal performance for the unloading procedure is 28 moves per hour, whereas for the loading procedure 26 moves per hour are most commonly achieved. The simulation results for the average QC productivity of each operation was validated against the general terminal performance. The average TTU cycle time (measured from arrival underneath the QC until returning to the quayside) was recorded for both operations for the scenarios of carrying a single 40-ft container or two 20-ft containers, and compared with the average simulation results. Table 2 shows the comparison between the simulated and measured results for each procedure.
7.2 Vessel unloading model results
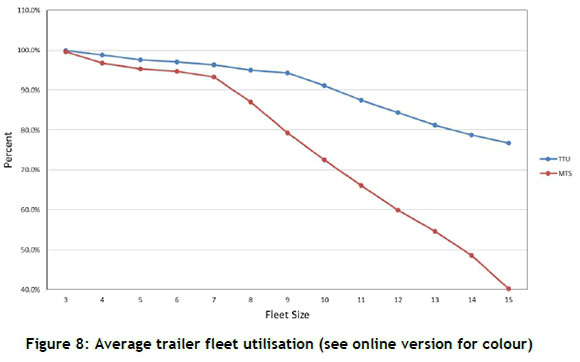
The average QC productivity results for a varying fleet size of TTUs and MTSs was obtained from the respective unloading simulations and graphed, as shown in Figure 7 below. The number of QCs and RTGs in the system was kept constant to analyse the effect that the trailer type and fleet size has on the terminal performance for the unloading procedure. For an equivalent fleet size of fifteen vehicles each, the MTS allows the QCs to operate at a productivity of 28.48 moves per hour - marginally higher than the QC productivity achieved with the current TTU setup. This is attributed to the average QC 'waiting for a trailer' delay being lower when using a fleet of MTSs. Waiting for trailers is constantly experienced in a terminal because trailers arrive at irregular intervals at the QCs. For equivalent fleet sizes, the average QC 'waiting for a trailer' delay will be lower for a fleet of MTSs, since this delay will only be experienced after every four 20-ft containers or two 40-ft containers have been offloaded from the vessel; in comparison, the QCs have to wait for a trailer after every two 20-ft containers or one 40-ft container for a fleet of TTUs. The 'waiting for a trailer' delay can be eliminated by using a large number of trailers in the fleet; however, this will lead to low equipment utilisation levels and to congestion at the terminal [2] (see Figure 8). Of greater significance is the smaller fleet size of MTSs required to maintain the same QC productivity as that of the TTU fleet; the fifteen TTUs can be replaced by nine MTSs without negatively affecting QC productivity. Figure 7 shows that the TTU fleet requires additional vehicles to maximise the QC productivity, whereas the QCs are able to operate at maximum productivity with only ten MTSs in the system.

7.3 Vessel loading model results
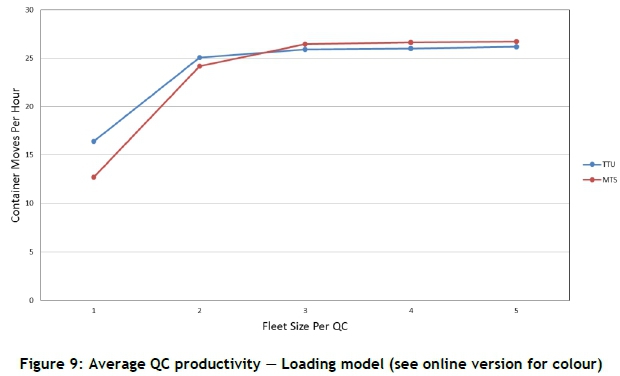
The average QC productivity results for a varying fleet size of TTUs and MTSs was also obtained from the respective loading simulations, graphed in Figure 9. These results were obtained for a varying fleet size per QC since the vehicles are dedicated to a particular crane - unlike the unloading procedure, where the entire fleet services all three QCs. The results were recorded for a maximum fleet size of five vehicles per QC. Figure 8 shows that there is a small increase in the QC productivity for the vessel loading procedure when using an equivalent fleet of TTUs and MTSs of more than three vehicles. QC productivity is maximised when using three TTUs per QC, which shows that there are more TTUs in the current system (15) than required.
The DES results show that using MTSs for the ship-to-stacks loading procedure is not very beneficial; three TTUs per QC create almost the same crane productivity as three MTSs per QC, and the performance of both vehicles can be considered equivalent. As can be seen by the flattening of the curve in Figure 9, when scheduling a minimum of nine TTUs in total for three QCs for the loading procedure, the QC 'waiting for a trailer delay' is reduced to zero.
7.4 Discussion
The simulation results show that a significantly reduced fleet of MTSs can be used for the vessel unloading procedure at the Durban Container Terminal without negatively affecting crane productivity, and hence terminal performance. However, for the loading procedure, the use of MTSs shows minimal or no benefit.
For the unloading procedure using TTUs, the system can be viewed as having three producers (QCs) and six consumers (RTGs) of containers. The average RTG cycle time is marginally less than the average QC cycle time, meaning that the delay between trailer arrivals at the QC is largely dependent on the travel time of the trailers. Because an MTS has to wait longer underneath a QC, the delay between trailer arrivals is experienced less frequently, and a smaller fleet of MTSs can replace the TTU fleet for equivalent crane productivity.
For the loading procedure using TTUs, the system can be viewed as having three dedicated sets of two producers (RTGs) and one consumer (QC) of containers. In this setup, even though the producers have a cycle time about double that of the consumer, the supply of containers by the two RTGs collectively creates an over-supply at the QC. This creates a queue of trailers at the QC waiting to be unloaded. Figure 9 shows that the delay between trailer arrivals at the QC is only experienced for less than three TTUs or MTSs per QC in the system. Figure 9 also shows that, for equivalent fleet sizes of less than three, using MTSs creates a marginally lower QC productivity than its TTU counterpart because an MTS has to wait much longer than a TTU underneath the RTG. This leads to long delays between trailer arrivals at the QC, as there are not enough empty trailers for continuous loading by the RTGs and sending to the QCs.
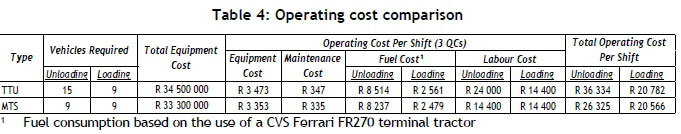
The results show that a fleet of semi-trailer-led MTSs consisting of two trailers in the set can be implemented at the terminal. To maintain the current productivity of the terminal, nine two-trailer MTSs can be used per three QCs during a vessel unloading process. For the loading process, the same fleet size of MTSs can be used, with either one or two trailers in the set. The data shown in Table 3 were used to determine the cost per shift to run each vehicle type. Table 4 shows the cost comparison per shift for each operation and vehicle type.
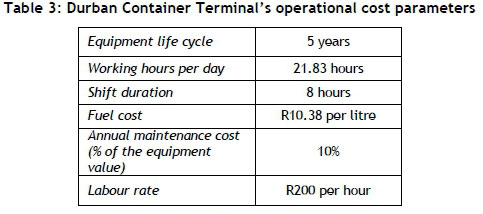
Even though fifteen TTUs are used in practice for both unloading and loading processes, nine vehicles were used for the cost analysis for this operation, since this is the number of vehicles required to achieve maximum crane productivity. From Table 4 it can be seen that the MTS fleet has a lower operating cost than the TTU fleet for loading and unloading operations. While the equipment unit cost is higher for an MTS, the total equipment cost is lower than for a fleet of TTUs, since the required fleet size for equal crane productivity is smaller. This leads to a lower equipment and maintenance cost per shift for the MTS. This MTS equipment cost is based on the average unit price of MTSs designed and manufactured by European original equipment manufacturers, as no locally manufactured product is currently available. As the MTS prime mover pulls a greater load than its TTU counterpart, the fuel consumption over a distance is larger for the MTS; however, because the MTS can move twice the number of containers in a single movement compared with a TTU, the overall distance travelled to move all containers to the stacking area is half that of the TTUs. This means that the fuel usage per shift is lower for the MTS system. The main contributor to savings when using a fleet of MTSs is a reduction in labour costs in the unloading procedure. The labour cost-saving when using the required fleet size of MTSs for vessel unloading makes up 96 per cent of the overall 27 per cent saving in operating costs. The savings when using MTSs for the loading procedure is marginal; a saving of about one per cent in operating costs can be expected when compared with the TTU fleet.
8 CONCLUSION
The study showed that a fleet of semi-trailer-led MTSs, each with a capacity of four TEUs, can be used at Pier 1 of the Durban Container Terminal to reduce operating costs while maintaining the same terminal performance as the current fleet of TTUs. Using a fleet of MTSs for the unloading procedure has shown significantly greater benefits than for the loading procedure; however, the system can be used for both operations without negatively affecting either terminal performance or operating costs. The results of the study show that operational costs for the vessel unloading procedure can be reduced by about 27 per cent when using nine MTSs instead of the currently used fifteen TTUs, while also increasing productivity. The reduction in labour costs could potentially be viewed negatively by the respective labour unions representing the tractor drivers, with strong opposition to implementing MTSs. The implications of reducing labour need, therefore, to be addressed by the terminal and the respective labour representatives to determine how multi-trailer systems can be implemented at the terminal for the benefit of both the port operator and the workforce.
This study focused only on Pier 1, since Pier 2 uses straddle carriers. However, a similar study could be conducted for Pier 2 to determine whether the terminal would benefit from switching to the use of MTSs. Further research into the influence of multiple vessels berthed at Pier 1, varying the stacking areas for container storage, and using QCs and RTGs with greater lifting capacities (more than one TEU) could be conducted to determine the resulting influence on operational costs and port productivity for the Durban Container Terminal. This study is also intended to inspire further research into the applicability and benefit of MTSs for container movement at other major ports within South Africa, including research into an indigenously designed MTS encompassing the technical and functional requirements of the trailer equipment used at these facilities.
REFERENCES
[1] Kemme, N. 2013. Design and operation of automated container storage systems. Springer-Verlag, Berlin, pp. 20. [ Links ]
[2] Goussiatiner, A. 2012. Efficiency of multi-trailer systems for ship to stacks container transportation. Port Technology International, Edition 43, pp. 78-82. [ Links ]
[3] Port strategy, 7 May 2012. [Online] Available: http://www.portstrategy.com/news101/products-and-services/mafi-rolls-along-nicely-in-manila. [Accessed 26 March 2017]. [ Links ]
[4] Steenken, D., Voß, S. & Stahlbock, R. 2004. Container terminal operation and operations research: A classification and literature review. OR Spectrum, 26(2004), pp. 3-49. [ Links ]
[5] Park, Y.-M. 2003. Berth and crane scheduling of container terminals. PhD thesis, Pusan National University, South Korea. [ Links ]
[6] Transnet Port Terminals. 2013. Durban Container Terminal. [Online] Available: https://www.transnetportterminals.net/Ports/Pages/Durban_Container.aspx. [Accessed 26 October 2017]. [ Links ]
[7] N. Murugan. 2016. Operation of the Durban Container Terminal. [Interview]. 15 May 2016. [ Links ]
[8] Ramani, K. 1996. An interactive simulation model for the logistics planning of container operations in seaports. Simulation, 66, pp. 291-300. [ Links ]
[9] Carteni, A. & de Luca, S. 2009. Simulation of a container terminal through discrete event approach. Technical Paper. Department of Civil Engineering, University of Salerno. [ Links ]
[10] Robinson, S. 2004. Simulation: The practice of model development and use. Chichester: Wiley. [ Links ]
[11] Adam, S. 2009. Simulation and analysis of port bottlenecks: The case of Malé. Master's thesis, Lincoln University. Available:https://researcharchive.lincoln.ac.nz/bitstream/handle/10182/Adam_MApplSc [ Links ]
[12] Kotachiav, M., Rabadib, G. & Obei, M.F. 2013. Simulation modelling and analysis of complex port operations with multimodal transportation. Procedia Computer Science, 20, pp. 229-234. [ Links ]
[13] Kulaka, O., Polata, O. & Guentherb, H.-O. 2011. Performance evaluation of container terminal operations. Technical Paper. Available: http://opolat.pamukkale.edu.tr/docs/Performance%20Evaluation%20of%20Container%20Terminal%20Operations.PDF [ Links ]
[14] Gori, S. & Petrelli, M. 2015. A microsimulation model for real time management of port activities. Technical Paper. Available: imet.gr/Portals/0/Intranet/Proceedings/SIGA2/petrelli-gori[1].pdf [ Links ]
[15] Kulatunga, A., Mekala, R. & Luthfi, M.A.L. 2011. Determining the best fleet sizing of a container terminal for a given layout, in Proceedings of the 2011 International Conference on Industrial Engineering and Operations Management, Kuala Lumpur, Malaysia. [ Links ]
[16] Yun, W.Y. & Choi, Y.S. 1999. A simulation model for container-terminal operation analysis using an object- oriented approach. International Journal of Production Economics, 59, pp. 221-230. [ Links ]
Submitted by authors 2 May 2017
Accepted for publication 1 Nov 2017
Available online 13 Dec 2017
* Corresponding author brooks@ukzn.ac.za
# The author was enrolled for an MSc Eng (Mechanical) degree in the Discipline of Mechanical Engineering, University of KwaZulu-Natal, South Africa

