


Servicios Personalizados
Articulo
 Inglés (pdf)
 Articulo en XML
 Referencias del artículo
Indicadores

Links relacionados
-
 Citado por Google
 -
 Similares en Google
Compartir

 Permalink
South African Journal of Industrial Engineering
versión On-line ISSN 2224-7890
versión impresa ISSN 1012-277X
S. Afr. J. Ind. Eng. vol.28 no.4 Pretoria dic. 2017
http://dx.doi.org/10.7166/28-4-1726
GENERAL ARTICLES
An investigation into the normalisation of water and energy usage in the brewery industry
J.C. KirsteinI; A.C. BrentII, III, *
IGraduate School of Technology Management, University of Pretoria. South Africa
IIDepartment of Industrial Engineering, Stellenbosch University, South Africa
IIISustainable Energy Systems, Engineering and Computer Science, Victoria University of Wellington, New Zealand
ABSTRACT
Benchmarks are often used to assist brewers in identifying improvement opportunities; but a comparison of water and energy performances in breweries is deficient without normalising for differences between facilities. The normalisation of water and energy use was subsequently investigated, using SABMiller breweries as a case study. Drivers of water, electricity, and thermal energy usage obtained from the literature were selected, rationalised, and ranked in a Delphi survey of industry experts, and correlated with data from 64 SABMiller sites. The main drivers identified, and the data from 58 SABMiller sites, were then used to develop multi-variable linear regression (MVLR) models. The models, tested with data from six separate SABMiller sites, were able to predict water, electrical, and thermal energy usage to within a seven per cent error. By eliminating the variability in drivers within the control of brewery staff, the MVLR models were used to normalise the performance indices, and enabled direct comparisons between plants.
OPSOMMING
Maatstawwe word dikwels gebruik om brouers te help met die identifisering van geleenthede vir verbetering; maar 'n vergelyking van water en energie vertonings in brouerye is gebrekkig sonder normalisering vir verskille tussen fasiliteite. Die normalisering van water en energie gebruik is dienooreenkomstig ondersoek, deur die gebruik van SABMiller brouerye as 'n gevallestudie. Drywers van water, elektrisiteit en hitte-energie gebruik, verkry uit die literatuur, is gekies, gerasionaliseer en ingedeel in 'n Delphi-opname van kundiges in die bedryf, en gekorreleer met die data van 64 SABMiller fasiliteite. Die belangrikste drywers is geïdentifiseer, en data van 58 SABMiller fasiliteite, is toe aangewend om multi-veranderlike lineêre regressie (MVLR) modelle te ontwikkel. Die modelle, getoets met data vanaf ses aparte SABMiller fasiliteite, is in staat om water, elektrisiteit en hitte-energie gebruik te voorspel binne 'n sewe persent fout. Deur die uitskakeling van die variasie in drywers binne die beheer van brouery personeel, is die MVLR modelle gebruik om die prestasie-indekse te normaliseer, en is die direkte vergelykings tussen fasiliteite moontlik gemaak.
1 INTRODUCTION
The rise in demand for, and cost of, resources is increasing the brewing sector's risk from a sustainability perspective [1]. In response, brewers globally have embarked on efficiency improvement programmes, often accompanied by ambitious, publicly committed targets [2]. Surveys in the brewing industry confirm that the brewing community is rapidly improving its specific water and energy usages, and that the rate of improvements made in the top-performing plants is similar to the sector average, as identified by BBPA [3], BIER [4], and Campden BRI [5]. The variability in plant performances thus cannot be fully ascribed to poor performance [6], but should also include differences between plants that influence performance potentials.
Benchmarks are often used to assist brewers in identifying improvement opportunities; but comparisons of water and energy performances in breweries are deficient without normalising for differences between plants. Published benchmarks are often not normalised for differences between plants, but instead are given in ranges (NRC [7], EBC [8], WBG [9]), making them difficult to use when determining improvement opportunities.
Many drivers for water and energy efficiencies are identified in the literature, but there seems to be no consensus on which drivers are the most important ones to consider [2]. Most of the drivers from the literature are common to both water and energy efficiencies; but Pennartz [10] and Heuven et al. [11] reported that they found no correlation between water and energy usages, and that no correlations could be found in their survey data of 225 breweries [11]. This was unexpected, as surveys showed improvements in both water and energy performances at most sites [3, 4, 5].
1.1 Objectives of this paper
There is limited understanding from the literature of how benchmarking could be done. The normalisation of performances, or benchmarks, would enable more accurate comparisons between plants to be made, and potential improvements to be determined. This paper thus proposes variables (differences) and a normalisation model to enable breweries that have different water and energy usage performances to be compared for the purpose of benchmarking, and to identify improvement opportunities.
The research questions, then, were:
• What are the main variables (differences between breweries) that influence the water and energy performance potential of plants?
• How can these variables be accounted for in normalising the performance, or in benchmarks?
2 METHOD
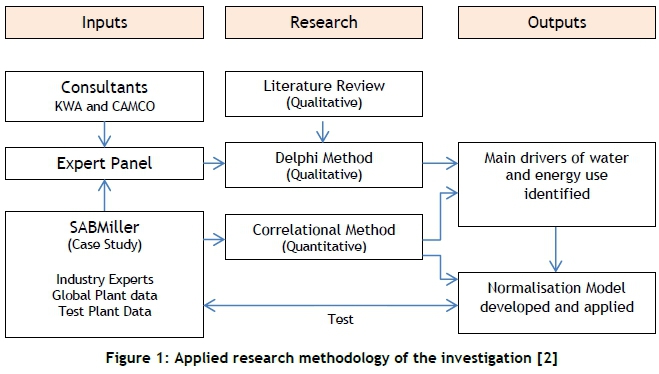
In order to answer the research questions, a literature review, a Delphi survey, and correlational methods were used, with SABMiller plants across the globe providing data as multiple case studies, as shown in Figure 1. The research design combined quantitative (correlation) and qualitative (Delphi survey and literature study) methods in order to triangulate findings and improve validity [12, 13, 14].
SABMiller was used as the overall case for the study, with 64 (sixty-four) individual plants used as multiple-case studies for inputs into the quantitative correlation method, and ultimately for testing the normalisation model that was developed through the research process.
The Delphi survey's panel consisted of beer industry consultants and industry experts from within SABMiller - technical hub leaders and process specialists; and the literature review was used as an input into the first round of the survey to assist the panellists with a point of origin for their thoughts [15].
The Delphi survey and correlation method were used collectively to produce a prioritised list of drivers that were considered in the development of a normalisation model. Predicted relative water and energy usage ratios were used to test the normalisation model, and then to compare the results with plant data from six SABMiller sites.
3 CONCEPTUAL METHOD FOR THE INVESTIGATION
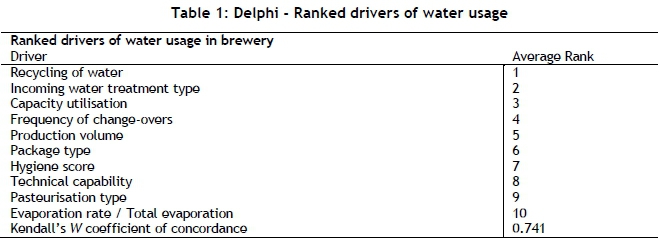
The list of drivers from Kirstein [2] was incorporated into the first round of the Delphi survey, together with a breakdown of water and energy users in a brewery. This assisted the participants to consider the various process areas, while assessing the impact of the drivers on a facility level. From the results of the Delphi survey, a prioritised list of 10 (ten) key drivers was obtained for use in the normalisation model. The level of consensus reached in the Delphi survey was measured by Kendall's W coefficient of concordance, as proposed by Schmidt [16].
A correlation analysis of the SABMiller plant data and the drivers identified from the literature was conducted to determine whether other drivers should be considered in the model, and to assess whether the drivers identified by the Delphi survey were supported by quantitative data to be key drivers. Where a driver consisted of more than one variable (such as packaging mix or water treatment type), normalisation correction factors were used from internal benchmarks to transform the variables into a single 'equivalent' driver that could be used for the regression model, as shown by Wouda [17].
To protect the confidentiality of the SABMiller data, the plant usages were first converted into usage indices by dividing each site's usage by the usage of the best-performing plant (of those assessed). Six sites (one from each global hub) were excluded from the development of the multi-variable linear regression (MVLR) model, for the purpose of testing the model's accuracy once developed.
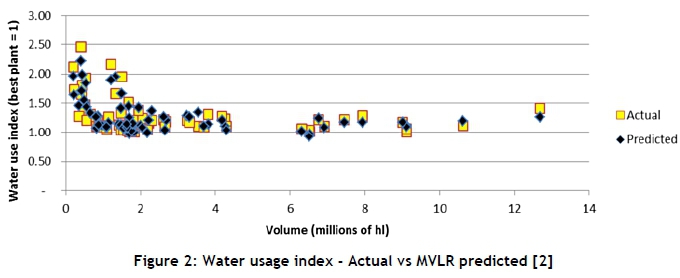
An MVLR model was developed for water and energy usage indices - as shown in Figure 2 for water, as an example - using the method of least squares to determine the best fit for the data. The variables indicated by black dots in Figures 3 to 5 (in the results section), were included in the development of the model.
The MVLR takes the form:
y=m1x1+m2x2+...+mnxn+c
where:
• y is the predicted water, electrical, or thermal energy index usage being calculated;
• m, are the coefficients calculated for the independent variables x,-;
• x, are the respective driver values of each plant being calculated; and
• c is a constant.
The adjusted coefficient of determination by Ling and Eang [18] and the F-statistic were used to determine the proportion of the variance explained by the MVLR model, and to determine whether the observed relationship between dependent and independent variables occurs by chance, or whether it can reasonably be ascribed to the variables under investigation.
The MVLR model was tested by comparing actual water and energy ratios of six diverse SABMiller case-study plants (one from each global hub) with the regression model's predicted usages, as well as relative rankings. The expectation was that the model would be able to predict closely (within 10% error) the actual usages, and predict correctly the relative rankings of the plants under investigation.
The normalisation of plant performance was done by eliminating the variance in drivers considered to be under the control of the plant. The resulting 'normalised' performance, when compared with actual performance, could be used as a measure of a plant's potential for improvement.
4 RESULTS AND DISCUSSION
The drivers identified in the literature review of Kirstein [2] were introduced into the first round of the Delphi survey. Through iterative rounds, ranked lists of drivers were established, given in Tables 1 to 3. The survey revealed a strong consensus among the participants, as measured by Kendall's W coefficient of concordance [16].
Although recycling of water was identified as the driver with the highest potential to influence site water usage, it was excluded from the correlation and normalisation analysis due to the limited number of plants actively recycling water. Instead, recycled water was added back into the water usage ratios to eliminate it as a variable.
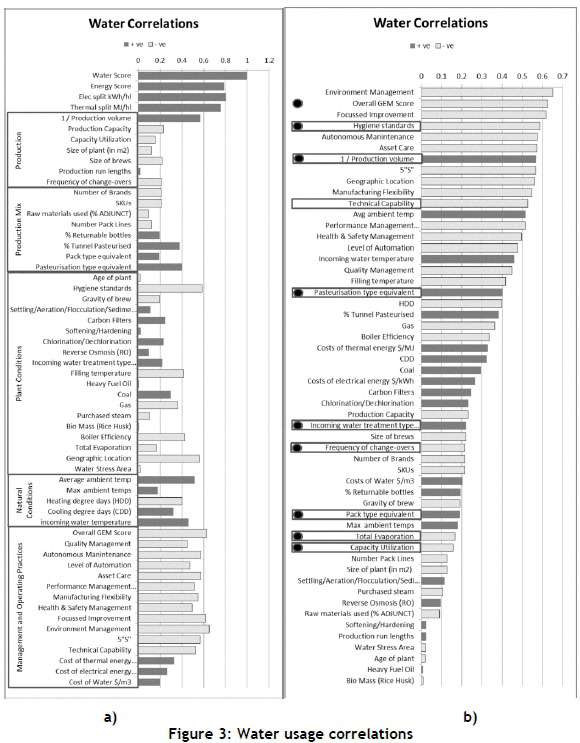
4.1 Correlation analysis - Water
Figure 3 shows the results of the correlation analysis of the drivers identified from the literature, and the specific water usage of the 64 sites. The dark bars indicate a positive correlation (increase in the measure of the driver corresponds with an increase in the specific water usage, and vice versa), and the light bars indicate a negative correlation (increase in the measure of the driver corresponds with a decrease in the specific water usage, and vice versa).
From Figure 3 a), representing the breakdown of drivers from the literature, the following observations are made:
• Of all the drivers, the strongest correlation with specific water usage are the specific electrical and thermal energy usages. This contradicts the findings of Pennartz [10] and Heuven [11].
• The category of drivers that seem to have the strongest correlation is 'management and operating practices' as measured by the SABMiller Global Evaluation of Manufacturing (GEM) audit scores.
• Of the 'production' variables, the inverse of the production volume revealed the strongest correlation to specific water usage. It is interesting to note that the size of the plant and the frequency of change-overs revealed negative correlations, while Delphi participants (and the literature reviewed) expected positive correlations. This can be explained by the tendency for breweries with larger volumes to boast larger footprints.
• Of the 'production mix' variables, it was shown that 'number of brands' and 'SKUs' (stock-keeping units) had a negative correlation, indicating generally more flexibility in plants with lower water consumption, tying up with the negative correlation seen for 'frequency of change-overs'. This too is counter to what the Delphi participants (and the literature) expected. An explanation for this is that larger plants tend to have more production lines, which would translate into fewer change-overs or SKUs per line, resulting in lower usages (positive correlation on a line-level); but since it is reported and correlated on a plant level, the opposite (a negative correlation) is observed.
• Of the 'plant condition' variables, it was shown that the 'age of plant' had a very weak negative correlation, which is counter to the expectations of the Delphi participants and the literature reviewed. This can be explained by the general tendency of new plants to be built smaller (with the ability to expand in the future) than older plants. Equipment is not always optimally sized for the commissioned capacity, but rather for a targeted future volume.
• It is also shown that 'hygiene standards' had a relatively strong negative correlation, which was counter to the expectations of the Delphi participants. The common expectation is that, to increase hygiene scores, more water would be required due to more frequent and more thorough cleaning. The data shows the opposite, indicating that good hygiene corresponds with lower water usage. This could in part be explained by arguing that wet surfaces are more prone to micro-growth, and also that designing cleaning equipment and practices to be effective would require less frequent cleaning, resulting in reduced water usage while delivering higher hygiene scores.
• It is interesting to note that 'total evaporation' displayed a negative correlation, which was counter to the expectations of the Delphi participants. An investigation revealed that many sites condense the water vapour in heat recovery systems, which enables them to re-use the water. Sites with lower evaporation rates would not install heat recovery systems (due to the lower return on investment); and because they would be more prone to losing water from evaporation, they would use more water.
• It is interesting to note the positive correlation on water usage and 'cost of water'. This is also counter to the expectations of the Delphi participants.
In Figure 3 b), which is the rank-ordered list of drivers from Figure 3a) (excluding the specific energy and water scores), the top drivers of water usage, as identified in the Delphi survey (Table 1), are indicated by rectangular boxes, while the drivers used in the development of the normalisation model are indicated by black dots. As stated above, the recycling of water (the highest-ranked driver from the Delphi survey) was excluded as a driver by adding the ratio of recycled water back to the specific water usage of those sites that reported to be recycling water. Due to the strong correlations shown by the GEM levers (the ''management and 'operating practices' drivers at the bottom of Figure 3 a), the 'overall GEM score' was used instead of the 'technical capability' selected by the Delphi participants, as the driver is already included (among others) in the calculation of the overall GEM score.
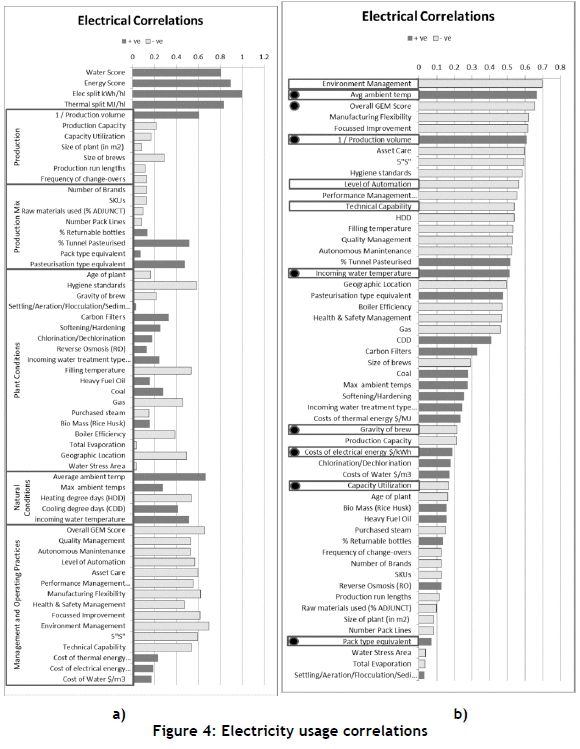
4.2 Correlational analysis - Electricity
Figure 4 shows the results of the correlation analysis of the drivers identified from the literature and the specific electricity usage of the 64 sites. Again, the dark bars indicate a positive correlation, and the light bars indicate a negative correlation. From Figure 4 a), representing the breakdown of drivers from the literature, the following observations are made:
• Specific electricity usage had a strong positive correlation with water and thermal usages, and hence with total energy usage.
• As with water, the category of drivers that seem to have the strongest correlation is 'management and operating practices' as measured by the SABMiller GEM scores.
• The nature of the correlations (positive or negative) was the same as for water, with the exception of 'production run lengths', which had a negative correlation for electricity usage, while it had a positive correlation for water usage on the data assessed. The expectation is that the correlation should be negative for both water and electricity, as fewer start-up losses will need to be accounted for.
• Of the 'production' variables, the inverse of the production volume revealed the strongest correlation to specific electricity usage. It was interesting to note that 'size of plant' revealed a negative correlation, while Delphi participants (and the literature reviewed) expected a positive correlation. As with water, this could be due to the tendency for breweries with larger volumes also to boast larger footprints.
• Of the 'production mix' variables, it was shown that 'number of brands' and 'SKUs' had a negative correlation, indicating generally more flexibility in plants with lower electricity consumption. This ties up with the negative correlation seen for 'frequency of change-overs'. This is counter to what the Delphi participants (and the literature) expected. An explanation for this could be that larger plants would have more production lines, which would translate into fewer change-overs or SKUs per line, resulting in lower usages; but since it is reported and correlated on plant level, the opposite is seen.
• Of the 'plant condition' variables, it was shown that 'age of plant' had a negative correlation, which is counter to the expectations of the Delphi participants and the literature reviewed. Again, this can be explained by the general tendency of new plants to be built smaller (with the ability to expand in the future) than older plants. Equipment is not always optimally sized for the commissioned capacity, but rather for a targeted future volume.
• It is also shown that 'hygiene standards' had a relatively strong negative correlation, which was counter to the expectations of the Delphi participants. This could in part be explained by arguing that designing cleaning equipment and practices to be effective would result in less frequent cleaning and reduced electricity usage, while delivering higher hygiene scores.
• It is interesting to note the positive correlation of electricity usage and 'cost of electricity'. This is also counter to the expectations of the Delphi participants.
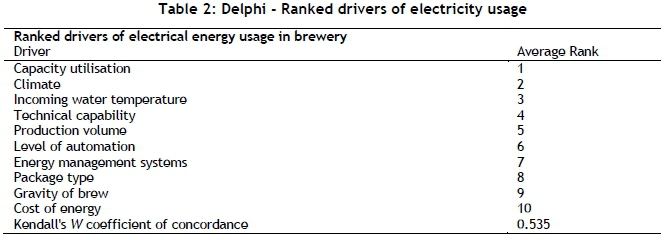
In Figure 4b), which is the rank-ordered list of drivers from Figure 4a), 'energy management systems' is represented by the GEM category 'environment management'. The rectangular boxes indicate the top drivers that were identified in the Delphi survey (Table 2), while the black dots indicate the drivers used in the development of a normalisation model. Due to the strong correlations shown by the GEM levers (the 'management' and 'operating practices' drivers at the bottom of Figure 4a), it was decided, as with water, to include 'overall GEM score' in the normalisation model rather than the 'technical capability', 'level of automation' and 'energy management systems'
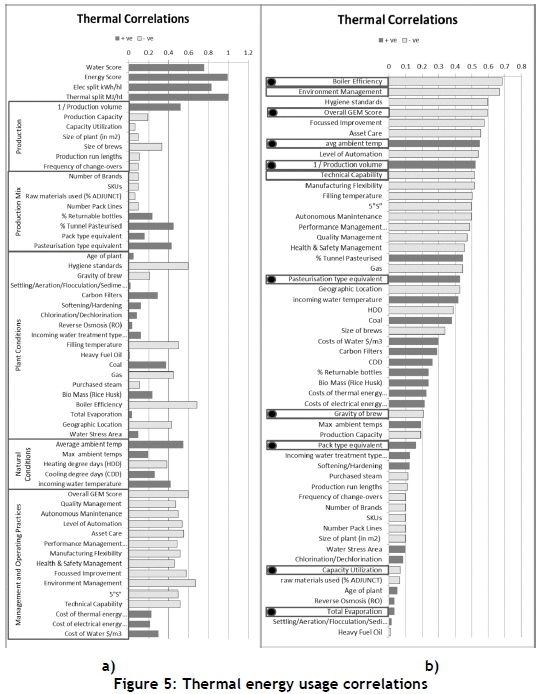
4.3 Correlational analysis - Thermal energy
Figure 5 shows the results of the correlation analysis of the drivers identified from the literature and the specific thermal energy usage of the 64 sites. From Figure 5 a), representing the breakdown of drivers from the literature, the following observations are made:
• Specific thermal usage had a strong positive correlation with water and electrical usages, and hence with total energy usage.
• As with water and electricity, the category of drivers that seem to have the strongest correlation was 'management and operating practices' as measured by the SABMiller GEM scores.
• The nature of the correlations (positive or negative) was the same as for electricity usages, with the exception of 'age of plant', 'total evaporation' and 'water stress area', which had positive correlations for thermal energy, while having negative correlations with electricity usage. The direction of correlations for thermal energy seems to correlate better with the expectations of the Delphi participants (and the literature) than in the cases of water and electricity usages.
• Of the 'production' variables, the inverse of the production volume revealed the strongest correlation to specific thermal usage. It was shown that 'size of the plant' revealed a negative correlation, while Delphi participants (and the literature reviewed) expected a positive correlation. As with water and electricity, this may be due to the tendency for breweries with larger volumes also to boast larger footprints.
• Of the 'production mix' variables, it was shown that 'number of brands' and 'SKUs' had a negative correlation, indicating generally more flexibility in plants with lower thermal consumption; and this ties up with the negative correlation seen for 'frequency of change-overs'. This is counter to what the Delphi participants (and the literature) expected, as with the explanation for electricity.
• Of the 'plant condition' variables, it was shown that hygiene standards had a relatively strong negative correlation with thermal energy. This is counter-intuitive, as heat is often used to clean and sterilise surfaces. It could be argued that cold-cleaning and sterilisation solutions are becoming more prevalent, contributing to plants' overall reduction in thermal energy. It could also be argued that better hygiene practices and standards result in a reduced need (lower frequency) for cleaning, and would result in a thermal energy reduction with improved hygiene scores.
• It is interesting to note the positive correlation on thermal usage and cost of thermal energy. This is also counter to the expectations of the Delphi participants.
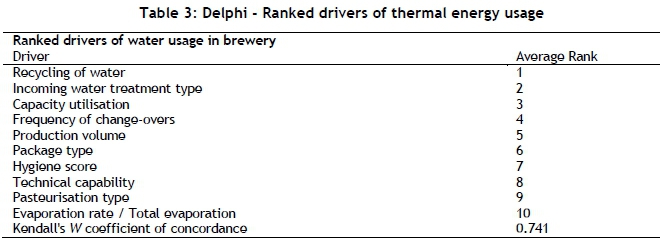
In Figure 5b), which is the rank-ordered list of drivers from Figure 5a), 'energy management systems' is represented by the GEM category 'environment management'. The rectangular boxes indicate the top drivers that were identified in the Delphi survey (Table 3), while the black dots indicate the drivers used in the development of a normalisation model. Due to the strong correlations shown by the GEM levers (the 'management' and 'operating practices' drivers at the bottom of Figure 5a), it was again decided to include 'overall GEM score' in the normalisation model rather than the 'technical capability' and 'energy management systems' selected by the Delphi participants, as these drivers are already included (among others) in the calculation of the overall GEM score.
4.4 Water regression model
The parameters of the MVLR model developed for the water usage index are given in Table 4, and the visual representation of the actual vs predicted usages is shown in Figure 2 (above). Only nine variables were considered in the development of the MVLR model, as the recycling of water was eliminated by adding back the ratio of water recycled to the usage ratios of the sites that reported to be recycling water.
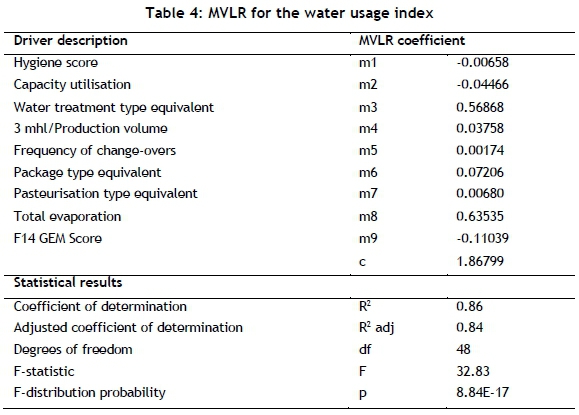
A good fit (R2 and adjusted R2 both > 0.84) was achieved by considering the drivers identified; and the F-statistic indicates that the results were not obtained by chance (as the F-distribution probability <0.05).
In Figure 2 the dark markers indicate the MVLR predicted water usage index, while the square markers indicate actual site consumption. The visual representation confirms the statistical conclusion from Table 4, in that the model's predictions are accurate enough to use the model to investigate the effect of drivers on the water usage of SABMiller sites. Figure 2 also shows that the distribution of water usage within SABMiller plants follows a similar trend to the rest of the industry [4].
It is interesting to note that the 'worst performing' sites within SABMiller use about 2.5 times the amount of water per hl of beer produced than the 'best performing' sites, which is similar to the range given for the rest of the industry [4].
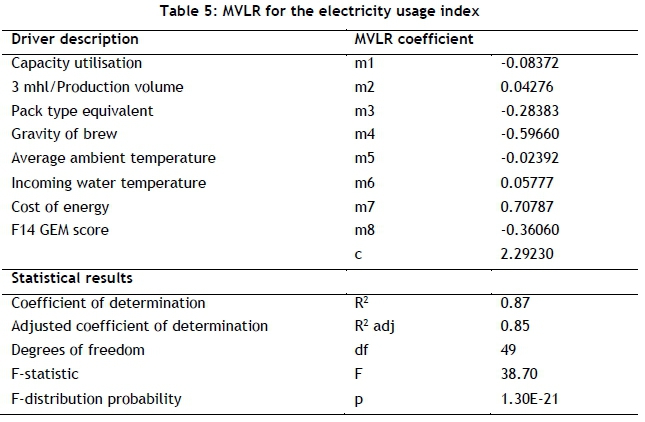
4.5 Electricity regression model
The parameters of the MVLR model developed for the electrical usage index are given in Table 5. Only eight variables were considered in the development of the MVLR model, as the F14 GEM score replaced the drivers 'energy management systems', 'level of automation', and 'technical capability' identified by the Delphi participants (see Figure 4).
A good fit (R2 and adjusted R2 both > 0.85) was achieved by considering the drivers identified; and the F-statistic indicates that the results were not obtained by chance (as the F-distribution probability <0.05).
There is more variability in the electricity usage than there is in the water usage. The predicted values for some of the high-volume sites tend to be lower than the actual usages. This is assumed to be due to 'hotel loads', which are more prevalent in these larger sites, and could not be backed out (SABMiller policy). A visual representation of the MVLR predicted electrical usage index vs the actual site consumption confirms the statistical conclusion from Table 5: that the model's predictions are accurate enough to use the model to investigate the effect of drivers on the electricity usage of SABMiller sites. Also, the distribution of electricity usage within SABMiller plants follows a similar trend to the energy consumption trends seen in the rest of the industry [4].
It is interesting to note that the 'worst performing' sites in SABMiller use about three times the amount of electricity per hl of beer produced than the 'best performing' sites, which is similar to the range reported for the rest of the industry [4].
4.6 Thermal energy regression model
The parameters of the MVLR model developed for the thermal energy usage index are given in Table 6. Only nine variables were considered in the development of the MVLR model, since the F14 GEM score replaced the drivers 'energy management systems' and 'technical capability' identified by the Delphi participants (see Figure 5).
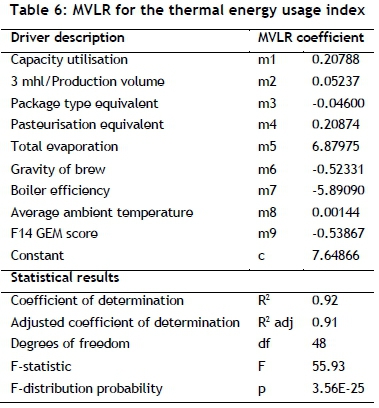
A good fit (R2 and adjusted R2 both > 0.9) was achieved by considering the drivers identified; and the F-statistic indicates that the results were not obtained by chance (as the F-distribution probability <0.05).
There is more variability in the thermal usage than there is in the water or electricity usage. A visual representation of the MVLR predicted thermal energy usage index vs the actual site consumption confirms the statistical conclusion from Table 6: that the model's predictions are accurate enough to use the model to investigate the effect of drivers on the thermal usage of SABMiller sites. Also, the distribution of thermal usage within SABMiller plants follows a similar trend to the energy consumption trends seen in the rest of the industry [4].
It is interesting to note that the 'worst performing' sites in SABMiller use about 4.3 times the amount of thermal energy per hl of beer produced than the 'best performing' sites, which is higher than the range reported for the rest of the industry [4].
4.7 Testing the models
The MVLR models for water, electricity, and thermal energy usages were tested by comparing the actual usage index values of six SABMiller sites (one from each global hub) with the predicted usage index values of the respective MVLR models when populated using the sites' driver data. Table 7 summarises the results. The complete results are provided elsewhere [2]. The MVLR model for water usage correctly predicted the water usage index of two of the sites, with a maximum error of six per cent (overestimated). The MVLR model for electricity usage predicted the usages with a maximum error of seven per cent (overestimated), and the MVLR model for thermal energy usage predicted usages with a maximum error of six per cent (underestimated).
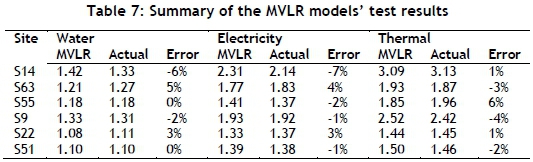
From the results summarised in Table 7, it is concluded that the MVLR models are accurate enough (less than 10 per cent error) to be used to investigate the impact of drivers within a plant's control on usage performance. The normalisation model was thus derived from the MVLR models.
4.8 Normalisation of the models' outputs
Of the drivers used to develop the MVLR models for the water, electricity, and thermal energy usage indices, not all are strictly beyond the control of the site personnel. The MVLR models were then used to derive a normalisation model by eliminating (all or most of) the variances on the drivers that are under the site's control (such as the GEM scores).
Of the drivers used in the development of the MVLR model for water usage, the hygiene score, total evaporation, pasteurisation type, and GEM score can, with focused initiatives and projects, be influenced by site personnel. For the purpose of normalisation, these drivers were eliminated by assigning each site an equal score in the MVLR model: 100 per cent for hygiene, 100 per cent for pasteurisation type, 4 per cent for evaporation, and 4 per cent for the GEM score.
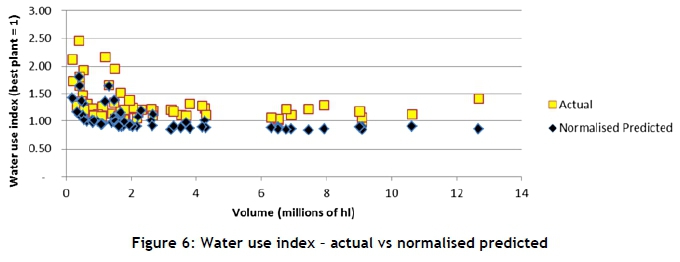
The five drivers that remain - capacity utilisation, water treatment requirements, volume, package types and frequency of changes overs - are not in the direct control of site personnel, but may be influenced by other parts of the supply chain. For the purpose of normalisation, these variables were kept unchanged. The result of the normalised MVLR model for water usage index is shown in Figure 6, revealing that, apart from a couple of sites (just under two million hl in capacity), the predicted usages follow mainly a hyperbolic path (driven by volume). The sites that break the trend are sites that require an extraordinary amount of water treatment due to incoming water quality constraints.
It is also apparent from comparing Figure 6 with Figure 2 that most of the variability in the water usage between sites (other than volume) is caused by drivers that are within the plant personnel's control. The normalised predicted usages could be likened to a proposed benchmark for each site, considering the drivers beyond the control of the site that influence usage potential. The difference between the actual and the normalised water use indices in Figure 6 indicate the opportunity each site has for improvement.
Figure 7 shows the plots of the opportunity ranking (gap between actual and normalised predicted values) and the current rank based on actual usages. A rank of '1' is given to the plant with the lowest current usage (for the current rank given in bars), and to the plant with the lowest potential for improvement (for opportunity given with markers). It is interesting to note that, although the general trend is similar - that is, the sites with the biggest opportunities are also the sites with the highest current usages - there are exceptions. It is noted that the plant S50, currently the best performing site in SABMiller, is ranked number 15 when considering its potential for improvement. It is also noted that the site S8, although ranked 51 out of 64 sites in terms of current performance, actually has the least opportunity for improvement.
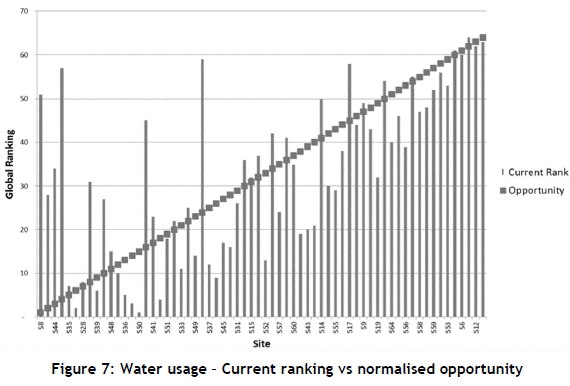
Further, it is interesting to note that, after normalisation, even though ratios have improved, there still is a variance of around 2.5 times between the 'best' and 'worst' water ratios. This suggests that the full variance in performance cannot be ascribed to 'poor performance' or to 'opportunity for improvement', as is often done in the literature [6], but instead can be attributed to known drivers such as capacity utilisation, water treatment requirements, volume, package types, and frequency of changes-overs, all of which are beyond the control of the sites.
Of the drivers used in the development of the MVLR model for electricity usage, only the gravity of the brew and the GEM score can, with focused initiatives and projects, be influenced by site personnel. For normalisation, these drivers were eliminated by assigning each site an equal score in the MVLR model: 44 per cent for dilution ratio, and 4 per cent for the GEM score.
The six drivers that remain - capacity utilisation, volume, package types, ambient and water temperature, and cost of energy - are not in the direct control of site personnel, but may be influenced by other parts of the supply chain. For normalisation, these variables were kept unchanged. As with water usage, when comparing the actual and the normalised predicted usages, much variability between sites is observed. For electricity usage, most of the variability is thus due to drivers that are beyond the control of site personnel.
■ Opportunity
The normalised predicted usages could be likened to a proposed benchmark for each site, considering the drivers beyond the control of the site that influence usage potential. The difference between the actual and the normalised electricity usage indices indicates the opportunity each site has for improvement.
Good performing sites (S30 ranked number 2 currently) tend to rank high on the opportunity list (S30 is ranked number 1 on opportunity, indicating the smallest opportunity to improve), but again there are exceptions. It is noted that the best performing site in SABMiller (S27) is ranked number 16 when considering its potential for improvement. It is also noted that the site S42, ranked 39 out of 64 sites in terms of current performance, is ranked as having the fifth lowest opportunity for improvement.
It is interesting to note that, after normalisation, even though the ratios have improved, there is still a variance of around three times between the 'best' and 'worst' electricity usage ratios. Similar to water usage, this suggests that the full variance in performance cannot be ascribed only to 'poor performance' or 'opportunity for improvement', but instead can be attributed to known drivers, such as capacity utilisation, volume, package types, ambient and water temperature, and cost of energy, all of which are beyond the control of the sites.
Of the drivers used in the development of the MVLR model for thermal energy usage, the pasteurisation type, total evaporation, gravity of the brew, boiler efficiency, and GEM score can, with focused initiatives and projects, be influenced by site personnel. For normalisation, these drivers were eliminated by assigning each site an equal score in the MVLR model: 100 per cent for pasteurisation equivalent, four per cent for total evaporation, 44 per cent for dilution ratio, and 4 per cent for the GEM score. The boiler efficiency was constrained to a minimum of 85 per cent -that is, sites with efficiencies lower than 85 per cent were normalised to 85 per cent, and sites with efficiencies greater than 85 per cent were allowed to maintain higher performances.
The four drivers that remain - capacity utilisation, volume, package types, and ambient temperature - are not in the direct control of site personnel. For the purpose of normalisation, these variables were kept unchanged. As with water and energy usages, the normalised predicted thermal usage index follows a hyperbolic path (volume driven), and almost all of the variability has disappeared from the data. It can thus be concluded that most of the variability in thermal energy performance between sites is due to drivers that are within the control of the site personnel.
The trend of rankings follows much closer for thermal energy than it does for electricity or water usage. There are still some exceptions. It is noted, for example, that plant S19, currently ranked number 11, should be ranked number 26 when considering its potential for improvement. We also see that site S8, currently ranked 30th, should be ranked 12th when considering its potential for improvement.
It is interesting to note that, after normalisation, even though ratios have improved, there still is a variance of around 2.5 times between the 'best' and 'worst' thermal energy usage ratios. This is an improvement on the current variance. It is also noteworthy that even the 'worst' plant should get to within 150 per cent of current best practice. This suggests, as with water and electricity usage, that the full variance in performance cannot be ascribed only to 'poor performance' or 'opportunity for improvement', but instead can be attributed to known drivers, such as capacity utilisation, volume, package types, and ambient temperature, all of which are beyond the control of the sites.
5 CONCLUSIONS AND RECOMMENDATIONS
5.1 What are the main variables that influence the water and energy performance potential of plants?
The literature review revealed that many variables are deemed to influence performance, but that there is generally poor consensus on the main drivers to consider. Few authors document the impact or influence of the drivers they identify, or how to use them to normalise performance. A list of identified drivers of water and energy usage was used as input to the first round of a Delphi survey and to the correlational analysis.
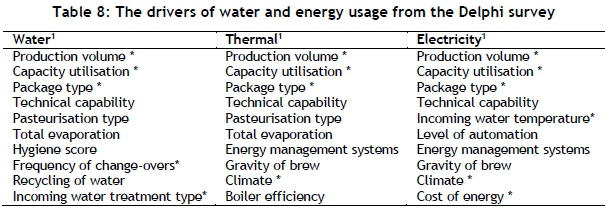
The Delphi participants identified, prioritised, and ranked the main drivers of the water, electricity, and thermal energy performance of SABMiller breweries. The prioritised lists of drivers, summarised in Table 8, revealed that there are many common drivers for water, electricity, and thermal energy usages. This was confirmed by the correlational analyses, shown in Figures 3 to 5. The analyses also showed a strong correlation between the water and energy usage ratios. This contradicts the findings of Pennartz [10] and Heuven et al. [11], but is consistent with the observations of Campden BRI [5] and BIER [4] that most sites improve water and energy usages concurrently.
The correlation results mostly corroborated the qualitative data, bolstering the validity of the qualitative data from the literature and the Delphi survey, but some were ascribed to co-correlation and not causation. It is suggested that, had the study looked at the impact of drivers on a single plant, the correlations would have better matched the expectations of the Delphi participants and the literature reviewed. Overall, the 'management' and 'operating practice' drivers had the strongest correlation with water and energy consumption, as predicted by Olajire [19]. The average Global Evaluation of Manufacturing (GEM) score was introduced as an overall measure of 'management' and 'operating practices', replacing other variables (contributing to the GEM score) such as 'technical capability' and 'energy and management systems'.
Of the drivers identified from the literature and by the Delphi participants, few are completely beyond the control of the brewery staff. This implies that most of the drivers can be managed to reduce their impact [4]. For usages to be managed effectively, a company needs to understand how much of its water and energy use is due to controllable actions, and how much is due to factors beyond its control [19]; and normalisation assists plants to understand this dynamic better. The drivers considered to be beyond the control of plant personnel (and hence used in normalising performance) are indicated by stars (*) in Table 8.
During the initial rounds of the Delphi survey, participants tended to consider only specific plants when responding to the questionnaires, and usually changed the rankings when asked to consider the impacts of the drivers on a global scale. This indicates that the main drivers may differ from site to site, and from hub to hub. This should be considered when developing a normalisation model for a specific site to understand variation in monthly performance, or within a specific hub.
The correlational analysis revealed that some of the drivers identified in the literature review and by Delphi participants, such as 'age of plant', 'total evaporation', 'size of plant', and 'capacity utilisation', had weak correlations with specific water and energy usages of the assessed SABMiller plants. This serves to debunk some of the traditional views that are held, and should inform the development of improvement strategies.
5.2 How can these variables be accounted for in normalising the performance, or benchmarks?
In this study, multi-variable linear regression (MVLR) models were successfully developed using data from 58 SABMiller sites to predict the usage performance, given the drivers identified. Some of the variables, such as package type, pasteurisation type, and incoming water treatment type (for water usage), needed to be transformed into a single variable for use in the MVLR model. This was done by applying volume-weighted internal SABMiller benchmarks to site data as correction factors.
The models were tested against data from six SABMiller sites not included in the development of the models, and were able to predict usages of water, electricity, and thermal energy usage within an error of seven per cent, which was deemed accurate enough to investigate the normalisation of performance. The disadvantage of the MVLR approach is that the coefficients will have to be recalculated when the data changes - as it will every year. The advantage is that it is easy to do in Excel with built-in functions (such as LINEST) once the data is available, and the accuracy (and hence applicability) of the data can be checked by comparing actual to calculated performance ratios.
From Figures 3 to 5 it was seen that the Delphi participants selected drivers with strong correlations, as well as drivers with weaker correlations. Had drivers for normalisation been selected based purely on strength of correlation, more accurate MVLR models could have been developed; but the validity of the conclusions would have been weakened by the lack of triangulation. Correlation does not necessarily indicate causation; and as the models were intended to be used to focus improvement efforts, the MVLR models primarily used the drivers identified by the Delphi participants. The only exception was the introduction of the overall GEM score to replace the managerial drivers that the Delphi participants selected. The validity of the conclusions reached is thus strengthened by triangulation and corroboration with the literature study and the Delphi survey.
In order to normalise performance, the variables within the control of site personnel were fixed at common (target) values, while variables beyond the control of the site personnel were allowed to vary. The MVLR models revealed that, for water and thermal energy usage, drivers within the control of the plant personnel caused most of the variability (apart from volume). For electricity, drivers beyond the control of the plant personnel caused much variance. This is significant when considering strategies for improving performance and the setting of targets.
The difference (or gap) between current and normalised performance indicates the opportunity for improvement, considering the variables identified. The limitation of using this model is that the regression coefficients are determined by using actual data from sites, and thus the coefficients are determined from sites with inefficiencies. The normalised benchmark resulting from forcing variables to common (target) values is thus also derived from data from sites with inefficiencies. The benchmarks should thus not be considered as absolute, but should rather be used to identify which sites have the largest opportunity to improve. The model will have to be updated annually as all sites improve.
Using the MVLR models and the identified drivers, the range in usages between plants can be explained; and it was shown to remain even after normalisation. This illustrates that a 'high' usage ratio does not necessarily imply poor performance, and neither does a 'lower' usage imply good performance. This confirms the need to normalise for differences before comparing plant performances.
5.3 Recommendations
Understanding drivers and the normalising of these drivers assists brewers to understand where resources need to be most cost-effectively deployed. Normalisation enables:
• A more direct comparison of plant performances.
• More effective benchmarking.
• The identification of high-performance plants, practices, and people, from which learning can be rolled out to other plants.
• The identification of struggling plants that require assistance (in process or plant) to improve performance.
• The formulation of new divisional (and possibly publicly committed) targets with a clearer view on what is achievable with the current portfolio.
It was shown that, although current performance gives a general impression, it is not a reliable measure of improvement opportunities. Ranking plants on the basis of current performance without first normalising the performance may differ significantly from the true opportunities for improvement, and may result in resources being allocated to the wrong sites. Breweries should not compare their usage performances directly without considering the impact of their differences (variables beyond their control). This also applies to comparisons with benchmarks.
Breweries should track the main variables identified in this study as performance indicators for the purpose of understanding and improving their specific water, electricity, and thermal energy usage ratios. Collaboration between sites and with brewers' associations is encouraged to facilitate learning on how to achieve target values on the variables that are under the control of the site personnel.
For more reliable benchmarks, sites should endeavour to develop accurate energy and mass balance models of their operations, so as to understand their true potential.
REFERENCES
[1] KPMG. 2012. Expect the unexpected: Building business value in a changing world [Online]. Available: http://www.kpmg.com/global/en/issuesandinsights/articlespublications/pages/building-business-value.aspx [Accessed: 22-Aug-2016]. [ Links ]
[2] Kirstein, J.C. 2014. An investigation into the normalisation of water and energy use in breweries. Masters dissertation, Graduate School of Technology Management, University of Pretoria. [ Links ]
[3] BBPA (British Beer & Pub Association). 2013. Brewing green 2013: Our commitments towards a sustainable future for Britain's beer and pubs, British Beer & Pub Association [Online]. Available: bbpaprod/attachments/documents/resources/22496/original/brewinggreen2013.pdf?1387532044 [Accessed: 22-Aug-2016]. [ Links ]
[4] BIER (Beverage Industry Environmental Roundtable). 2014. Beverage industry continues to drive improvement in water and energy use: trends and observations 2013. Available: http://media.wix.com/ugd/49d7a0_688a35792cea4d7d84ba1f8c955ded6c.pdf [Accessed: 22-08- 2016]. [ Links ]
[5] Campden BRI. 2013. Global Brewery Survey [Online]. Available: www.campdenbri.co.uk/global-brewery-survey.php [Accessed: 08-Feb-2014]. [ Links ]
[6] Sorrell, S. 2000. Barriers to energy efficiency in the UK brewing sector. Science and Technology Policy Research Unit (SPRU), University of Sussex. [ Links ]
[7] NRC. 2011. 2011 Guide to energy efficiency opportunities in the Canadian brewing industry, 2nd ed. Issued by the Canadian Industry Program for Energy Conservation, Canadian Brewing Industry. [ Links ]
[8] EBC (European Brewery Convention). 1990. Manual of good practice Vol 8: Water in brewing. Nurnberg: EBC. [ Links ]
[9] WBG (World Bank Group). 1988. Pollution prevention and abatement handbook 1998: Toward cleaner production. Washington, World Bank. [ Links ]
[10] Pennartz, A.M.G. & Jackson, G. 2010. Energy and water efficiency in the brewing industry. Brauwelt International, 28(3), pp.153-155. [ Links ]
[11] Heuven, F., van Beek, T., Jackson, G. & Johnson, A. 2013. Worldwide benchmarking of energy and water efficiency in the brewing sector 2012, Brauwelt International, IV, 248-250. [ Links ]
[12] Brent, A.C. 2009. An investigation into behaviours in and performances of a R&D operating unit. Master'sdissertation, Graduate School of Technology Management, University of Pretoria. [ Links ]
[13] Myers, M.D. 1997. Qualitative research in information systems, MIS Quarterly, 21(2), pp. 241-242. [ Links ]
[14] Scandura, T.A. and Williams, E.A. 2000. Research methodology in management: Current practices, trends, and implications for future research, Academy of Management Journal, 43(2), 1248-1264. [ Links ]
[15] Uhl, N.P. 1983. Using the Delphi technique in institutional planning, New Directions for Institutional Research, 37, 81-94. [ Links ]
[16] Schmidt, R.C. 1997. Managing Delphi surveys using non-parametric statistical techniques, Decision Sciences, 28(3), 763-774. [ Links ]
[17] Wouda P. & Pennartz, A.M.G. 2002. Worldwide benchmark for energy efficiency in the brewing industry, Brauwelt International, II, 106-110. [ Links ]
[18] Ling, C.Y. & Eang, L.S. 2006. Benchmarking industrial building energy performance. Seminar on EAEF Project 64 & 68, Energy Sustainability Unit, National University of Singapore. [ Links ]
[19] Olajire, A.A. 2012. The brewing industry and environmental challenges. Journal of Cleaner Productiom, in press. Available at: http://www.sciencedirect.com/science/article/pii/S0959652612001369 [Accessed: 22-08-2016]. [ Links ]
Submitted by authors 2 Feb 2017
Accepted for publication 20 Sep 2017
Available online 13 Dec 2017
* Corresponding author acb@sun.ac.za
1 Note, the drivers are not in ranked order. The table serves to illustrate the commonality of drivers for water and energy usage in SABMiller plants. For the ranked order, refer to Tables 1 to 3 respectively. The stars (*) indicate drivers beyond plant control used in the normalisation model.

