


Serviços Personalizados
Artigo
 Inglês (pdf)
 Artigo em XML
 Referências do artigo
Indicadores

Links relacionados
-
 Citado por Google
 -
 Similares em Google
Compartilhar

 Permalink
South African Journal of Industrial Engineering
versão On-line ISSN 2224-7890
versão impressa ISSN 1012-277X
S. Afr. J. Ind. Eng. vol.28 no.3 Pretoria 2017
http://dx.doi.org/10.7166/28-3-1862
GENERAL ARTICLES
The effects of selective laser melting scan strategies on deviation of hybrid parts
D. Hagedorn-Hansen*; M.B. Bezuidenhout; D.M. Dimitrov; G.A. Oosthuizen
Stellenbosch Technology Centre (STC-LAM), Department of Industrial Engineering, Stellenbosch University, South Africa
ABSTRACT
The use of additive manufacturing to produce intricate part geometries in the aerospace, medical, and tool-and-die industries is increasingly incorporated in manufacturing process chains. However, the high costs, long production times, and material integrity issues associated with additive manufacturing technologies such as selective laser melting make the process suitable only for certain applications. In order to reduce selective laser melting production costs for selected parts, a combination of selective laser melting and milling can be used. Metal parts produced with this method are referred to as hybrid parts. A challenge in producing hybrid parts is to reduce the geometrical deviation due to process-induced warping. This paper discusses the effects of various laser scan strategies on the deviation of hybrid parts. A newly developed scan strategy is experimentally compared with its commercial counterpart with regard to as-built part warping and porosity. The novel strategy resulted in a significant reduction in warping and porosity.
OPSOMMING
Die benutting van toevoegingsvervaardiging vir die produksie van komplekse onderdeel geometrieë in die lugvaart, mediese, en werktuig industrieë word toenemend geïnkorporeer in vervaardigingsproseskettings. Gepaardgaande hoë kostes, lang produksietye, en materiaal integriteitstekortkominge met toevoegingsvervaardiging tegnologieë soos selektiewe laser smelting veroorsaak dat die proses slegs uitvoerbaar is vir sekere toepassings. Ten einde selektiewe laser smelting produksiekoste te verminder vir geselekteerde onderdele, kan 'n kombinasie van selektiewe laser smelting en freesmasjinering geïmplementeer word. Metaal onderdele wat met so kombinasie geproduseer word, word na verwys as hibried onderdele. 'n Uitdaging in die vervaardiging van hibried onderdele is om geometriese afwyking deur skeeftrekking wat deur die proses veroorsaak word, te verminder. Hierdie artikel bespreek die effekte van verskeie laser skandeer strategieë op die afwyking van hibried onderdele. 'n Nuut ontwikkelde skandeer Strategie is eksperimenteel vergelyk met 'n kommersiële eweknie met betrekking tot skeeftrekking en porositeit. Die skeeftrekking en porositeit van die nuut uitgevonde strategie is beduidend laer.
1 INTRODUCTION
Selective laser melting (SLM) can be used as an alternative manufacturing process to support or, in some instances, replace CNC milling processes within a manufacturing process chain [1]. Due to the relatively high production costs and long production times of SLM, using a combination of milling and SLM process chains is investigated. Hybrid parts are defined by Herzog [2] as a metal workpiece, comprising a prefabricated lower part and - by a metal powder sintering process applied thereto - the upper part, in which the bottom part is made of a solid piece of metal, fabricated by machining of the workpiece and, together with the upper part, forms the complete workpiece [3].
A typical challenge for these parts is the reduction of warping or curling, which is caused by the high residual stresses that are induced during the melting and solidification processes [4]-[10]. The main reason for the induction of stresses in the part is the material expansion and contraction from rapid heating of the material by the laser to beyond its melting point, followed by a relatively high cooling rate in the build chamber [11]. Residual stresses induced by these high temperature fluctuations often result in geometrical deviations within the part while it is being produced. Due to this phenomenon, applications of as-built SLM parts aimed at high cyclic load-bearing applications cannot yet fully compete with conventional manufacturing processes in cost, surface finish, or mechanical properties.
Mercelis and Kruth [4] found that the exposure strategy used to fuse the powder layers has a significant influence on residual stress levels within a part. Scanning strategies are often overlooked, with the focus being on optimising process parameters [9], [12]-[16]. However, it has been shown that varying the scanning strategy results in different defects, anisotropy of mechanical properties, and geometrical deviations in sLm parts [17]-[23]. The objective of this study was to determine whether a newly-developed scan strategy significantly reduces geometrical deviation (warping) compared with the machine's patented default strategy. The effects on other mechanical properties will be included in future work, and fall outside of the scope of this study.
2 STRESS INDUCTION MECHANISMS
Residual thermal stresses may be induced in a part produced by selective laser melting via the following phenomena:
• The stresses are induced in the solid substrate under the present layer that is being melted [24], [25].
• The stresses are induced by the rapid cool-down phase of the melted top layers [24].
• The stresses are induced by the temperature fluctuations experienced by the grains in a single melted layer [26], [27].
The first phenomenon is referred to as the temperature gradient mechanism (TGM), and it is the result of large thermal gradients in the solid substrate just underneath the laser spot, as displayed in Figure 1. The expansion of the upper layer, due to the high temperature gradient, is restricted by the underlying solidified layers. This induces a compressive stress in the upper layers of the substrate that may rise above the yield strength of the material and cause plastic deformation in those layers. When the top layers cool down, their compressive state is converted into residual tensile stresses, thus warping the part. With regard to the second phenomenon, the melted top layers shrink due to the thermal contraction of the material; but this movement is inhibited by the lower layers, resulting in a tensile stress in the uppermost layer and compressive stresses below [24].
Three main heat transfer mechanisms can be identified during the SLM process [28], [29]: laser radiation, convection, and conduction. The largest heat loss mechanism is through convection at the top surface with the ambient atmosphere of the SLM system [28], [29]. In the third phenomenon, the top surface of the exposed layer experiences a faster cooling rate through convection than the bottom of the layer through conduction. This results in the top surface contracting at a faster rate than the bottom surface, as shown in Figure 2. Subsequently, Type II residual stresses are introduced into the part. The grains at the top surface of the layer experience a cold zone, while the lower grains experience hot zones. The contraction of the cold zone at the top surface causes the hot zone to yield, which in turn results in the part warping upwards in the positive z direction [27], [30], [31].
3 OVERVIEW OF SCAN STRATEGIES
Scanning strategies are defined in the literature by Jhabvala et al. [32] and Mertens et al. [33] as having two parts: scan parameters, and a scan pattern. Simchi [22] states that the scanning strategy includes the length of a scan vector and the method of irradiation between successive layers. In order to complement these definitions, the following working description towards defining a 'scan strategy' is proposed: A scan strategy is any scan pattern or exposure method that is used to influence a dependent variable during the SLM process. This includes, but is not limited to, different vector, segment, or layer scanning methods. The laser and process parameters should be differentiated from the scan strategy, as different machines and materials rely on different parameters. Thus the scan strategy should first be defined on a certain machine for a specific material before parameter optimisation ensues.
3.1 Scan strategies
There are many different vector and layer scan strategies, each with their respective advantages and disadvantages. This section lists and describes some of the developed vector and layer scan strategies applied in SLM processes. Scan strategies affect the material properties of the final part. They can be used to control the grain orientation and the microstructural texture [34]. Due to a lack of standard terminology for the specification of strategies, they are typically described through independently derived terms and analogies [17], [30], [35], [36]. A selection of different scan strategies, along with the different terms and diagrams, is listed in the sections that follow.
3.2 Vector strategies
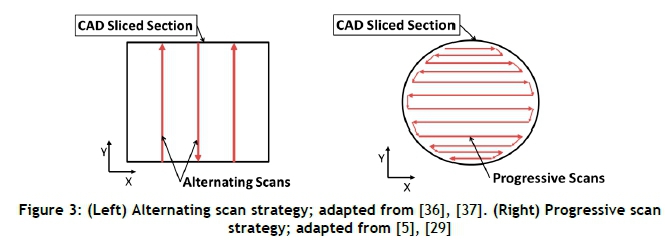
3.2.1 Alternating vector scan strategy, and the progressive scan strategy
The alternating scan strategy (also referred to as the 'raster scan strategy') alternates the vector direction after each scan [37]. The laser scans one vector from the start point to the end point, and then starts with the next vector. The starting point of the next vector is in close proximity to the end point of the previously scanned vector. The alternating scan strategy is shown on the left in Figure 3 below. Note the different directions of the scan vectors. The progressive scan strategy is similar to the alternating scan strategy, except that the scan vectors are continuous and the laser scanner flows from one vector to the next without any delays or jumps [5], [29]. The strategy is illustrated on the right in Figure 3 below.
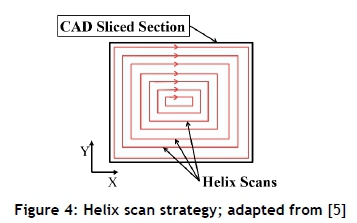
3.2.2 Helix vector scan strategy
The helix scan strategy was developed to reduce the deformation in the melted layer caused by steep thermal gradients [5]. The helix scan strategy is best suited for the production of complex parts. The helix strategy requires the use of a Voronoi diagram of each build layer; a toolpath algorithm is then used to generate recursive helix scan paths for each layer [38], [39]. Because the scan paths are different for each layer, the bonding strength is increased. Figure 4 illustrates the helix scan strategy. There are many different ways in which one could expose the helix scan strategy. The vectors could change direction after each exposure, or one could expose the vectors from the outside to the inside and vice versa [20]. The helix scanning strategy is used to reduce residual stresses and deformation in the part [20].
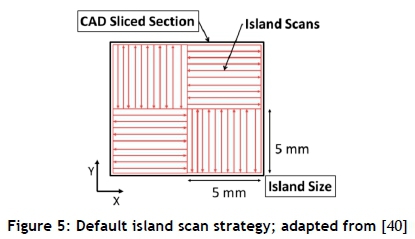
3.2.3 Island scanning strategy
The 'island' scanning strategy, developed and patented by Concept Laser GmbH, can be seen in Figure 5. This is the default pattern on the Concept Laser M2 Cusing machine. This strategy attempts to alleviate thermally induced residual stresses by discretising the exposure area into smaller sections (5 mm by 5 mm by default), termed 'islands'. The islands are scanned in a random sequence with shortened scan tracks, which means that localised heating of large sections does not take place [40]. Localised thermal gradients, and subsequently residual stress, are reduced when using the island scan strategy [8], [41].
3.3 Layer scan strategies
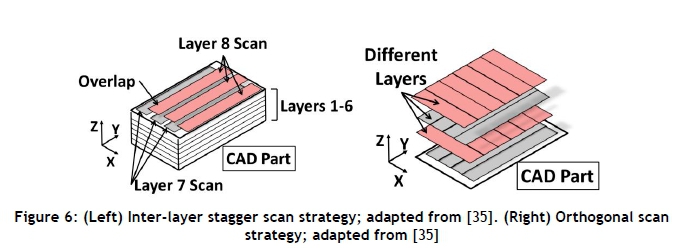
3.3.1 The inter-layer stagger scanning strategy, and orthogonal scan strategy
The inter-layer stagger strategy (also referred to as the 'refill' or 'knitting' strategy) is used to repair defects in the previously scanned layers by scanning the next layer at an offset so that the laser scans at the scan track overlapping zone [35], [42]. Often powder situated in the overlapping zone is not completely melted. This strategy corrects this flaw by melting all of the powder situated in the overlapping zone, resulting in stronger bonds between layers. The inter-layer stagger scan strategy is shown on the left in Figure 6. It is used to improve the quality, porosity, and bonding strength between layers of the part. The orthogonal scan strategy is when successive layers are scanned orthogonally to each other [42]. This strategy is used to reduce the stress build-up along the scans by changing the direction of the scan after each layer [35]. Figure 6 on the right shows four different layers. Layers 1 and 3 are scanned in the y-direction, and layers 2 and 4 are scanned in the x-direction. The orthogonal scan strategy reduces residual stress and part porosity.
The island scan strategy uses a combination of different vector and layer strategies. The islands are scanned using a progressive scan strategy with an inter-layer stagger scan strategy. Each island is scanned at a 45 degree angle, and the next layer is shifted by a user-defined dimension in the x and y direction.
4 SCAN STRATEGY DEVELOPMENT
With the purpose of developing a scan strategy that reduces the residual stress in a part, several studies and results had to be compared. The results from these studies are as follows:
-
A long scan vector leads to high residual stress within the melt track and subsequent distortion of the structure [43].
-
Differently orientating the scan vectors for every layer leads to a reduction of residual stress [8], [44].
-
Subdivision of the layer into smaller parts results in lower maximum stress values [4].
-
Alternating the vector direction results in a higher density due to less un-melted zones [8].
-
The helix scan strategy significantly reduces the residual stress in a part [5].
-
The alternating layers should be offset and orthogonal to each other [42].
-
Exposing the islands in sectors along the layer reduces the residual stress in the part [4].
The newly developed scan strategy is based on a number of different existing strategies. The vector exposure strategies encompass the style in which the vectors of the hatch and contours are scanned. The segment exposure strategy involves the manner in which the sections in a part layer are scanned. The layer scan strategy involves the orientation and position of the vectors in a layer.
4.1 Vector exposure strategy
4.1.1 Hatch fill vector scanning strategy
The newly developed scan strategy is shown in Figure 7. The sequence in which the helical vectors are scanned was determined in a scanning strategy deformation experiment, in which the strategies were exposed on to a bed of powder and observed. The newly developed scan strategy has been termed the 'varying-helix island scan' strategy.
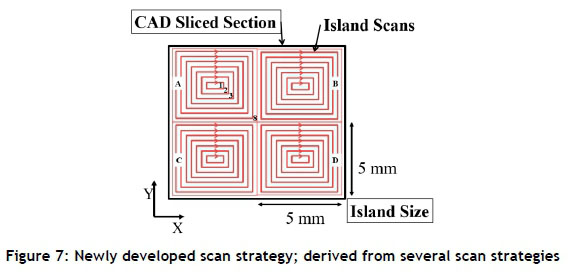
The laser begins in island A and scans vector set 1. Once vector set 1 is scanned, the laser moved to island B and scan vector set 1, and continues likewise until all the vector 1 sets in all of the islands have been scanned. The laser then moves to vector set 2 and repeats the same process as before. It progresses until all the vector sets in all the islands have been scanned. This should reduce the thermal gradient and the yield stress of the material [45] due to a greater time lapse between adjacent vector exposure. The heat input that has not fully dissipated from the scanned vector will act as a preheating mechanism for the next scan vector that is scanned next to it. The latter scan vector ultimately anneals the previously exposed vector [36], [46].
4.1.2 Island contour scanning strategy
The next strategy is a method of joining all the islands together so that the porosity is reduced. To compare this with the machine's default strategy: the space between islands is set to zero, and the distance between the island vectors would be equal to the hatch spacing parameter of the default strategy. In Figure 7 the vector sets have been labelled from 1 to 8, and the islands have been labelled A, B, C, and D. During development iterations of the new strategy, vector set 8 was scanned in all the islands, one after another. This caused the islands to fuse together and act as one long melt pool, which led to a large stress build-up in those vector sets [26], [43], [47]. In order to counter this, the new strategy allows the laser to scan only the outer vector sets (8) that are not adjacent to each other. For example, the laser will not scan A and B at the same time, but would rather scan islands A and D at the same time; then, after a predefined period of time, the laser will scan islands B and C. This maintains an island structure, and avoids long melt pools by allowing the islands enough time to cool and set before they are fused together with other islands.
4.2 Segment exposure strategy
This strategy was designed to expose sectors of the final part in a structured, incremental way. The way in which the scan strategy is exposed is shown in Figure 8.
One can observe from the figure that the whole part is broken up into 24 sectors of 25 mm x 5 mm. The sectors are scanned by the laser in numerical order until the entire sector is completely melted before moving over to the next sector. So the laser will scan sector 1 until the entire sector is solidified; the laser will then move to sector 2; and so on. This then allows for distributed heat input into the layer.
5 EXPERIMENTAL SETUP AND DESIGN
5.1 Experi mental design
To determine whether changing the scan strategies would affect the geometrical deviation of hybrid parts (and subsequently SLM parts) manufactured with a commercial SLM machine, the following experiment was designed. The process steps are described in the sections that follow.
5.2 Sample preparation
Six titanium alloy base plates of equal geometry were stress-free and annealed before SLM. These base plates were cut from an annealed billet of Ti-6Al-4V ELI with the dimensions 120 mm (L) x 25 mm (W) x 10 mm (H). In each of the hybrid base plates, an M8 hole was drilled and tapped in the centre of the billet in order to attach the plates to the machine, but leaving the edges free for warping during the SLM process. The M8 screw should not interfere with the warping of the material as it is expected that the bending moment caused by the residual stress should act around the centre of the billet. Machined billets are referred to as 'hybrid base plates' for the SLM process.
5.3 Pre SLM base plate measurements
Prior to SLM, the top surface geometry of each hybrid base plate was measured with a Mitutoyo Bright A710 coordinate measuring machine (CMM) to ascertain whether machining induced an error resulting in non-flat initial surfaces. The sampling density required 222 points to be measured; so the CMM tool path was five lines along the length, each with 45 sampling points.
5.4 Building the samples
Hybrid base plates were then sand-blasted and demagnetised. The plates were cleaned by sonication for 10 minutes in acetone, ethanol, and distilled water respectively. A base plate was then screwed on to the centre of the SLM building plate with the largest dimension parallel to the coater. In order to compare the two scanning strategies correctly, three samples of each strategy were built using the Concept Laser M2 Cusing machine. Three samples of each strategy were also built for porosity evaluation. These samples were 10 mm x 10 mm x 10 mm.
5.5 Process parameters
The process parameters for the experiment were the default parameters for the M2 Cusing machine. The laser power was set to 100 W, the scan speed to 600 mm/s, the spot diameter to 0.15 mm, the hatch spacing to 0.105 mm, and the layer thickness to 30 Mm. Since the scan strategy was the only independent variable of interest, process parameters were kept constant throughout the duration of the experiment.
5.6 Scanning strategies
The machine's default strategy (Figure 5) was the benchmark, and the newly developed strategy (Figure 7) was applied for a comparison of warping. The two scanning strategies were discussed in the previous section.
5.7 Measurement of post-SLM parts 5.7.1 Geometric deviation
A total of 222 data points were measured with a CMM along the x axis on the bottom surface of the titanium base plate. These 222 data points were divided into five lines that were spread across the surface. The specimens were left on the CMM table for a day before the measurements were performed to reduce any deviation due to thermal expansion or contraction. The tool path of the probe and sampling points are shown in Figure 9.
5.7.2 Porosity evaluation
The samples were analysed for porosity using computerised tomography (CT) scanning at the Central Analytical Facility (CAF) at Stellenbosch University. The measurements were performed on a General Electric V|Tome|X L240 MicroCT by the facility. It is important to note that the process has a limited resolution due to the voxel size and that therefore pores smaller than 0.00002 mm3 are not accurately accounted for.
5.8 Statistics
A repeated measures analysis of variance (ANOVA) was performed on the CMM results (a = 0.05). The null hypothesis was set that all specimens are from the same population. Scan strategy was the independent variable, and dependent variables are the deviation along the x axis before and after SLM treatment. The CT scan data was critically analysed, and the porosity and pore size distribution were calculated and plotted. A two-tailed student T-test was performed on the data.
6 EXPERIMENTAL RESULTS AND DISCUSSIONS
6.1 Deviation results
Two samples produced with different scan strategies are presented in Figure 10. It can be noted that the deviation from the default strategy (left side) is larger than that of the new scan strategy (right side). This is initially demonstrated qualitatively by finding the largest gauge block that could fit between the sample and the building plate. For the default strategy, a 2.0 mm thick gauge block fitted, whereas the maximum thickness that would fit underneath the new scan strategy sample was 1.5 mm. This observation was then fully quantified with CMM measurements.
Figure 11 presents a scatterplot of the Z-deformation against the position of measurement in the X-direction (according to Figure 10). Deformation in the Z-direction is represented by the difference between the pre- and post-SLM CMM measurements. The samples warped in a parabolic shape from the fixation point in the centre outward towards the part edges. This observation is in accordance with Figure 2, and the net effect is most prominent on the largest dimension of the part.
The quadratic function that defines the parabolic trend line for the default scan strategies is:

and the deformation from the newly developed scan strategy is defined by:

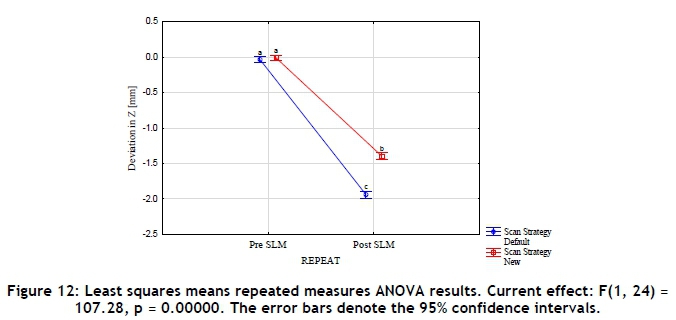
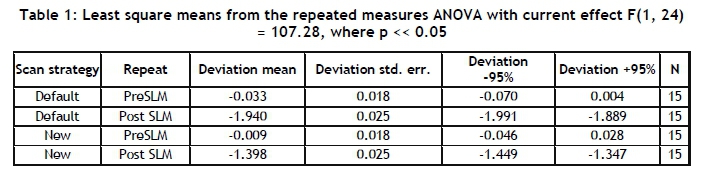
The gradient coefficient for the default strategy is greater than that of the new strategy. This indicates that the deviation of the samples produced with the newly developed strategy increased at a slower rate than those produced with the default strategy. A repeated measures analysis of variance was performed on all of the results from the CMM readings. The standard error of estimate was 0.0684, and sigma-restricted parameterisation was used. The least squares mean results from the ANOVA are plotted on the graph in Figure 12. The samples 'pre-SLM' and 'post-SLM' were tested for significant difference with regard to the scan strategy.
The difference in the readings of the base plates before the SLM process was not significant. It can also be observed that the two scan strategies differ significantly with regard to the deviation in the Z-direction post-SLM. The two conditions differed significantly on scan strategy, F(1,24) = 107.28, with p-value orders of magnitude less than 0.05. Thus the null hypothesis can be rejected, and the different scan strategies cannot be assumed to yield samples that represent the same population.
In support of the significant difference in the means, one can observe, by looking at the 95 percent confident intervals, that the worst deviation of the new strategy is less than the best deviation of the default strategy. An average decrease in deviation of 27.95 percent was observed between the two scanning strategies, in favour of the newly developed scan strategy.
6.2 Porosity results
Reduction in deviation could be attributed to the relief of residual stress from porosity in the part or from the scan strategy. A porosity evaluation is therefore fundamental to determining whether porosity was the main contributing factor to the reduction in deviation. The porosities from the CT scans can be observed in Table 2.
A two-tailed student T-test was conducted. The null hypothesis was rejected, and there is a significant difference (p = 0.0023) between the default and the new strategy with regard to porosity. The difference in standard deviation could be attributed to the fact that the newly developed strategy is structured, and each part was scanned with exactly the same hatch pattern and strategy; thus the standard deviation is small. However, the default scan strategy is a stochastic process, and thus no two parts will have the same layers; so the standard deviation is larger.
6.2.1 Pore analysis
The CT scan images of the two different strategies can be observed in Figure 13.
One can note from the default scan strategy sample that the pores were found to be in an island pattern, with a 1mm shift in the x and y direction for each layer. This could have been caused by sub-optimal laser parameters being used, or by the laser not switching off when shifting to a different scan track. This causes a sharp turn where gas or powder can be trapped. With the helix scan strategy, an X shape is apparent. This is due to the laser parameters not being adjusted for the helix strategy. The pores occur on the corners of the squares in the helix pattern. The laser does not tend to follow the vectors completely, and forms a radius when moving from one vector to a perpendicular one. Both of these problems could be solved with laser parameter optimisation.
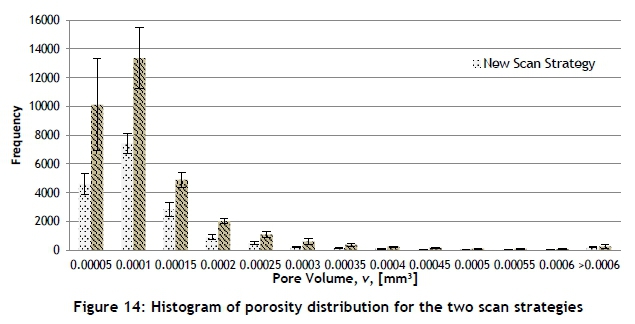
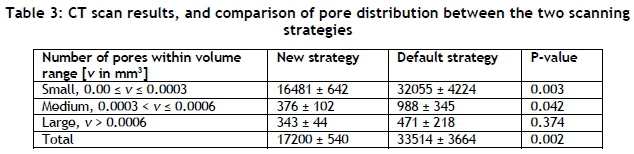
Figure 14 presents a graphic representation of the average pore size distribution and standard error within the specimens. First of all, it is evident that the default scanning strategy has both a larger number of pores and variation between specimens. It is interesting to note that both distributions follow a typical Poisson distribution profile, with a small value for parameter lambda. This indicates that the probability of obtaining small pores is much higher than for observing large ones. In fact, both strategies yielded only a few pores larger than 0.00035 mm3. The total number of pores from the new strategy is significantly less than that of the default strategy (P = 0.002). However, given the distribution profile, comparing the total number of pores does not provide sufficient insight into the resulting pore volume frequencies. Therefore the strategies were further analysed by pore volume categories.
Based on Figure 14, the pore size distribution between the scanning strategies was indexed for pore volume ranges of (v) - namely, small (0 mm3 < v < 0.0003 mm3), medium (0.0003 mm3 < v < 0.0006 mm3), and large (v > 0.0006 mm3). The results are presented in Table 3.
The new strategy led to a significant reduction in small pores, and a borderline significant reduction in medium pores. There is no significant difference in the number of large pores. This is interesting, since it suggests that reduction in warping can be ascribed neither to increased porosity nor to larger pore volumes in specimens produced with the new scanning strategy. Furthermore, the ratio of standard deviation to number of pores is higher for each index with the default strategy, which implies that there is more variation between specimens, and therefore less consistency with regard to quality.
7 CONCLUSION AND FUTURE WORK
Certain aspects of the SLM process still inhibit it from mass integration into product process chains. This paper emphasises one of these aspects, namely geometrical deviation due to warping. It has been proposed that the scan strategy significantly affects this phenomenon. Several scan strategies from the literature have been presented, and the shortcomings associated with them discussed. From these, a new varying-helix island scanning strategy with the objective of reducing geometrical deviation has been developed and experimentally tested against the default island scan strategy on a commercial SLM machine. The results showed a significant reduction in geometrical deviation and porosity for the newly developed scan strategy. Default scan strategies on commercial SLM machines should therefore not be assumed to be optimal.
Future work should include isolating the fundamental aspects of the scan strategies, such as the time difference between vector exposure, scan patterns, islands or no islands, and the interlayer position shifts. In an ideal situation these effects should be evaluated for a single layer. However, this is challenging, since a substrate needs to be present in order to confine the heat dispersion to a single layer. Furthermore, a processing parameter optimisation on the newly developed scan strategy needs to be performed in order to gain more insight into the potential beneficial effects on part properties.
REFERENCES
[1] Hagedorn-Hansen, D., Cichon, R., Bezuidenhout, M.B., Hugo, P.A. and Oosthuizen, G.A. 2015. Geometric deviation of hybrid parts produced by selective laser melting, in Rapid Product Development Association of South Africa, pp. 1-9. [ Links ]
[2] Herzog, F.C. 2004. Metallisches Werkstück sowie Verfahren zur Herstellung eines metallischen Werkstückes, DE 10229952A1. [ Links ]
[3] Ott, M. 2012. Multimaterialverarbeitung bei der additiven strahl- und pulverbettbasierten Fertigung, Universität München. [ Links ]
[4] Mercelis P. and Kruth, J.-P. 2006. Residual stresses in selective laser sintering and selective laser melting, Rapid Prototyp. J., 12(5), pp. 254-265. [ Links ]
[5] Qian, B., Shi, Y.S., Wei, Q.S. and Wang, H.B. 2012. The helix scan strategy applied to the selective laser melting, Int. J. Adv. Manuf. Technol., 63(5-8), pp. 631-640. [ Links ]
[6] Knowles, C.R., Becker, T.H. and Tait, R.B. 2012. Residual stress measurements and structural integrity implications for selective laser melted Ti-6AL-4V, South African J. Ind. Eng., 23(2), pp. 119-129. [ Links ]
[7] Yasa, E., Kruth, J.-P. and Deckers, J. 2011. Manufacturing by combining selective laser melting and selective laser erosion/laser re-melting, CIRP Ann. - Manuf. Technol., 60(1), pp. 263-266. [ Links ]
[8] Kruth, J.-P. and Badrossamay, M. 2010. Part and material properties in selective laser melting of metals, in Proceedings of the 16th International Symposium on Electromachining. [ Links ]
[9] Qiu, C., Adkins, N.J.E. and Attallah, M.M. 2013. Microstructure and tensile properties of selectively laser-melted and of HIPed laser-melted Ti-6Al-4V, Mater. Sci. Eng. A, 578, pp. 230-239. [ Links ]
[10] Dadbakhsh, S., Hao, L. and Sewell, N. 2012. Effect of selective laser melting layout on the quality of stainless steel parts, Rapid Prototyp. J., 18(3), pp. 241-249. [ Links ]
[11] Shiomi, M., Osakada, K., Nakamura, K., Yamashita, T. and Abe, F. 2004. Residual stress within metallic model made by selective laser melting process, Ann. CIRP, 53(1), pp. 195-198. [ Links ]
[12] Hassanin, H., Modica, F., El-Sayed, M.A., Liu, J. and Essa, K. 2016. Manufacturing of Ti-6Al-4V micro-implantable parts using hybrid selective laser melting and micro-electrical discharge machining, 18(9), pp. 1544-1549. [ Links ]
[13] Santos, E., Abe, F., Kitamura, Y., Osakada, K. and Shiomi, M. 2002. Mechanical properties of pure titanium models processed by selective laser melting, in Proceedings of the Solid Freeform Fabrication Symposium, pp. 180-186. [ Links ]
[14] Chatterjee, A.N., Kumar, S., Saha, P., Mishra, P.K. and Choudhury, A. Roy. 2003. An experimental design approach to selective laser sintering of low carbon steel, J. Mater. Process. Technol., 136(1-3), pp. 151 - 157. [ Links ]
[15] Abe, F., Costa Santos, E., Kitamura, Y., Osakada, K. and Shiomi, M. 2003. Influence of forming conditions on the titanium model in rapid prototyping with the selective laser melting process, Proc. Inst. Mech. Eng. Part C J. Mech. Eng. Sci., 217(1), pp. 119-126. [ Links ]
[16] Dadbakhsh, S., Hao, L., Jerrard, P.G.E. and Zhang, D.Z. 2012. Experimental investigation on selective laser melting behaviour and processing windows of in situ reacted Al/Fe 2O 3 powder mixture, Powder Technol., 231, pp. 112-121. [ Links ]
[17] Yadroitsev, I., Krakhmalev, P. and Yadroitsava, I. 2015. Hierarchical design principles of selective laser melting for high quality metallic objects, Addit. Manuf., 7, pp. 45-56. [ Links ]
[18] Yadroitsev, I. 2009. Selective laser melting: Direct manufacturing of 3D-objects by selective laser melting of metal powders, Saarbrucken: LAP Lambert Academic Publishing AG & Co. KG. [ Links ]
[19] Dimitrov, D., Becker, T.H., Yadroitsev, I. and Booysen, G. 2016. On the impact of different system strategies on the material performance of selective laser melting- manufactured Ti6Al4V components, South African J. Ind. Eng., 27(3), pp. 184-191. [ Links ]
[20] Nickel, A.H., Barnett, D.M. and Prinz, F.B. 2001. Thermal stresses and deposition patterns in layered manufacturing, Mater. Sci. Eng. A, 317(1-2), pp. 59-64. [ Links ]
[21] Casavola, C., Campanelli, S.L. and Pappalettere, C. 2008. Experimental analysis of residual stresses in the selective laser melting process, in Proceedings of the XIth International Congress and Exposition. [ Links ]
[22] Simchi, A. 2006. Direct laser sintering of metal powders: Mechanism, kinetics and microstructural features, Mater. Sci. Eng. A, 428(1-2), pp. 148-158. [ Links ]
[23] Aboulkhair, N.T., Everitt, N.M., Ashcroft, I. and Tuck, C. 2014. Reducing porosity in AlSi10Mg parts processed by selective laser melting, Addit. Manuf., 1, pp. 77-86. [ Links ]
[24] Kempen, K., Thijs, L., Vrancken, B., van Humbeeck, J. and Kruth, J.-P. 2013. Producing crack-free, high density M2 Hss parts by selective laser melting: Pre-heating the baseplate, Proc. 24th Int. Solid Free. Fabr. Symp. , pp. 131 -139. [ Links ]
[25] Aggarangsi P. and Beuth, J. 2006. Localized preheating approaches for reducing residual stress in additive manufacturing, Proc. SFF Symp., Austin, pp. 709-720. [ Links ]
[26] Rombouts, M. 2006. Selective laser sintering/melting of iron-based powders, KU Leuven. [ Links ]
[27] Kruth, J.-P., Froyen, L., van Vaerenbergh, J., Mercelis, P., Rombouts, M. and Lauwers, B. 2004. Selective laser melting of iron-based powder, J. Mater. Process. Technol., 149(1-3), pp. 616-622. [ Links ]
[28] Ma, L. and Bin, H. 2006. Temperature and stress analysis and simulation in fractal scanning-based laser sintering, Int. J. Adv. Manuf. Technol., 34(9-10), pp. 898-903. [ Links ]
[29] Yuan, P. and Gu, D. 2015. Molten pool behaviour and its physical mechanism during selective laser melting of TiC/AlSi10Mg nanocomposites: Simulation and experiments, J. Phys. D. Appl. Phys., 48(3). [ Links ]
[30] Gibson, I., Rosen, D.W. and Stucker, B. 2010. Additive manufacturing technologies: Rapid prototyping to direct digital manufacturing. New York: Springer. [ Links ]
[31] Wegner, A. and Witt, G. 2011. Process monitoring in laser sintering using thermal imaging, Proc. Solid Free. Fabr. Symp. , pp. 405-414. [ Links ]
[32] Jhabvala, J., Boillat, E., Antignac, T. and Glardon, R. 2010. On the effect of scanning strategies in the selective laser melting process, Virtual Phys. Prototyp., 5(2), pp. 99-109. [ Links ]
[33] Mertens, R., Clijsters, S., Kempen, K. and Kruth, J.-P. 2014. Optimization of scan strategies in selective laser melting of aluminum parts with downfacing areas, J. Manuf. Sci. Eng., 136(April 2016), p. 61012. [ Links ]
[34] Thijs, L., Verhaeghe, F., Craeghs, T., van Humbeeck, J. and Kruth, J.-P. 2010. A study of the microstructural evolution during selective laser melting of Ti-6Al-4V, Acta Mater., 58(9), pp. 3303-3312. [ Links ]
[35] Morgan, R.H., Papworth, A.J., Sutcliffe, C., Fox, P. and O'Neill, W. 2002. High density net shape components by direct laser re-melting of single-phase powders, J. Mater. Sci., 37(15), pp. 3093-3100. [ Links ]
[36] Zaeh, M.F. and Branner, G. 2010. Investigations on residual stresses and deformations in selective laser melting, Prod. Eng. Res. Dev. , 4(1), pp. 35-45. [ Links ]
[37] Stamp, R., Fox, P., O'Neill, W., Jones, E. and Sutcliffe, C. 2009. The development of a scanning strategy for the manufacture of porous biomaterials by selective laser melting, J. Mater. Sci. Mater. Med., 20(9), pp. 1839-1848. [ Links ]
[38] Qian, B., Zhang, L.C., Shi, Y.S. and Liu B. 2008. Voronoi approach to recursive generation of tool path for SLS., CADDM, 18(2), pp. 13-30. [ Links ]
[39] Qian, B., Zhang, L.C., Shi, Y.S. and Liu, B. 2009. Recursive polygon offset computing for rapid prototyping applications based on Voronoi diagrams, Int. J. Adv. Manuf. Technol., 49, pp. 1019-1028. [ Links ]
[40] Yasa, E. and Deckers, J. 2009. Investigation on occurrence of elevated edges in selective laser melting, in International Solid Freeform Fabrication Symposium, pp. 180-192. [ Links ]
[41] Cheng, B., Shrestha, S. and Chou, K. 2015. Stress and deformation evaluations of scanning strategy effect in selective laser melting, Addit. Manuf., 12, pp. 240-251. [ Links ]
[42] Di, W., Yongqiang, Y., Xubin, S. and Yonghua, C. 2012. Study on energy input and its influences on single-track, multi-track, and multi-layer in SLM, Int. J. Adv. Manuf. Technol., 58(9-12), pp. 1189-1199. [ Links ]
[43] Klahn, C., Bechmann, F., Hofmann, S., Dinkel, M. and Emmelmann, C. 2013. Laser additive manufacturing of gas permeable structures, Phys. Procedía, 41, pp. 873-880. [ Links ]
[44] Thijs, L., Montero Sistiaga, M.L., Wauthle, R., Xie, Q., Kruth, J.-P. and van Humbeeck, J. 2013. Strong morphological and crystallographic texture and resulting yield strength anisotropy in selective laser melted tantalum, Acta Mater., 61(12), pp. 4657-4668. [ Links ]
[45] Vrancken, B. 2016. Study of residual stresses in selective laser melting, KU Leuven, 2016. [ Links ]
[46] Agarwala, M., Bourell, D., Beaman, J., Marcus, H. and Barlow, J. 1995. Direct selective laser sintering of metals, Rapid Prototyp. J., 1(1), pp. 26-36. [ Links ]
[47] Wang, D., Yang, Y., Yi, Z. and Su X. 2013. Research on the fabricating quality optimization of the overhanging surface in SLM process, Int. J. Adv. Manuf. Technol., 65(9-12), pp. 1471-1484. [ Links ]
* Corresponding author devonh@sun.ac.za

