


Services on Demand
Article
 English (pdf)
 Article in xml format
 Article references
Indicators

Related links
-
 Cited by Google
 -
 Similars in Google
Share

 Permalink
South African Journal of Industrial Engineering
On-line version ISSN 2224-7890
Print version ISSN 1012-277X
S. Afr. J. Ind. Eng. vol.28 n.3 Pretoria 2017
http://dx.doi.org/10.7166/28-3-1861
GENERAL ARTICLES
High cycle fatigue properties of as-built Ti6AL4V (ELI) produced by direct metal laser sintering
L.B. Malefane*, #; W.B. du Preez; M. Maringa
Department of Mechanical and Mechatronic Engineering, Central University of Technology, Free State, South Africa
ABSTRACT
The high cycle fatigue (HCF) properties of direct metal laser sintering (DMLS) of Ti6Al4V (ELI) in three mutually orthogonal build directions were investigated by cycling specimens under load control, in a tension-tension fatigue testing machine. Semi-log graphs of maximum stress (S) against life (N) of the specimens produced along the respective three build directions were plotted, and the displayed endurance limits compared. Optical and scanning electron microscopy were used to compare and analyse the crack initiation and propagation characteristics of the specimens. The influence of the build direction on the fatigue properties of the tested specimens is discussed here.
OPSOMMING
Die hoësiklus vermoeidheidseienskappe van direkte metaallaser sintering van Ti6Al4V in drie onderlinge ortogonale bourigtings is ondersoek deur monsters te onderwerp aan beheerde sikliese ladings met behulp van 'n trek-trek vermoeidheidstoetsmasjien. Semi-log grafieke van maksimum spanning teen leeftyd (S-N grafieke) is vir die monsters saamgestel, saam met die onderskeie bou rigtings. Sodoende kon die vermoeidheidslewe vergelyk word. Optiese- en skandeer elektronmikroskopie is gebruik om die kraakvorming en -voortplanting te vergelyk en te analiseer. Die invloed van die bourigting op die vermoeidheidseienskappe van die monsters is bespreek.
1 INTRODUCTION
Work done by the Centre for Rapid Prototyping and Manufacturing (CRPM) of the Central University of Technology Free State on the manufacture of parts using direct metal laser sintering (DMLS) of Ti6Al4V (ELI) powder has thus far been based on the static mechanical properties of such DMLS parts that have been stress-relieved. These static mechanical properties were found to conform to the properties of standard wrought Ti6Al4V (ELI) [1, 2]. However, for DMLS Ti6Al4V (ELI) parts that are expected to experience cyclic loading, there is uncertainty that they will last their full operational life. This is due to limited available fatigue life data for the DMLS-produced alloy.
This study presents baseline data and analyses on as-built DMLS Ti6Al4V (ELI), as a precursor to studies of DMLS Ti6Al4V (ELI) that is heat treated in order to tailor its microstructure to give the best high cycle fatigue (HCF) properties possible.
1.1 Sources of fatigue failure in as-built DMLS of Ti6Al4V (ELI)
DMLS is a selective laser melting (SLM) process that fuses metal powder in an inert atmosphere (typically argon). The process uses a scanning laser beam to form three dimensional objects in a layer-upon-layer build-up, based on three-dimensional computer aided design (CAD) model data input [3]. DMLS of Ti6Al4V is increasingly used in the biomechanical, aerospace, and automotive industries because of its ability to produce custom geometrically complex designs to high tolerances and with minimal material waste [4]. Ti6Al4V is used in the aforementioned industries because it is corrosion resistant, has a good strength-to-weight ratio and is bio-compatible [5, 6]. The Ti6Al4V powder used in DMLS is a pre-alloyed gas atomised powder that exists as an alpha/beta (a + β) alloy at room temperature [7].
SLM of Ti6Al4V (ELI) results in the formation of a martensitic microstructure (α') of the alloy, and generates thermally induced residual stresses in the parts built. Both the a! microstructure and the residual stresses are effects of the high temperature gradient of the process arising from the rapid solidification of layers as they are formed. The a! microstructure is supersaturated a resulting from a non-equilibrium phase transformation of Ti6Al4V (ELI) [8]. When each layer is built, the solidified underlying layers are re-melted and subsequently cooled. The contraction of these re-melted layers upon cooling is restricted by the underlying solidified layers, imposing tension within them as they solidify [9]. The re-melting of underlying layers is repeated several times as the layers are built up, and there is a decrease in temperature with increasing depth of the layers from the surface. This temperature gradient results in a thermal stress gradient that starts from compression at the lowest layers to tension at the surface [9, 10]. The stress gradient follows the temperature gradient, based on the following equation:
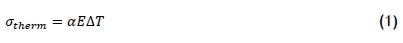
The thermal stresses are locked within the SLM parts because of the high cooling rate inherent in the DMLS process [11]. Tensile residual stresses are unfavourable in tension-tension fatigue loading because they promote crack initiation and propagation.
Apart from residual stress, SLM parts can also have a level of porosity and display uneven surfaces in the manufactured parts. Pores and surface roughness act as stress concentration sites, and therefore lower the fatigue properties of SLM-processed Ti6Al4V (ELI). Surface roughness is not a concern of this paper, as it is based on the investigation of machined and polished SLM Ti6Al4V (ELI) fatigue specimens, thereby eliminating the negative effect of surface roughness on fatigue. Porosity arises from un-melted or semi-melted metal powder; the pores are normally oval-shaped and located between two consecutive layers during the SLM process [12]. Thus their major axis is always horizontal, which brings about anisotropy between horizontally and vertically built SLM parts. Work carried out in CRPM shows SLM Ti6Al4V (ELI) parts to have a porosity of about 0.0022 per cent [1]. This high densification minimises the possibility of fatigue cracks initiating from pores.
The foregoing phenomenon alone or in combination with residual stress may lower the fatigue properties of as-built DMLS Ti6Al4V (ELI) parts.
2 EXPERIMENTAL PROCEDURE
In this study, the as-built DMLS Ti6Al4V (ELI) fatigue specimens were first turned to size and then polished using a Morrison specimen polishing machine, thereby eliminating the effect of surface irregularities on the fatigue properties.
2.1 Preparation of specimens
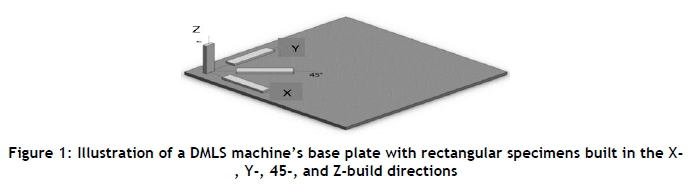
Thirty rectangular bars of width (W) = 11 mm, height (H) = 11 mm, and length (L) = 60 mm were manufactured using an EOSINT M 280 DMLS machine set to the standard parameters of the supplier. Figure 2 shows the DMLS build platform, with four rectangular bars representing the four build directions with reference to the re-coater arm movement. In this study, test specimens were built along the X-, Y- and Z-build directions. For the X-build direction, the length of the bar is built parallel to the re-coater arm movement in the X-Y plane. For the Y-build direction the bar length is built perpendicular to the re-coater movement in the X-Y plane, and for the Z-direction the length is built vertical to the X-Y plane. A total of 30 rectangular bars were built: samples 1-10 in the X direction, samples 11 -20 in the Y direction, and samples 21 -30 in the Z direction.
2.2 Machining and polishing of the samples
The DMLS TÍ6A14V (ELI) rectangular bars were turned to the dimensions of fatigue test specimens recommended in ASTM E466-15 and ISO 1099. The grip ends of the specimens were threaded to minimise slip between the specimens and the gripping device on the fatigue test frame. Polishing of the fatigue specimens was done on a Morrison specimen polishing machine in the laboratories at the CSIR in Pretoria, in order to achieve a surface roughness not exceeding 0.1 μm.
2.3 Tension-tension fatigue testing
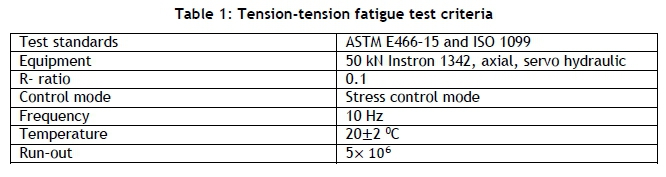
HCF tension-tension fatigue tests of the machined DMLS Ti6Al4V (ELI) specimens were carried out at the same CSIR laboratories under the test criteria tabulated in Table 1.
The maximum stress (amax) loading regime from which the semi-log S-N curves were drawn was set between 675 MPa and 360 MPa in each set of specimens built in each one of the three mutually orthogonal DMLS build directions. The first test specimen in each set of specimens was tested at 675 MPa, which is 60 per cent of the as-built DMLS Ti6Al4V (ELI) yield strength [1]. This is a stress level at which failure was expected to occur after a fairly short number of cycles [13]. The second specimen in each set of specimens was tested at 360 MPa (30 per cent of SLM as-built Ti6Al4V (ELI) tensile strength), where a run-out (5,000,000 load cycles) was expected. The remaining specimens were cycled at amaxlevels set at intervals between 675 MPa and 360 MPa.
3 RESULTS AND DISCUSSION
The fatigue loads of polished (Ra≈ 0.1 μm) as-built DMLS Ti6Al4V (ELI) specimens built along the X-,Y- and Z-build directions and their respective lives were tabulated and presented on a semi-log S-N curve. The data from the fractured specimens in each of the three build directions was linearised on the semi-log S-N curves in accordance with equation 2.

where a is the S intercept and b is the gradient. The linearised fatigue data curves of each set of specimens from the three orthogonal DMLS build directions portrayed an inverse relationship between the maximum stress and the log10 number of life cycles to failure, until a point where each reached its respective fatigue endurance limit. At these endurance limits, the respective curves turned horizontal.
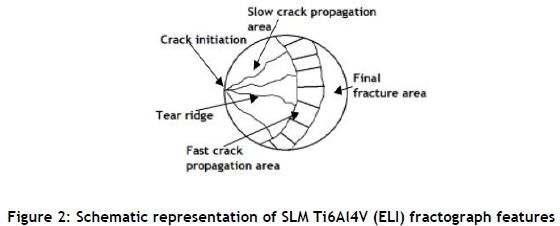
The fractured specimens were analysed in a scanning electron microscope (SEM); all showed features similar to those shown in the schematic in Figure 3, which is typical of metal, and in particular of Ti6Al4V fatigue fracture surfaces [14, 15, 16]. All the fractographs showed areas of crack initiation, slow crack propagation, fast crack propagation, and final fracture. The fatigue cracks of all the fractured specimens initiated either from a surface or sub-surface micro-pore related to the DMLS process. From this micro-pore, the fatigue failure crack propagated at a stable rate over an area that exhibited bright river-like tear ridges. The tear ridges originated from the micro-pore crack initiation sites, and spread out to the stable crack propagation (slow crack propagation) area. Their elevation increased with depth into the stable crack propagation area. This is evident from the fading of the tear ridges with movement towards the immediate area around the micro-pore crack initiation site, as seen in the overall fractographs of the specimens. Fatigue striations were located on the faces of the tear ridges on some specimens, and were oriented perpendicular to the directions of crack propagation. This signifies a bow-out (retreat) of the crack from the crack initiation sites, as observed by Joshi [17] and Milella [18]. The tear ridges died out at the overload zone, an area of unstable crack propagation (fast crack propagation). In this area, crack propagation is consistent with that of a monotonic loading, and is characterised by shallow dimples. After the unstable crack propagation area, the crack reaches a plastic area in which the specimen finally shears.
3.1 X-build direction specimens
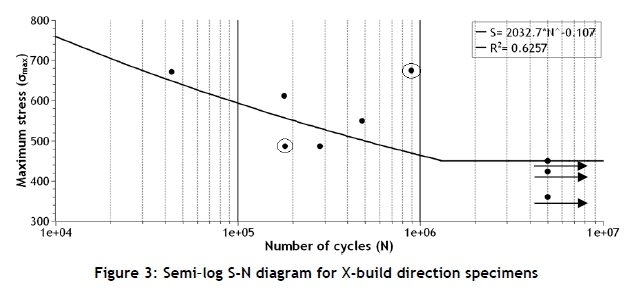
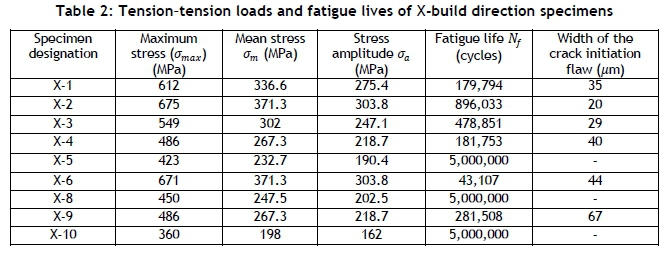
Figure 3 presents a semi-log curve of the maximum stress against the number of load cycles (S-N) of the X-build direction DMLS Ti6Al4V (ELI) specimens, based on the data shown in Table 2.
Linearisation of the curve shown in Figure 3 for the X-build direction specimens was carried out without taking into account the outliers (specimens X-2 and X-4, encircled in the figure). The correlation coefficient (R) of -0.791 indicates a strong inverse linear pattern between δmaxand log10 N, which continues until the knee point of the curve at δmax= 450 MPa, where the curve turns horizontal. The horizontal part of the curve represents the fatigue endurance limit, which is estimated from the highest δmaxof the run-out specimens indicated by arrows [19].
Specimen X-2 showed a high number of cycles to failure at high loads, whereas specimen X-4 showed a low number of cycles to failure at low loads. These results are converse to expectations, and their fracture surfaces were therefore studied in the SEM in an attempt to identify the causes of this unexpected behaviour. The results are shown in Figures 4 and 5.
Figure 4 shows fractographs of specimen X-2, which was cycled at a maximum stress of 675 MPa and fractured after 896,033 cycles.
Fatigue failure of the specimen initiated from the 20 μm wide and 46 μm deep surface pore encircled in Figure 4(c). Fatigue striations shown in Figure 4(d) bow-out from the crack initiation pore in the direction indicated by the arrow in the micrograph. The fatigue striations were magnified from the face of the tear ridge encircled in Figure 4(b). From the overall fractograph in Figure 4(a) it can be seen that the tear ridges run across the entire crack propagation area until the final shear fracture area, indicating a fairly stable crack propagation rate throughout. Across this crack propagation area, internal pores were located and were found to be aligned in the direction of the river ridges, as indicated by arrows in Figure 4(e).
Specimen X-2 showed the mentioned high number of cycles to failure at a high maximum stress load because it had the smallest micro-pore crack initiation site of all the specimens built along the X-build direction. This implies that the stress concentration factor imposed by porosity on this specimen was the lowest. This conclusion is drawn from the theory of fatigue, which states that the majority of the fatigue life of a specimen lies in the crack initiation stage [12, 13].
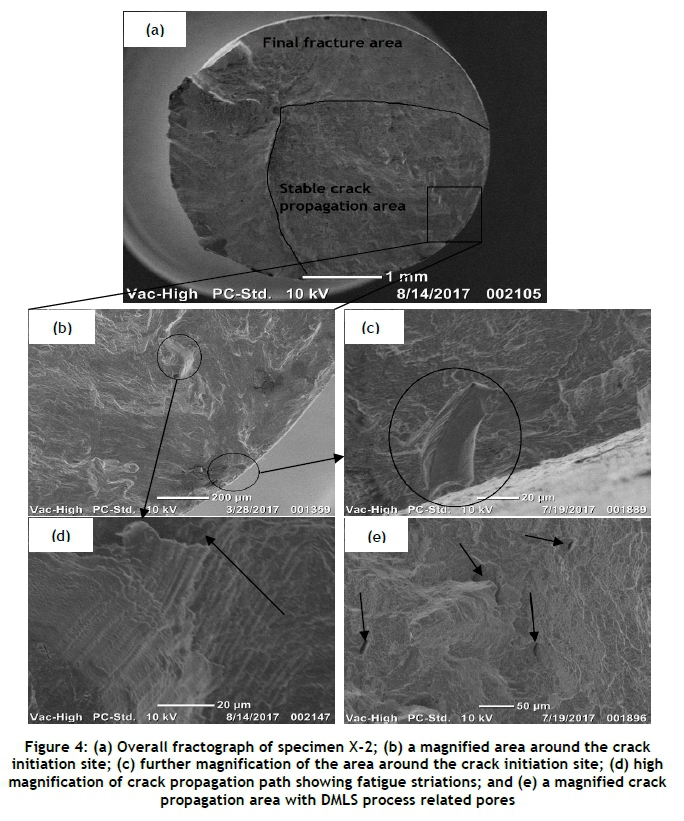
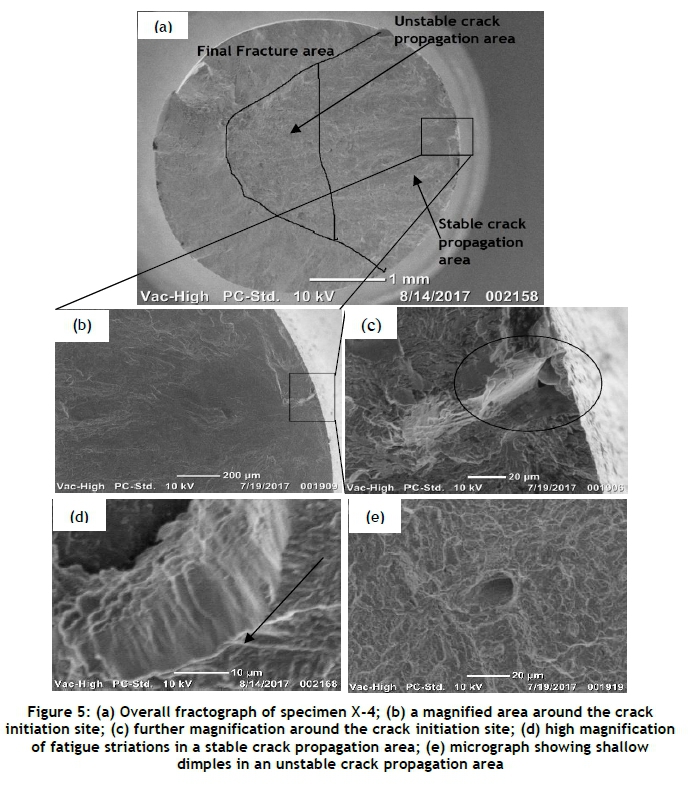
Figure 5 shows fractographs of specimen X-4, which was cycled at maximum stress of 486 MPa and fractured after 181,753 cycles.
Fatigue failure in this specimen initiated from the 40 μm wide and 44 μm deep surface pore encircled in Figure 5(c). The crack propagation area is divided into the stable and unstable crack propagation zones indicated in Figure 5(a). The fatigue striations depicted in Figure 5(d) were found on the face of a tear ridge in the stable crack propagation area and bow-out from the crack initiation pore in a direction indicated by an arrow. Internal micro-pores were located in both crack propagation areas.
The stress concentration factor of the crack initiation pore in this specimen is relatively higher than that in the previous case, and leads to accelerated local plastic deformation that initiates propagation of the crack. The pores located in both the stable and the unstable crack propagation areas provided an easy path for the propagating crack, accelerating its rate of propagation and thus the small number of cycles to failure at a low maximum stress load. The small number of cycles to failure on the fracture surface can also be identified by the coarse striations seen in Figure 5(d), as opposed to the fine striations located on specimen X-2, which endured a high number of cycles to failure.
3.2 Y-build direction specimens
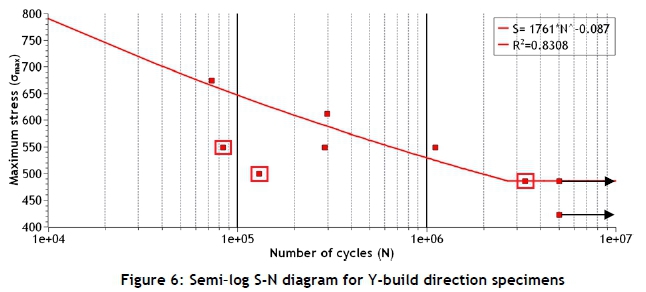
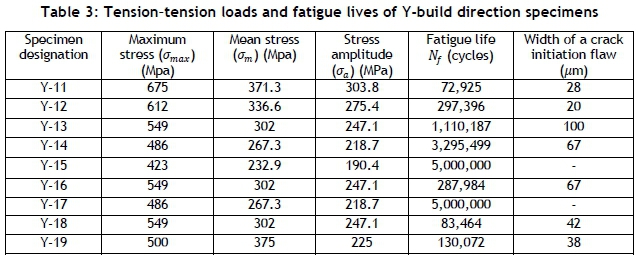
Figure 6 presents a semi-log curve of the maximum stress against the number of load cycles of the Y-build direction DMLS Ti6Al4V (ELI) specimens, based on the data shown in Table 3.
A linear curve was fitted to the data in Table 3, ignoring the outliers Y-14, Y-18 and Y-19, which are indicated by data points enclosed in squares in Figure 6. The data points show a strong inverse linear relationship with a correlation coefficient (R) of -0.9115. The linear curve turns horizontal at δmax = 486 MPa, which is the estimated fatigue endurance limit for the highest δmax of the run-out specimens, indicated by arrows in Figure 6.
Specimen Y-14 was excluded because it failed at 3,295,499 cycles while loaded at the estimated fatigue endurance limit. Specimens Y-18 and Y-19 showed exceptionally low numbers of cycles to failure at stress loads that are above the estimated endurance limit. The fracture surfaces of specimens Y-18 and Y-19 were studied in the SEM in an attempt to identify the causes of their unexpected behaviour. Their fractographs are displayed in Figures 7 and 8.
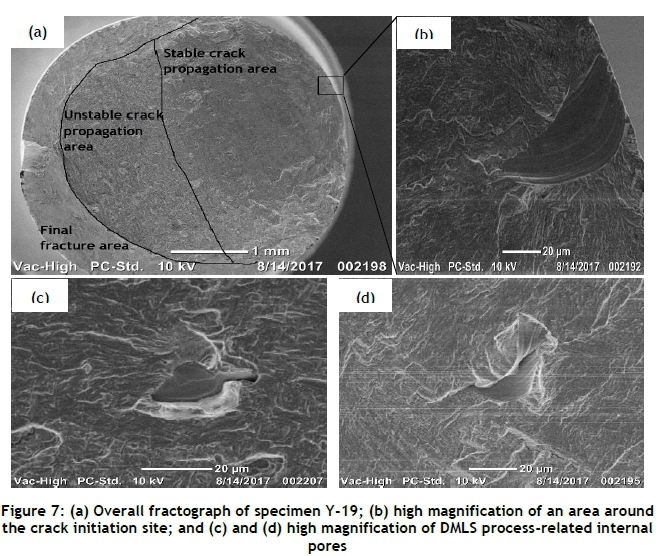
Figure 7 shows the fractograph of specimen Y-19, which was cycled at a maximum stress of 500 MPa and fractured after 130,072 cycles.
The fatigue fracture features of specimen Y-19 are similar to those of specimen X-4 (shown in Figure 6). The crack initiated from a 38 μπι wide and 75 μπι deep surface pore shown in Figure 7(b). The crack propagated at a slow rate (stable crack propagation area) across the specimen, as shown in Figures 7(c) and (d). Multiple comparatively smaller pores with reference to the crack initiation pore of similar geometry to those depicted in Figures 7(c) and (d) were located in the slow crack propagation area.
The specimen Y-19 fractured from a relatively large pore initiated crack. However, multiple internal pores located across the stable crack propagation area locally accelerated the stable crack propagation. The increased crack propagation rate is evident from the relatively small stable crack propagation area seen in Figure 7(a). This gave rise to a low number of cycles to failure at the low maximum stress levels prevailing during cyclic loading of this specimen (approaching the endurance limit).
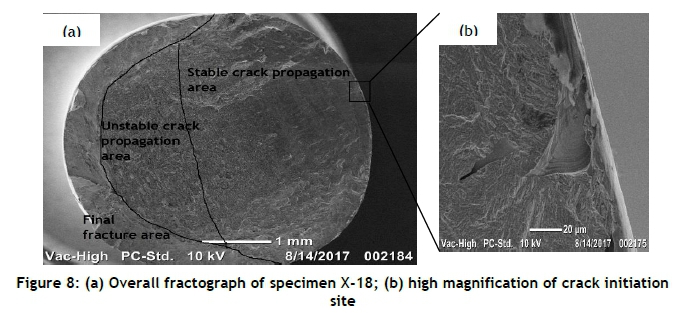
Figure 8 shows the fractographs of specimen Y-18, which was cycled at a maximum stress of 549 MPa and fractured after 83,464 cycles.
The fatigue failure crack of specimen Y-18 initiated from a 42 ßm wide and 29 ßm deep surface pore that is shown in Figure 8(b). The failure surface had fatigue features of the crack initiation site, stable crack propagation, and unstable crack propagation similar to that of specimen X-4 (discussed in section 3.1 above).
The stress concentration factor from the surface pore that initiated the crack for this specimen was lower than those of specimens Y-13 (width = 100 μm and deep = 56 μm) and Y-16 (width = 67 μm and depth = 42μm), which were cycled at the same maximum stress but failed at higher numbers of cycles. A total of eight micro-pores were located on the fracture surface of specimen Y-18, but such numbers of flaws were not found in specimens Y-13 and Y-16. These internal micro-pores are likely to have contributed to the fracture of this specimen at a lower number of cycles than specimens Y-13 and Y-16 for the same maximum stress load. This is because, upon contact of the crack tip with a pore, subsequent merging of the two accelerates the growth of the cracked area towards its critical area (overload area on the specimen).
3.3 Z-build direction specimens
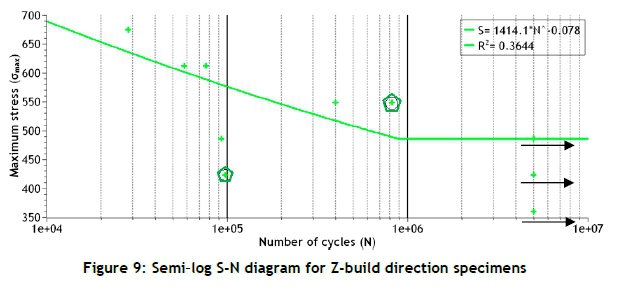
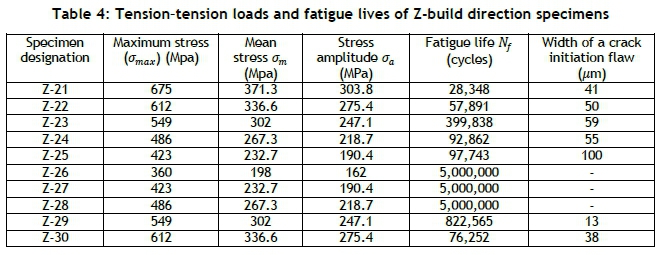
Figure 9 presents a semi-log curve of the maximum stress against the number of load cycles of the Z-build direction DMLS Ti6Al4V (ELI) specimens, based on the data shown in Table 4.
Linear curve fitting through the fatigue data for these specimens was done without including the fatigue data from specimens Z-25 and Z-29, indicated by data points enclosed in pentagons in Figure 9, because they were considered to be outliers. The correlation coefficient (R) of -0.6037 given by these scattered data points is moderate. The curve forms a knee at 486 MPa, where it turns horizontal, given by the highest δmax of run-out specimens, indicated by arrows in Figure 9.
Specimen Z-25 showed a low number of cycles to failure at relatively low load, whereas specimen Z-29 showed a high number of cycles to failure at high load. The fracture surfaces of these outliers were studied in a SEM to identify the reason for their unexpected behaviour. Their fractographs are shown in Figures 9 and 10.
Figure 9 shows the fractographs of specimen Z-29, which was cycled at a maximum stress of 549 MPa and fractured after 822,565 cycles.
Specimen Z-29 fractured after a relatively high number of cycles at high stress load because the crack initiation was from a very small stress concentration resulting from a 11 ßm wide and 57 ßm deep sub-surface pore, encircled in Figure 9(b). Fatigue striations were located on the face of a tear ridge and bow-out from the direction of the crack initiation pore, indicated by an arrow in Figure 9(c). This crack initiation pore had the smallest length of all the crack initiation pores for this series of specimens. No other internal pores were located on its fracture surface. Due to the absence of internal pores that would have accelerated the crack tip to the crack's critical length (overload/unstable crack propagation area), specimen Z-29 showed a fairly large area of an unstable crack propagation zone. However, the crack propagation area was similar to that of specimen X-4, which is divided into an area of stable crack propagation and an unstable crack propagation area, depicted in Figure 5.
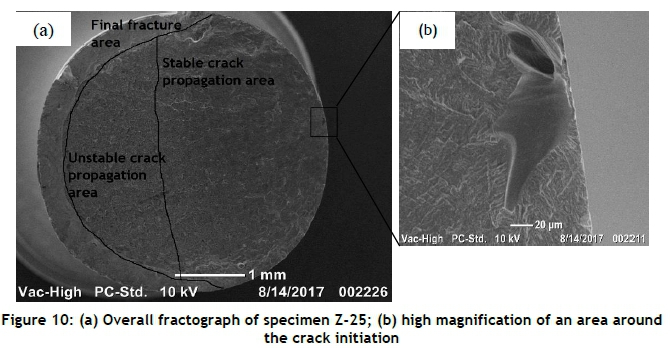
Figure 10 shows the micrographs of specimen Z-25, which was cycled at a maximum stress of 423 MPa and fractured after 97,743 cycles
Fatigue crack fracture of specimen Z-25 initiated from a 120^m wide and 68 ßm deep pore, which was the longest length of pore to initiate a crack in Z-build direction specimens. A couple of smaller micro-pores were located on both the slow and the fast crack propagation areas. Contact of the crack tip with a pore locally accelerates the crack propagation rate towards the overload monotonic fracture zone. The stable crack propagation area covered the major part of the fatigue crack propagation area. Thus the relatively large crack initiation pore, together with the internal pores, resulted in specimen Z-25 fracturing after only a small number of cycles at a low stress.
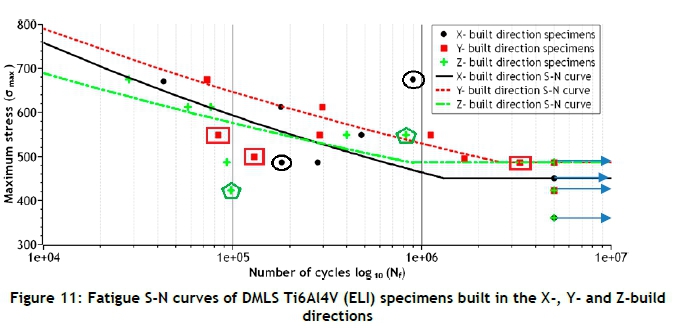
In Figure 11 the different S-N curves for the as-built X-, Y-, and Z-build direction Ti6Al4V (ELI) specimens are presented.
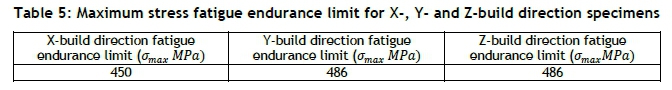
Table 5 presents the estimated fatigue endurance limits for the as-built X-, Y- and Z-build direction DMLS Ti6Al4V (ELI) specimens, derived from the curves in Figure 11.
4 CONCLUSIONS
The following conclusion are derived from the foregoing work:
-
The endurance limits determined here for the as-built DMLS Ti6Al4V (ELI) are the same for the Y- and Z-build directions, and slightly higher than the values determined for the X-build direction. However, the difference is small and statistically insignificant, given the spread of the data points. Anisotropy that might result from the DMLS process does not reflect in the fatigue properties of parts.
-
Fracture surfaces of the fatigue specimens tested here displayed all four regions of fatigue failure - i.e., crack initiation, slow and fast crack propagation, and final fracture. Fatigue crack initiation resulted from stress concentration sites formed by micro-pores located at the surface or sub-surface of the specimens.
-
The specimens with sub-surface crack initiation pores (specimens Y-14 and Z-23) exhibited higher numbers of cycles to failure than those with surface pore crack initiation sites, despite having relatively larger crack initiation pores.
-
Inconsistencies in the behaviour of the tested specimens could be traced to the size of crack initiation and internal pores for all three build directions. Thus the HCF strength of polished as-built DMLS Ti6Al4V (ELI) specimens may be said to depend on the size, orientation, and distribution of the internal pores.
ACKNOWLEDGEMENTS
The authors would like to express their gratitude to the following for making this work possible:
• The financial support of the South African Department of Science and Technology through the Collaborative Programme in Additive Manufacturing is gratefully acknowledged (Contract Ns CSIR-NLC-CPAM-15-MOA-CUT-01).
• CSIR mechanical testing laboratory.
• JB Marks Education Trust Fund for financial support.
REFERENCES
[1] Moletsane, M.G., Krakhmalev, P., Kazantseva, N.A., Du Plessis, A., Yadroitsava, I. and Yadroitsev, I. 2016. Tensile properties and microstructure of direct metal laser sintered Ti6Al4V (ELI) Alloy. South African Journal of Industrial Engineering, 27(3) Special Edition, pp 110-121. [ Links ]
[2] ASTM Standard F1472, 2008. Specification for wrought Titanium-6Aluminium-4Vanadium alloy for surgical implant applications (UNS R56400). ASTM International, West Conshohocken, PA 19428. United States. [ Links ]
[3] ASTM Standard F2792-12a, 2012. Terminology for additive manufacturing technologies, ASTM International, West Conshohocken, PA 19428-2959. United States. [ Links ]
[4] Becker, T.H., Beck, M. and Scheffer, C. 2015. Microstructure and mechanical properties of direct metal laser sintered Ti6Al4V. South African Journal of Industrial Engineering,26(1), pp 1-10. [ Links ]
[5] Sidambe, A. 2014. Biocompatibility of advanced manufactured titanium implants - A review. Materials (Basel),7, pp. 8168-8188. [ Links ]
[6] Leyens, C. and Peters, M. 2003. Titanium and titanium alloys. Weinheim: Wiley-VCH Verlag. [ Links ]
[7] Ramosoeu, M.K.E. 2012. Characterisation and static behaviour of the DMLS Ti6Al4V for bio-medical applications. Dissertation for Magister Technology: Mechanical Engineering, submitted February 2012 at Central University of Technology, Free State. [ Links ]
[8] Evans, W.J. 1998. Optimising mechanical properties in alpha+beta titanium alloys. Material Science and Engineering, 243, pp. 89-96. [ Links ]
[9] Patterson, A.E., Messimer, S.I. and Farrington, P.A. 2017. Overhanging features and the SLM/DMLS residual stresses problem: Review and future research need, Technologies, 5, 15; doi:10.3390. [ Links ]
[10] Pityana, S.L., Tlotleng, M., Tshabalala, L.C., Makoana, N.W., Botes, A. and Hachemi Amara, E.I. 2016. Multiphasics simulation of thermal phenomena in direct laser powder deposition. Proceedings of the 17th international RAPDASA Conference, Vaal University of Technology. [ Links ]
[11] Van Zyl, I., Yadroitsava, I. and Yadroitsev, I. 2016. Residual stress in Ti6Al4V objects produced by direct metal laser sintering. South African Journal of Industrial Engineering, 27(3), pp. 134-141. [ Links ]
[12] Yadollahi, A., Shamsaei,N., Thompson, S.M., Elwany, A. and Bian, L. 2017. Effects of building orientation and heat treatment on fatigue behavior of selective laser melted 17-4 PH stainless steel. International Journal of Fatigue, 94, pp.218-235. [ Links ]
[13] ISO/DIS 1099. 2015. Metallic material fatigue testing axial force controlled method. Retrieved from https://www.iso.org/standard/36108.html. [ Links ]
[14] Liu, X., Sun, C. and Hong, Y. 2015. Effects of stress ratio on high-cycle and very-high-cycle fatigue behavior of a Ti6Al4V alloy. Material Science and Engineering, 622, pp. 228-235. [ Links ]
[15] Gong, H., Rafi, K., Gu, H., Ram, G.D.J., Starr, T. and Stucker, B. 2015. Influence of defects on mechanical properties of Ti6Al4V components produced by selective laser melting and electron beam melting. Materials and Design, 86, pp. 545-554. [ Links ]
[16] Chastand, V., Tezenas, A., Cadoret, Y., Quaegebeaur, P., Maia, W. and Charkaluk. E. 2016. Fatigue characterization of titanium Ti6Al4V samples produced by additive manufacturing. Precedia Structural Intergrity, 2, pp. 3168-3176. [ Links ]
[17] Joshi, V.A. 2006. Titanium alloys: An atlas of structures and fracture features. Baca Raton: Tylor and Francis Group. [ Links ]
[18] Milella, P.P. 2013. Fatigue and corrosion in metals. Italia: Springer-Verlag. [ Links ]
[19] Dieter, G.E. 2013. Metallurgical and metallurgical engineering, 3rd edition. New York: McGraw Book Company. [ Links ]
* Corresponding author lmalefane@cut.ac.za
# The author was enrolled for an M Eng (Mechanical Engineering) degree in the Department of Mechanical and Mechatronics Engineering, Central University of Technology Free State Bloemfontein, South Africa

