


Servicios Personalizados
Articulo
 Inglés (pdf)
 Articulo en XML
 Referencias del artículo
Indicadores

Links relacionados
-
 Citado por Google
 -
 Similares en Google
Compartir

 Permalink
South African Journal of Industrial Engineering
versión On-line ISSN 2224-7890
versión impresa ISSN 1012-277X
S. Afr. J. Ind. Eng. vol.28 no.3 Pretoria 2017
http://dx.doi.org/10.7166/28-3-1850
GENERAL ARTICLES
A practical approach to managing uncertainty in the measurement and verification of energy efficiency savings
W. Hamer*, #; W. Booysen#; E.H. Mathews
North-West University, CRCED-Pretoria, Pretoria, South Africa
ABSTRACT
Measurement and verification (M&V) is fundamental in determining the impact of energy efficiency (EE) interventions. However, accurately quantifying the EE savings on complex industrial systems can present several technical challenges. It is of critical importance that these challenges be practically addressed within regulatory requirements when applying for tax-based EE incentives. In this study, the key uncertainties affecting the M&V of Section 12L EE tax incentive applications are identified. A novel approach provides practical guidelines to manage and mitigate uncertainty. This approach ensures that reported savings are a fair and compliant reflection of the actual savings achieved. The presented case studies show that uncertainty can affect up to 30 per cent of reported savings. This emphasises the significant impact of uncertainty, and quantifies the benefit of compliant uncertainty management. Ultimately, this study provides valuable insight into the practical implementation of tax-based directives intended to stimulate sustainable development.
OPSOMMING
Meet en verifieer (M&V) is fundamenteel om impak van energie-doeltreffendheid intervensies te bepaal. Die akkurate kwantifisering van die energie besparings op komplekse industriële stelsels kan egter verskeie tegniese uitdagings bied. Dit is van kritieke belang dat hierdie uitdagings prakties aangespreek word binne regulatoriese vereistes van belasting gebaseerde aansporingsprogramme. In hierdie studie word die kern onsekerhede geïdentifiseer wat die Seksie 12L belasting aansporingprogram beïnvloed. 'n Nuwe benadering wat gebaseer is op praktiese riglyne word voorgestel om hierdie onsekerhede te bestuur. Die benadering verseker dat gerapporteerde besparings 'n regverdige weerspieëling weergee van die werklike besparings wat behaal word. Die implementering van die benadering op vier gevallestudies toon dat onsekerheid tot 30 persent van gerapporteerde besparings kan beïnvloed. Dit beklemtoon die beduidende impak van onsekerheid en motiveer dus die belangrike rol van onsekerheidsbestuur. Hierdie studie bied waardevolle insig tot die praktiese implementering van belasting gebaseerde programme wat daarop gemik is om volhoubare ontwikkeling te stimuleer.
1 BACKGROUND AND RELEVANCE
1.1 The 12L tax incentive
The South African government has committed itself to a 32 per cent reduction in greenhouse gas (GHG) emissions by 2020 and to a 42 per cent reduction by 2025 [1]. This is part of a global effort to address the threat of anthropic climate change in the context of sustainable development [2].
The focus of climate change mitigation is on implementing laws, policies, and regulations that promote sustainable development. A significant part of the South African government's strategy is to use tax-based directives to stimulate less carbon-intensive economic development while ensuring a continued supply of energy [1], [3], [4].
A planned carbon tax will add a premium to fossil fuel intensive activities in order to encourage more sustainable alternatives [1]. South Africa's large industry has the highest direct exposure to the carbon tax, with present estimates amounting to R 13 billion per annum [5]. It is evident from the draft Carbon Tax Bill that mechanisms are available for energy users to reduce exposure to the carbon tax and promote sustainable development [4]. One of these mechanisms is the 12L energy efficiency (EE) incentive.
'12L' refers to Section 12L of the Income Tax Act (Act No. 58 of 1962). The incentive takes the form of a deduction of R0.95/kWh (or R0.45/kWh prior to March 2015) from taxable income per verified unit of savings achieved [6]. The 12L regulations officially came into effect on 1 November 2013, and are operational until 2020 [3]. From the regulations, it is evident that the spirit of 12L is to promote the efficient use of energy to support the supply of energy and reduce GHG emission intensity [3]. According to the National Energy Efficiency Strategy, continuous improvement to the 12L tax incentive will lead to 42 PJ estimated energy savings [7]. This presents a total tax allowance value of R 11 billion.
A claimant with the intent to use 12L financing should register with the South African National Energy Development Institution (SANEDI), and appoint a South African National Accreditation Services (SANAS) accredited measurement and verification (M&V) body to quantify achieved EE savings [3]. Reported savings should also be quantified in compliance with SANS 50010, the South African National Standard (SANS) for measurement and verification of energy savings. SANEDI has the final responsibility for issuing a tax certificate if the reported savings are compliant and a fair reflection of the savings achieved [3].
Although several concerns associated with the incentive have been noted [8]-[10], the key challenge is to calculate and verify avoided energy usage efficiently and accurately while adhering to the regulatory requirements. The M&V process has to be accurate, consistent, conservative, and auditable in order to protect the stakeholders involved [11]. Stringent administrative and compliance requirements of the 12L tax incentive add to the complexity of this challenge [10], [12]. Good M&V practice will therefore play a key role in the practical application of the 12L tax incentive.
1.2 Role of M&V in 12L tax incentive applications
Energy saving measures (ESMs) include a wide range of activities dedicated to improving EE and decreasing GHG emissions. However, several challenges arise when administrating the actual benefits of such activities [13]. This has a significant impact on stakeholders, as it may be difficult to determine whether EE investments are delivering the expected returns. M&V therefore becomes necessary to calculate the economic, environmental, and social impact of EE investments independently [14].
Since 2005, several energy-related incentives have been initiated by the South African government and the national electricity supplier, Eskom. Eskom's Demand Side Management (DSM) programme was the key initiative to incentivise electricity curtailment during national supply shortages. The M&V process became essential to ensuring independent, accurate, and auditable results from these incentives [15]. The South African M&V industry has since grown, with additional incentives and funding models being developed, of which the 12L tax incentive has been the most recent and most anticipated [9], [13].
Changes in funding models shifted the focus of M&V reporting indicators. Conventionally, M&V reports were required to indicate whether a DSM project achieved the necessary savings target, thus focusing on the qualitative aspect of the results. The reward was not primarily based on the amount of energy savings achieved, but rather on whether it was achieved or not [16], [17]. In lieu of this, the 12L incentive rewards an exact monetary benefit per unit of energy saved during a year of assessment [6]. This indicates a shift towards the quantitative aspect of the M&V results. The uncertainty of reported results thus becomes more prevalent in stringent quantitative reporting. Uncertainty is inevitable in M&V practice, since no measurement or model is 100 per cent accurate [11]. It is therefore important to have a concise way of managing sources of uncertainty.
Thus the national M&V standard (SANS 50010) provides the standardised basis for uncertainty management [18]. Originally, the M&V standard, published in 2011 (SANS50010: 2011), did not necessitate the quantification of uncertainty, but stated that uncertainty needs to be managed to ensure that reported savings are likely to be conservative. The revised standard published in 2017 is more rigorous, since it requires the quantification of uncertainty and a "clear statement" on how uncertainty is mitigated [19]. The concept of uncertainty mitigation by conservative energy saving reporting is illustrated in Figure 1.
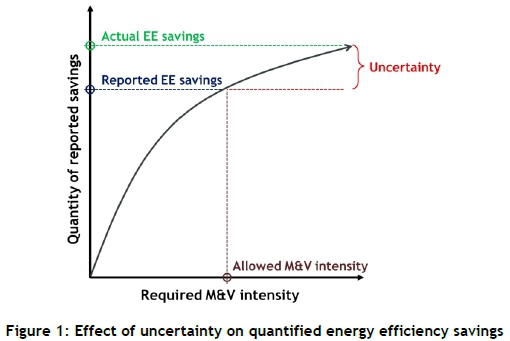
Conservativeness represents the lower limit of the 'allowed' uncertainty range. Uncertainty is mitigated by decreasing the quantity of reported savings and thereby increasing conservativeness. Alternatively, uncertainty can be reduced by acquiring more or better operational data by increasing M&V intensity. This will vary for specific scenarios, depending on the available time, resources, and complexity of specific ESMs [11].
Practical case studies have shown that M&V calculations typically vary by 10 per cent [13]. The management of uncertainty and conservativeness will therefore have a significant impact on the quantification of 12L compliant EE savings. This is a new challenge in the field of M&V [20].
1.3 Objective of the study
In this section the basic background and relevance to the topic of uncertainty management in energy efficiency reporting is discussed. The remainder of this article's objective is to convey a practical approach to identifying and evaluating the aspects that influence the uncertainty in energy savings reports. This is done by first reviewing the basic sources of uncertainty, and then presenting uncertainty management observations from the literature (Section 2). Based on the review, a new uncertainty management approach is proposed that entails four key steps: (1) eligibility, (2) data quality, (3) baseline model development, and (4) compliance evaluations (Section 3). The insights gained from the implementation of the proposed approach are then discussed for four industrial case studies (Section 4) before the conclusion is discussed (Section 5).
2 REVIEW OF UNCERTAINTY MANAGEMENT IN MEASUREMENT AND VERIFICATION
2.1 Basic sources of uncertainty
This section describes three broadly defined areas from which uncertainty can arise: data, calculation, and compliance.
2.1.1 Data uncertainty: Measurement and sampling
Energy savings computations are fundamentally reliant on data; however, data collected from measurements are never 100 per cent error-free [16]. Errors arise from the inaccuracy of sensors, variable sampling rate, poor data integration, sensor drift, imprecise measurements, and data capturing and handling errors. Each field of measurement and type of metrology has a set of standard requirements. This means that the management of measurement error is mostly based on the manufacturer's specifications, adherence to standard practice, and the management of periodic maintenance and calibration [11].
The SANS 50010 standard allows two main sources of measured data: invoices for measured quantities, and measurement equipment with appropriate calibration records [18]. 'Measurement uncertainty' refers to the range within which the true measured value occurs. The use of accredited calibration laboratories therefore provides assurance that certain minimum requirements are met, which minimises measurement uncertainty. When complete data sets are not used, the effect of sampling representativeness on data uncertainty must also be included [11].
An M&V plan is compelled to determine which data sources will be used to measure a specific energy system [17]. This plan will indicate the extent to which measurements are required for the available measurement boundaries. Measurement boundaries may include a whole facility (e.g. an entire plant) or part of a facility (e.g. a section of a plant). It is therefore necessary to evaluate multiple data sources that are found to be applicable to a specific M&V exercise. Measurement accuracy and sampling is mostly emphasised in the M&V literature; however, data handling from measurement to point-of-use can also significantly affect overall data uncertainty.
2.1.2 Calculation uncertainty: Modelling and estimation
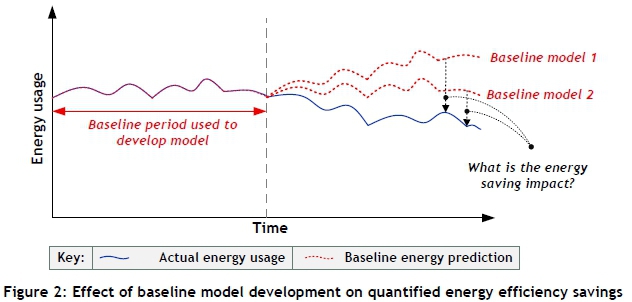
Energy savings represent the absence of energy usage that therefore cannot be directly measured [18]. So a baseline model is used to predict what the energy consumption would have been if no energy savings had been achieved. Comparing the measured energy consumption with the baseline model's estimate allows the EE savings to be mathematically quantified. The quality of a baseline model will have a significant impact on the quantified EE results. Developing an accurate and representative baseline model is therefore a critical aspect in determining the quantity of 12L energy savings.
A baseline model is developed by gathering data from the baseline period - that is, the reference point against which the reporting period's energy usage is compared. The baseline model predicts the reporting period energy usage based on baseline period characteristics. This is illustrated in Figure 2, which shows a simplified energy consumption profile, illustrating the concept of using baseline models to predict the 'would have been' energy usage without the implementation of ESMs [13]. In this example, two different baseline models are depicted, each showing a different energy savings impact. The key challenge, therefore, is to determine which baseline provides an appropriate reflection of baseline conditions in order to determine the achieved energy savings impact.
Independent variables known as 'energy governing factors' are used to model baseline energy usage; but these variables cannot account for 100 per cent of the variation in energy usage. A model can therefore not account for random and minor changes in day-to-day operations. This leads to imprecise modelling, which is usually the most significant source of uncertainty in the computation of energy savings [21]. The level of uncertainty created by a baseline model is also dependent on several other factors [13], [22-24]:
-
Functional form of modelled relationship;
-
Inclusion of irrelevant variables or omission of relevant variables;
-
Use of outliers or unrepresentative baseline data;
-
Limitations on the number of data points, dataset quality, and measurements; and
-
Interactive effects not accounted for by a model's measurement boundary.
Uncertainty created by model accuracy can cause significant doubt in the calculated energy savings. The convention, therefore, is to stipulate the specific range and confidence level of modelled results. 'Confidence' refers to the probability that the true value will fall within the calculated precision range - e.g., the true value falls within ±20 per cent of the modelled result at 80 per cent confidence. Presently, statistical requirements for baseline models are not standardised (although an M&V benchmark is expected to be published during 2017). It is necessary, therefore, to evaluate the statistical relevance or uncertainty applicable to a specific M&V exercise.
2.1.3 Compliance uncertainty: Conservative reporting
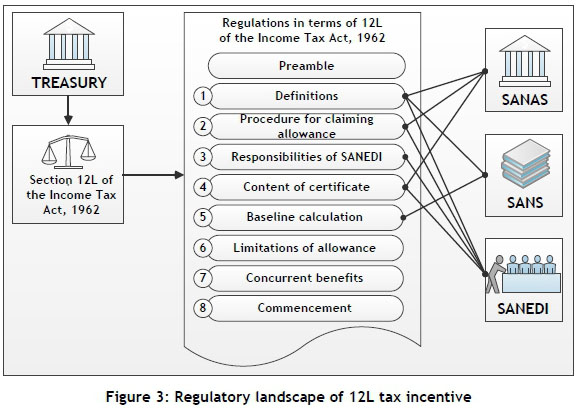
The 12L application process is primarily governed by the regulations published by the National Treasury during 2013 [3] and 2015 [25]. The 12L regulations were drafted to accommodate all types of energy users within the limitations of the allowance. The implementation of the regulations relies on three bodies of government: a SANAS-accredited M&V body for assurance, the SANS 50010 standard for technical support, and SANEDI for jurisdiction [3]. These three bodies each have a set of compliance requirements in addition to the regulations. The compliance landscape is illustrated in Figure 3.
The purpose of this paper is not critically to analyse the 12L regulatory landscape, but rather to focus on the fundamental aspect of 12L compliance, which is to ensure that a reported 12L saving is an accurate reflection of achieved EE. Failure to comply therefore indicates the probability that the reported savings are not an accurate reflection of the savings achieved. The main causes of non-compliance can be attributed to uncertainties inherent in the M&V quantification process (already discussed above under 'data' and 'calculation' uncertainties) as well as a lack of supporting documents or proof. Failure to manage these uncertainties will increase the risk of a non-compliant application.
If uncertainty is not managed effectively, the risk of an invalid claim is greater. 'Invalid' in this context refers to a more rigorous M&V exercise that indicates that the reported savings were overstated or misrepresented. A less rigorous M&V exercise will have higher levels of uncertainty. This makes conservative reporting necessary in order to manage the risk of uncertainty [18]. Establishing the extent to which conservativeness is applicable is therefore a key challenge.
The next section focuses on reviewing the present practice of managing uncertainty.
2.2 Review of present practice
SANS 50010 is at the pinnacle of South African M&V practice, since it is the most important resource to prove regulatory compliance [3]. The standard was developed to prescribe the minimum requirements of good M&V practice. It is generically applicable to all types of residential, commercial, and industrial M&V activities. More detailed guidance for specific scenarios is therefore provided by published protocols, guidelines, case studies, and the academic literature. M&V practice can therefore be divided into four hierarchical levels, shown in Figure 4.
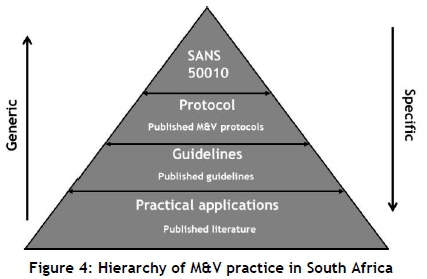
Standards, protocols, and guidelines provide generic uncertainty management strategies. More specific guidance is provided by publications that are based on practical applications. This paper therefore presents the results from a survey of specific M&V publications to evaluate how uncertainty is conducted in practice.
A wide range of M&V-related publications (79 citations) were surveyed to determine how existing M&V practices can provide the required methodologies [26]. The survey showed that uncertainty can be managed by precision and confidence statistics, comparing reported savings with a quantifiable error, and adjusting for identifiable interactive effects. However, the analysis showed that this was only done in isolated case studies. This topic was further evaluated by critically analysing the cited publications about uncertainty management practice and the obligation to report conservatively. The following questions were used for the survey:
-
Which M&V standard, protocol, or guideline was cited in the publication?
-
Was an effort made to manage uncertainty?
-
Was the conservativeness of the reported results stated or evaluated?
Results from the survey are presented in Figure 5. The majority of the considered publications (85 per cent) referred to at least one M&V resource. SANS 50010:2011 and the International Performance Measurement and Verification Protocol (IPMVP) were cited by 76 per cent of the publications. Although uncertainty management is prescribed in both these resources, most of the publications did not provide details about how uncertainty management was conducted or how conservative the reported savings were.
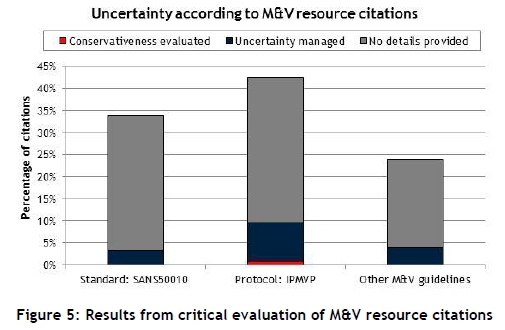
The survey found no publications that clearly stated the conservativeness of the reported savings, even though it is a SANS 50010 requirement. A few of the case studies made isolated statements about conservativeness by adjusting estimations to be biased towards lower savings. This, however, is not practical, since it is difficult to track the extent to which the final reported savings are biased.
The survey shows that conservativeness can be an intangible concept that may lead to inconsistency in M&V practice. It is therefore necessary to develop a method to show clearly how conservativeness should be evaluated. Although no published case studies were identified that referred to a practical interpretation of conservativeness, it is known that conservativeness should be governed by the level of confidence in the reported savings. This will have a significant impact on the feasibility of 12L.
Therefore, an approach to identify, manage, and quantify uncertainty during the quantification of 12L EE savings is discussed in the next section.
3 A PRACTICAL APPROACH TO MANAGING UNCERTAINTY
3.1 Preamble to approach
At present, a practical guideline that combines the 12L regulatory structure with the conventional M&V processes is not available. It is essential to translate the intent of the 12L regulations into a practically implementable solution. This study has therefore provided a breakdown of the 12L M&V process into four key steps:
1. Eligibility: The first step is to screen industry-wide ESMs and identify potential 12L opportunities that fall within the allowed regulatory framework.
2. Data quality: Data quality is fundamental in a 12L application, given an eligible opportunity. Without a comprehensive or credible dataset, all subsequent efforts can be negated.
3. Baseline model development: A baseline model is a key feature of the determination of EE savings. The accuracy of the selected model has a profound impact on reported EE savings.
4. Compliance: All M&V activities need to be conducted in compliance with the regulatory requirements. The ability to prove compliance is therefore a key element.
The objective of this study is to develop an approach to identifying and sufficiently analysing sources of certainty, while interrogating and accounting for sources of uncertainty. This paper provides only an overview of the basic requirements of each of the four key steps (Sections 3.2 to 3.5). The approach is then consolidated and reviewed in Section 3.6.
3.2 Eligibility
Rising costs related to energy usage promote substantial effort and investment by large industries to increase energy efficiency. As a result, numerous energy efficiency initiatives are implemented on several energy systems via various energy management programmes and projects. Due to the multiplicity of these initiatives, it is often difficult to determine which are eligible or likely to be a feasible 12L application.
The main areas of uncertainty arise from the management of regulatory exclusions (i.e., concurrent savings or limitations of the 12L allowance) and multiple energy saving measures in complex systems that are typically found in large industries. The challenge is to identify the ESMs that have a high probability of a successful 12L claim. However, the complexity of the systems, coupled with uncertainties about the management of 12L compliance, makes this a time- and resource-intensive exercise. So there is a need to screen the eligibility of potential 12L applications before excessive time and resources are spent compiling an actual application.
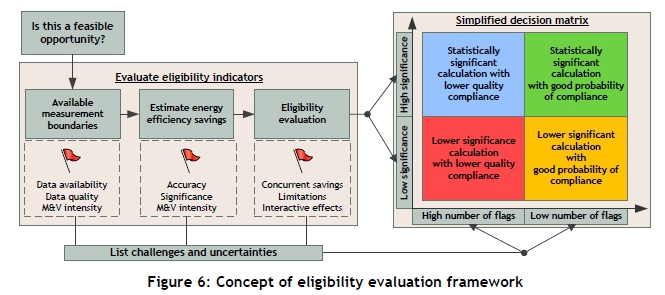
The framework shown in Figure 6 presents three basic stages of identifying potential eligibility. A measurement boundary is selected, the energy performance of the boundary is estimated, and then the eligibility of the energy performance is evaluated. At each stage certain flags can be noted. Each flag represents an uncertainty or potential challenge that must be resolved in order to quantify a claimable saving. Flags typically relate to data availability, data quality, the accuracy of estimations, the significance of savings, regulatory exclusions, or unquantifiable interactive effects. Time and resources are saved, since the uncertainties and challenges are only flagged at this stage, and not yet resolved.
The end goal of the eligibility framework is to allow an informed decision about whether an eligible 12L application can be processed. The decision is primarily based on the evaluation of two aspects: the quantity of potential savings compared with the probability of a compliant M&V exercise. This decision is simplified by grouping potential applications into one of four classes. This is depicted by the decision matrix in Figure 6.
An opportunity with significant energy savings and good compliance support (i.e., a low number of flags) will have a high probability of success. Conversely, a significant number of flags due to low data quality, problems with the estimation of energy savings, or non-compliant occurrences will significantly reduce the probability of success. Therefore, if the flagged items can be overcome by good M&V practice, then an eligible 12L opportunity can still be feasible. It is important, however, to decide whether the quantity of savings is large enough to invest additional time and resources in the M&V exercise. Once eligibility or the probability of success has been established, then additional time and resources can be allocated to compile a compliant application.
The eligibility framework proposed in this study was designed to be simple; therefore a professional M&V practitioner is not required to identify an eligible 12L opportunity. However, once the decision has been made to apply for the 12L tax incentive, an application needs to be registered with SANEDI, and an accredited M&V body needs to be appointed to quantify the energy savings compliantly [3].
The next section focuses on the next key step - data quality - once eligibility has been confirmed.
3.3 Data quality
The M&V process is reliant on data that allow an accurate analysis of an energy system. However, data quality can be a complex challenge in industrial energy systems [27]. This is mainly due to the large number of measurement points and data sources that are available. It is therefore critical to evaluate the quality of the available dataset options.
The term 'data quality' can be used to address various aspects of data use [16]. Data quality within the context of M&V and 12L applications is therefore defined as the ability to prove that a dataset provides an accurate, traceable, and relevant reflection of an energy system. Four distinct aspects can be isolated from this definition:
-
Accurate: Can measurement uncertainty be evaluated?
-
Traceable: Can the dataset's integrity be tested from measurement point to data source?
-
Relevant: Are all relevant energy and process flows accounted for?
-
Proof: Are supporting documents available?
The first aspect of data quality entails data accuracy, which is primarily affected by measurement uncertainty. The common approach to addressing this uncertainty is to link the relevant measurement equipment to an invoice, calibration record, or manufacturer's accuracy specification. The methods used to evaluate measurement uncertainty are well-established in M&V guidelines and practice [11]. However, this is limited to a single aspect of data quality. Therefore, the point of departure of this paper is to address the other decisive factors that can influence data quality: data integrity and relevance.
The ideal solution to determining data quality would be to conduct a mass and energy balance across the energy system to allow full accountability of all energy streams. This is not practical, however, due to the lack of measurements and the challenge in balancing dynamic state energy systems. Instead, this study proposes a simplified method to investigate energy usage trends, based on comparing multiple data sets and sources to test the integrity and relevance of data.
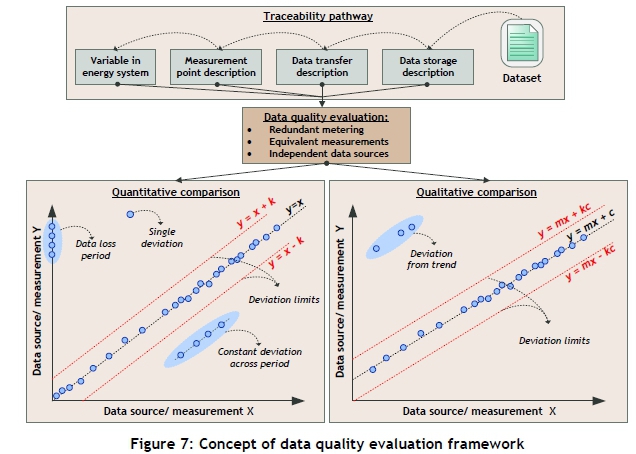
The initial task is to determine the traceability pathway of a dataset. A dataset is traceable if it can be tracked to a distinct data source that, in turn, can be traced to one or more measurement points and instruments. By using this traceability pathway, it is possible to determine whether data integrity has been compromised by any form of adjustment in the data transfer process.
Testing data integrity and relevance can be a complex challenge due to the various activities across the data handling pathway. Therefore, a simplified data comparison method is proposed to identify data discrepancies. Data comparisons can be done by redundant metering, equivalent measurements, or independent data sources across the data traceability pathway. Any deviations shown by data comparisons will indicate a data discrepancy. These deviations need to be queried in order to determine whether the dataset used fairly represents the measurements of the variable in the energy system.
Deviations can be identified by various methods. Analytical methods are commonly used to investigate the error between datasets. However, visual methods are useful to simplify the identification of deviations [13]. Since equivalent datasets should match each other, it can be useful to plot a dataset comparison (e.g. y vs x). Deviations can then be identified both computationally and visually by establishing the relationship between datasets. This concept is illustrated in Figure 7 for both quantitative and qualitative comparisons.
Not all measurements or data sources provide a quantitative representation. For example, monitoring the status of a pump will only indicate whether it is on or off, but it can be used as an indicator of energy usage. In practice, numerous such qualitative indicators can be collected and used to evaluate energy systems. Therefore, the data integrity test can be quantitative (y=x) or qualitative (y=mx+c) since the main concern is to identify deviations. As illustrated in Figure 7, several deviations can be noted by means of residuals. These deviations are only considered abnormal if they are beyond set limits indicated by a constant (k).
Abnormalities can be linked to data loss, meter malfunctions, irregular operations, or other explanations. If abnormalities cannot be linked to relevant explanations, then uncertainty is created about whether the dataset truly represents the energy system. This establishes whether causality exists between data-based observations and actual operational interventions, such as an energy-saving measure or other operational activities.
If the observations made from a dataset cannot be reconciled with actual operational events, this will lower confidence in the relevancy of the dataset. Conversely, a correspondence between data-based observations and listed operational events will validate the data as representative of actual operations. Datasets will therefore either be validated or discarded, based on the integrity and relevance test. Discarded datasets are excluded from all subsequent calculations to ensure that the process is not compromised by propagating erroneous data. Only validated datasets can then be used for baseline development. The baseline model development process is discussed in the next section.
3.4 Baseline model development
A baseline model's capability to predict baseline energy usage accurately is a fundamental aspect in quantifying EE savings. Multiple statistical indicators and techniques can be used, as applicable, to specific baseline models (e.g., coefficient of determination, standard error, t-statistic, p-value, f-statistic, relative precision). Since there are no standardised statistical requirements, these can be applied in different levels of rigour depending on the requirements of a specific M&V exercise. An over-reliance on statistical evaluation is also not necessarily adequate, since statistical evaluations can not only be too complex for all M&V stakeholders to understand [28], but also be misleading when misinterpreted [24]. Certain factors cannot be accounted for by statistical indicators, such as the omission of relevant energy streams [23]. Holistic and intuitive analysis can therefore also aid the baseline evaluation and selection process.
Although the SANS 50010 standard allows for a variety of baseline modelling techniques when quantifying EE savings, it does not require that more than one technique be applied. The convention, therefore, is to develop a single model that meets all technical and compliance requirements. However, it is not always possible to compile a single model that can accurately account for all energy-related activities. This can create uncertainty in the quantified savings if it is not clear whether the particular model is superior to other possible options. It is therefore proposed to adopt an approach in which multiple baseline models are developed to allow a holistic evaluation of energy performance.
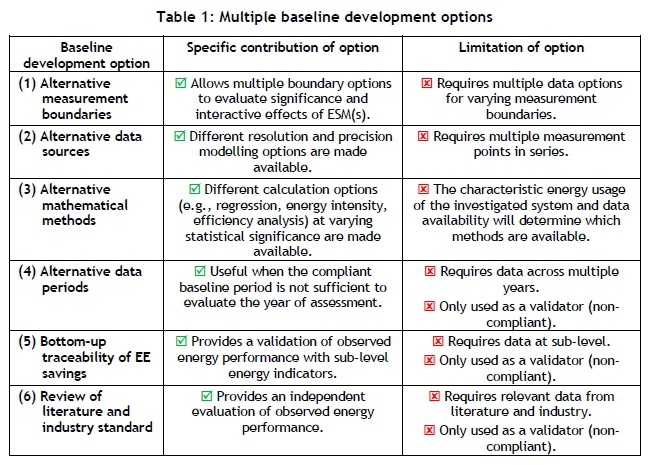
The study proposes six different categories of baseline development options to quantify and evaluate EE savings. These categories are based on the use of alternative measurement boundaries, data sources, mathematical methods, or data periods. Alternative checks are also proposed to substantiate whether quantified EE savings are traceable to actual interventions (i.e., a bottom-up approach) or if they are in line with expectations from the published literature or industry benchmarks. Each method is developed to address specific areas of uncertainty that can arise from baseline modelling. It should be noted that each option has limitations. These are summarised in Table 1.
The availability of different modelling options will depend on factors and characteristics that are specific to the underlying energy system. Not all options are considered compliant, as they may rely on methods that are less accurate or are not compliant with SANS 50010 or the 12L regulations. The purpose of the multi-model approach, therefore, is only to facilitate a holistic energy performance review. It can also decrease the risk of selecting a less suitable or unrepresentative model by increasing traceability and transparency in the baseline development and selection process. Baseline model options can be compared and used to select the most suitable options to calculate the quantity of energy savings for a specific 12L application.
Up to this stage of the developed practical approach, the steps of identifying an eligible 12L opportunity (Section 3.2), evaluating data quality (Section 3.3), and developing baseline options (Section 3.4) have been discussed. The final step of consolidating the three aforementioned steps into a compliant 12L application is discussed in the next section.
3.5 Compliance in uncertainty management
Compliance with a funding mechanism's regulatory structure is critical when quantifying the EE savings. The 12L tax incentive's regulatory structure is based on the Income Tax Act (1962), the 12L regulations, and SANS 50010. This structure is important in upholding the intent of the incentive. Although multiple compliance requirements must be evaluated, this paper focuses on the fundamental aspect of 12L compliance which is to ensure that a reported 12L saving is an accurate and fair reflection of achieved EE.
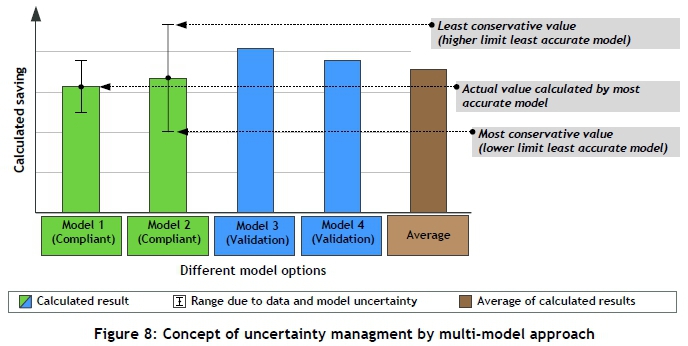
Various compliance requirements have been taken into account during the preceding steps by identifying potentially eligible 12L applications (Section 3.2), evaluating data quality (Section 3.3), and developing a baseline (Section 3.4). In the final step of the developed approach, various uncertainties have to be consolidated in order to ensure that reported savings are compliant. Uncertainty is determined by evaluating the available datasets, models, and validations. This allows the transparent and objective selection of the most appropriate 12L model in order to manage uncertainty effectively. The approach is depicted by multiple model results in Figure 8.
In Figure 8, four modelled results are provided as an example. These models can be compiled by various dataset (Section 3.3) and baseline development (Section 3.4) options. Models 1 and 2 are compliant models, and have known levels of uncertainty. Models 3 and 4 are solely for validation, since they are indicative of energy performance, but are not fully compliant with the 12L regulatory requirements. It is noted that the uncertainty range of certain models cannot be quantified in the absence of relevant statistical indicators. In this example, Models 3 and 4 did not allow quantification of uncertainty.
The final bar in Figure 8 shows the average savings observed by combining the four results. The most conservative option is the lower-level result from Model 2. However, Model 2 is clearly less accurate than Model 1, due a larger uncertainty range. The multi-model approach therefore provides multiple options for the M&V stakeholders to investigate. By comparing the benefits and disadvantages of the different models, the most appropriate option can be selected for a specific 12L application.
Based on this evaluation, a model can be selected to calculate the reportable EE savings. If reported savings are deemed conservative and compliant, then a viable 12L application can be conducted. Viable applications are submitted to SANEDI for final review. The aim of this approach is to allow a traceable decision pathway for the management of various uncertainties that can arise during quantification of 12L compliant energy savings. Stakeholders will therefore be aware of the uncertainties and how to manage them.
The use of multiple models and calculations to validate that reported savings are an accurate reflection of the actual savings achieved is a key contribution of this approach. This is a simple technique to evaluate the conservativeness of reported results. The technique also makes the baseline selection and uncertainty management processes more transparent. Ultimately, the concise management of uncertainty can increase confidence that reported savings are a true reflection of savings achieved. Conversely, it can be used to identify possible invalidations to avoid overstated savings.
The multi-model approach will allow for the selection of the most appropriate 12L baseline model with a known level of uncertainty. This allows the necessary adjustments to be made in order to report conservatively, as required by the regulations. By using the approach recommended by this study, the decision-making pathway can be shown to all stakeholders, who will then know the quantity of energy savings that can be reported and how conservative the final claim will be.
3.6 Review of approach
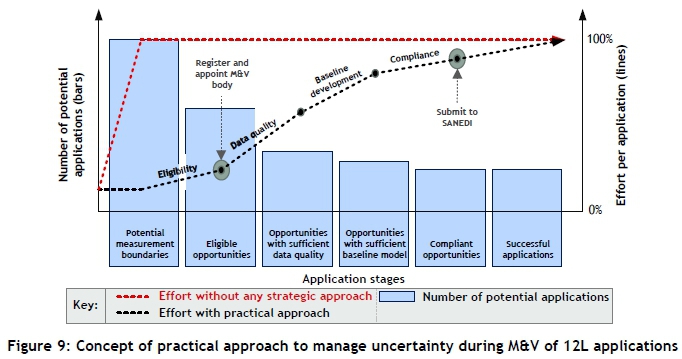
The practical approach addresses the specific uncertainties and requirements that hamper the quantification of EE savings during the 12L application process. In order to simplify the approach, it was broken down into four key steps. These steps are sequential; in other words, an application cannot proceed if the outcomes of the previous step have not been satisfied. This prohibits unnecessary wastage of time and resources on an application that has fundamental flaws. This concept is illustrated in Figure 9.
The approach evaluates all possible measurement boundaries in an energy system to identify those with significant potential. The eligible opportunities are then further evaluated in terms of data quality and baseline development. The latter two steps are critical in the M&V process, and therefore require the most time and resources. Applications with sufficient data quality and developed baselines are considered for the compliance step. Multiple aspects of compliance can then be evaluated and consolidated before an application can be conducted successfully. A compliant application is submitted to SANEDI by the appointed M&V body for the final evaluation before a tax certificate is issued.
The approach is designed to discard applications with a low probability of success at an early stage. Therefore significant uncertainties, concurrent benefits, or limitations would have been identified at an earlier stage. Figure 9 also illustrates that a certain amount of time and resources is required to conduct a 12L application. If this was approached without any strategic allocation, then the maximum amount of effort would have been spent on each potential application. Instead, the practical approach eliminates applications with a low probability of success. The maximum effort is then only applied to applications with a significant probability of success.
This supports the practicality of the 12L application process by limiting the amount of time and resources that is required to investigate potentially unsuccessful applications. This framework is essential for large industries practically to manage opportunities that might be eligible for the 12L tax incentive.
The next section will discuss how this approach was implemented in four industrial energy systems.
4 RESULTS AND FINDINGS
4.1 Overview of results presented
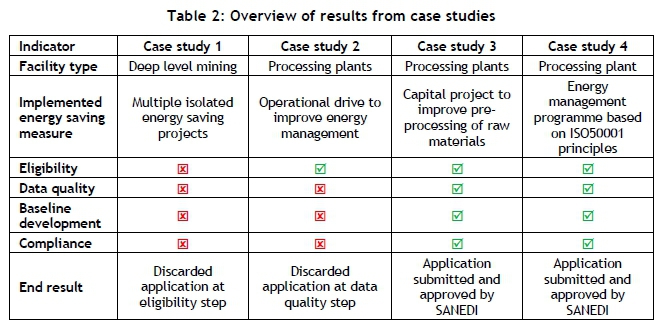
This section presents the basic results from more detailed energy audits that were conducted at several industrial facilities. The facility types, implemented ESMs, and audit results are summarised in Table 2. The highlights from each case study are discussed in the sections that follow. (Note that site-specific details and quantitative values are omitted due to the use of confidential information. Instead, qualitative analysis and normalised results are presented.)
4.2 Case study 1: Highlights
Mining is energy-intensive because deep-level underground mines require large cooling, ventilation, compressed air, water reticulation, and ore transportation systems. Case study 1 is based at a South African mine where several EE initiatives were implemented with varying degrees of intensity. The objective was to investigate whether the 12L tax incentive could be claimed for quantified EE savings. Although quantifiable energy savings were observed, the following flags were noted during the eligibility step of the investigation:
-
Official records of project dates and planning were not readily available
-
Data quality was hampered due to the use of unverified and uncalibrated meters
-
Baseline development was a challenge, since no significant energy governing factors were identified
-
Concurrent savings could be linked to the implementation of a DSM-funded project
Potential 12L opportunities were identified for the investigated mine. However, several flags were noted, of which the most significant were a lack of significant correlation with any energy governing factors, and the absence of verified data. This indicates a challenge in developing a compliant baseline model. If this challenge could have been resolved, then an eligible 12L application would have been possible. However, at the time this study was conducted, it was not considered feasible to invest time and resources in proceeding with the potential 12L opportunities.
4.3 Case study 2: Highlights
Industrial-scale processing facilities are energy-intensive due to their use of large transport, heat transfer, and material processing units. Case study 2 includes six production facilities in South Africa that use large amounts of coal and electricity. A company-wide drive towards more efficient energy usage was the reasoning behind the investigation into potentially claiming a benefit from the 12L tax incentive for quantified EE savings at any of the facilities.
During the eligibility review, several high-level datasets were gathered, from which statically significant regression baseline models could be developed. These models showed a significant improvement at one the facilities. No significant flags were noted for the subsequent M&V process, which indicated a potentially eligible opportunity for the 12L tax incentive. However, in the next step, data quality evaluation, several data discrepancies were noted when tracing the high-level datasets to plant-level data sources.
A more detailed data evaluation showed that these discrepancies caused an overestimation of the initial EE savings during the eligibility step. As a result, the observed savings decreased by more than 50 per cent, which invalidated the significance of quantified EE savings, and a potential 12L application was discarded as a result. Data quality evaluation was therefore critical in this case study.
4.4 Case study 3: Highlights
Case study 3 includes three complex processing plants with several production sections. Energy carriers in the form of electricity, coal, and pipeline gas are used to produce final products. In this case study, energy efficiency was prioritised by operational improvements and capital projects. Eligibility was investigated by evaluating 25 potential measurement boundaries within the three complexes. Two potential 12l applications were identified; however, only one was considered eligible due to the significance of the quantified savings.
Multiple datasets were compiled for the identified 12L application. Datasets were traced from a central data management system to actual measurements. Datasets were evaluated for accuracy, integrity, and relevance. No data discrepancies were found that invalidated the initial eligibility exercise. Multiple compliant datasets were therefore available for baseline development. Three baseline calculation methods were compiled to evaluate energy efficiency improvement. These were based on alternative dataset and measurement boundary options. The EE savings quantified by the selected methods are illustrated by Figure 10.
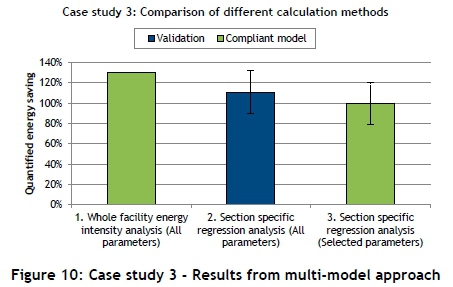
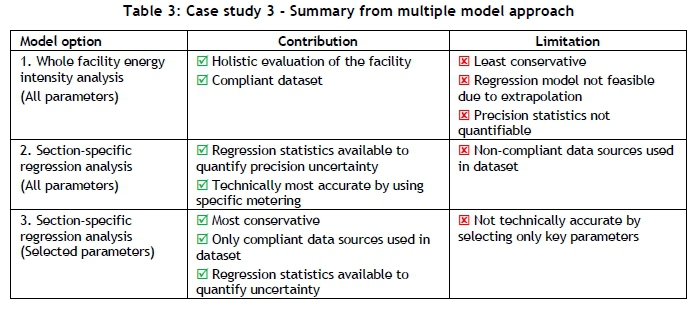
From the developed methodology, it was found impractical to develop a single baseline model to account comprehensively for all aspects of a complex energy system. This is evident in this case study, where no single model provides a clear benefit above the other models. Note that the uncertainty range is 21 per cent in terms of model precision, and the model results vary between 10 per cent and 30 per cent. By comparing the benefits (contributions) and disadvantages (limitations) of the different models, the most appropriate model can be selected. Table 3 summarises these aspects of the models compiled for this case study.
By presenting the benefits and disadvantages of the developed models to the M&V stakeholders, a decision can be made on which model is the most suitable for the specific 12L application. This provides a traceable and transparent platform for model selection. The method is also used to evaluate the conservativeness of the results, given the specific uncertainties.
The EE savings quantified for the 12L application were quantified using the developed approach. The EE savings were also independently quantified by an accredited M&V body and evaluated by a SANEDI review panel. A tax certificate was issued to the claimant for the quantified EE savings. This result confirmed that the approach can be used by large industry to apply successfully for the 12L tax incentive.
4.5 Case study 4: Highlights
Case study 4 is based on an integrated processing facility with multiple production sections. At this facility, an ISO 50001-based energy management programme was implemented that included multiple energy-saving measures being implemented simultaneously. Eligible improvements included large capital retrofits and expansions, as well as operational changes to increase the efficient use of energy carriers. The objective was therefore to investigate whether the 12L tax incentive could be claimed for quantified EE savings.
Multiple datasets were compiled and evaluated for the identified 12L application. Datasets were supplemented by supporting documents (data management procedures, calibration records, and invoices); no data discrepancies found to invalidate the initial eligibility assessment. Thus multiple datasets were available to develop five baseline calculation methods to quantify the EE performance of the facility. These were based on alternative dataset, measurement boundary, and calculation options. The EE savings quantified by the selected methods are illustrated by Figure 11.
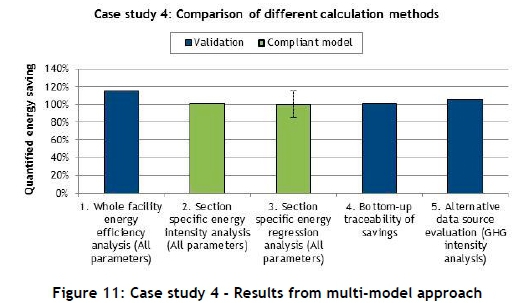
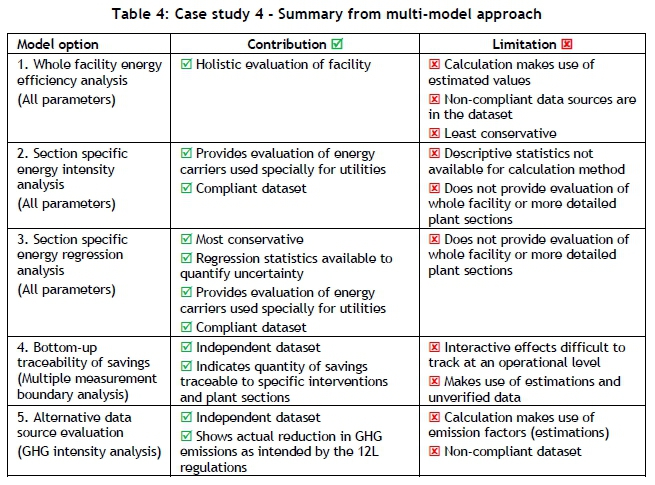
From Figure 11, it is evident that EE savings were achieved, as all the developed model options indicate positive quantities. The question remains, however: Which model should be used to quantify the reported EE savings? It is not clearly evident which model is the most suitable. Note that the uncertainty range is 15 per cent for model precision, and the model results vary between five per cent and 15 per cent. By comparing the contributions and limitations of the different models, the most appropriate model can be selected. Table 4 summarises these aspects of the models compiled for this case study.
As with Case study 3, the benefits and disadvantages of the developed models can be presented to the M&V stakeholders to allow a decision on which model is the most suitable for the specific 12L application. This provides a traceable and transparent platform for model selection. The method is also used to evaluate the conservativeness of the results, given the specific uncertainties.
The EE savings for the 12L application were quantified using the developed approach. The EE savings were also independently quantified by an accredited M&V body and evaluated by a SANEDI review panel. A tax certificate was issued to the claimant for the quantified EE savings. This result confirmed that the approach can be used by a large industry to apply successfully for the 12L tax incentive.
4.6 Summary of findings
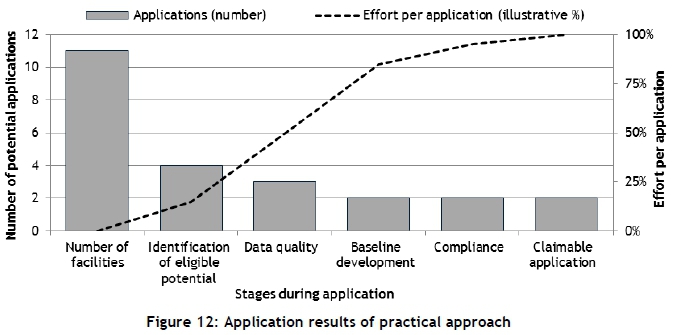
In this section, the developed approach has been applied to four types of industrial energy system. Each step (as described in Sections 3.2 to 3.5) reported on isolated methodologies to verify specific aspects during the 12L application process. Although these methodologies can be used as standalone M&V tools, they are combined to form the overall practical approach to quantifying 12L-compliant EE savings. Thus the case studies in this section report on the overall results when this approach was applied in practice. The results of these implementations are summarised in Figure 12.
The selected case studies included one mine and ten processing plants (in total, 11 facilities), as shown in Figure 12. These were evaluated to determine which measurement boundaries could be used to encapsulate significant energy savings and conduct a compliant M&V exercise. From the identified measurement boundaries, four potential 12L applications were identified. After eligibility and data quality evaluation, two applications were discarded. The remaining two applications were further evaluated by developing multiple baseline models to allow quantification of the reportable EE savings. After consolidating uncertainties from the multiple models, applications could be evaluated holistically to determine which might be compliant and claimable 12L applications.
The results show that the developed approach can be used to identify and quantify 12L EE savings. From the evaluation, only two claimable 12L applications were identified. The 12L applications approved by SANEDI confirmed that the developed approach can be used to quantify 12L-compliant EE savings. Other measurement boundaries were discarded after the evaluation of eligibility and data quality. This prevented unnecessary time and resource expenditure on applications that would ultimately not be suitable for 12L claims. This indicates the practicality of the developed approach.
5 CONCLUSION
Uncertainty in the quantification of energy savings is inevitable due to the use of imprecise measurements, modelling, and estimations. As a guideline to uncertainty management, the SANS 50010 standard prescribes that quantified savings must be conservative as a way to ensure confidence in the reported savings. Hence, uncertainty must be quantified in order to enable a clear statement of conservativeness. However, quantification and management of uncertainty can be a complex topic that can be applied in different levels of rigour. This is a challenge faced in M&V, and has a significant effect on the 12L tax incentive, which rewards energy efficiency per verified unit of energy.
A practical approach with four key steps is proposed to manage uncertainty during the M&V process of 12L applications. In sequence, it is shown that the steps of identifying an eligible 12L opportunity, evaluating data quality of multiple datasets, developing multiple baseline options, and consolidating uncertainties is essential when determining reportable EE savings. This approach provides a basis to evaluate holistic energy performance and subsequently the uncertainty of reported results. This allows a more concise statement of conservativeness, which thus increases the certainty with which quantified EE savings are reported.
From this study, it is evident that uncertainty management can have a significant effect on quantifying energy indicators. Case studies showed that different calculation methods and uncertainty ranges can deviate by between five per cent and 30 per cent, thus stressing the need for a concise uncertainty management strategy. These uncertainty ranges will also be applicable when quantifying and managing GHG emission indicators. Ultimately, this provides some insight into the practical ramifications of tax-based directives that are intended to reduce GHG emissions and stimulate sustainable development.
ACKNOWLEDGEMENT
This work was sponsored by ETA Operations (Pty) Ltd.
REFERENCES
[1] Alton, T., Arndt, C., Davies, R., Hartley, F., Makrelov, K., Thurlow, J. and Ubogu, D. 2014. Introducing carbon taxes in South Africa, Applied Energy, 116, pp. 344-354. [ Links ]
[2] United Nations Framework Convention on Climate Change. 2015. Conference of parties - Adoption of the Paris Agreement, United Nations, Paris, France. [ Links ]
[3] National Treasury. 2013. Regulations in terms of section 12L of the South African Income Tax Act, 1962, on the allowance for energy efficiency savings, Government Gazette, 37136(R.971), pp. 3-10. [ Links ]
[4] Minister of Finance. 2015. Draft Carbon Tax Bill as introduced in the National Assembly of the Republic of South Africa. National Treasury, South Africa. [ Links ]
[5] Thomas, S. 2013. Carbon tax route to revenue, Financial Mail, April 2013, pp. 38-39. [ Links ]
[6] Republic of South Africa. 2013. Section 12L of the Income Tax Act (no. 58 of 1962): Deduction in respect of energy efficiency savings. National Treasury, South Africa. [ Links ]
[7] Department of Energy. 2016. Draft post-2015 national energy efficiency strategy, Government Gazette, 40515(R.948), pp. 426-471. [ Links ]
[8] Southern Africa Association of Energy Efficiency. 2015. Section 12L tax allowance basics #1,: President's message, 2015 [Online]. Available: http://www.saee.org.za/Newsletters/SAEE_President/16 September 2015_From the SAEE PresidentSection12LTaxAllowance Basics.pdf. [ Links ]
[9] Radloff, G. 2014. Energy efficiency tax incentives - Some practical issues and concerns. EE Publishers. [Online]. Available: http://www.ee.co.za/article/energy-efficiency-tax-incentives-practical-issues-concerns.html. [ Links ]
[10] Du Toit, E.F. 2011. Energy efficiency savings allowance in South Africa: An international comparison. Masters dissertation, University of Pretoria, South Africa. [ Links ]
[11] Efficiency Valuation Organization. 2012. International performance measurement & verification protocol: Concepts and options for determining energy and water savings Volume 1. Efficiency Valuation Organization, Washington, USA. [ Links ]
[12] Harris, P. 2012. South African environmental taxes and investment incentives in practice. Research report, University of Stellenbosch, South Africa, 2012. [ Links ]
[13] Booysen, W. 2014. Measurement and verification of industrial DSM projects. PhD thesis, North-West University, South Africa. [ Links ]
[14] Vine, E. and Sathaye, J. 1997. The monitoring, evaluation, reporting, and verification of climate change mitigation projects: Discussion of issues and methodologies and review of existing protocols and guidelines. Environmental Energy Technologies Division, Lawrence Berkeley National Laboratory, USA. [ Links ]
[15] Boyd, A., Rennkamp, B., Winkler, H., Larmour, R., Letete, T., Rahlao, S. and Trikam A. 2012. South African approaches to measuring, reporting and verifying: A scoping report. Cape Town: Energy Research Centre, University of Cape Town. [ Links ]
[16] Gous, A.G.S., Booysen W. and Hamer, W. 2016. Data quality evaluation for measurement and verification processes, in Industrial and Commercial Use of Energy conference, Cape Town, South Africa. [Online]. http://ieeexplore.ieee.org/document/7605609/. [ Links ]
[17] Den Heijer, W. and Grobler, L.J. 2010. Measurement and verification guideline for energy efficiency and demand-side management (EEDSM) projects and programmes. Corporate Services Division, Assurance and Forensic Department, Eskom Holdings SOC Ltd, South Africa. [ Links ]
[18] SABS. 2011. SANS 50010: 2011 Measurement and verification of energy savings. SABS Standards Division, Pretoria, South Africa. [ Links ]
[19] SABS. 2017. SANS 50010: 2017 Measurement and verification of energy savings. SABS Standards Division, Pretoria, South Africa. [ Links ]
[20] Den Heijer, W. and Grobler, L.J. 2009. Measurement and verification guideline for energy efficiency certificates. Southern African Association for Energy Efficiency, Council of Measurement and Verification Professionals of South Africa, Potchefstroom, South Africa. [ Links ]
[21] American Society of Heating Refrigeration and Air-conditioning. 2002. ASHRAE guideline: Measurement of energy and demand savings. American Society of Heating Refrigeration and Air-conditioning, Inc., Atlanta, USA. [ Links ]
[22] Amundson, T., Brooks, S., Eskil, J., Martin, S. and Mulqueen, S. 2013. Elements of defensible regression-based energy models for monitoring and reporting energy savings in industrial energy efficiency operation and maintenance projects, in 2013 ACEEE Summer Study on Energy Efficiency in Industry, pp. 1-14. [ Links ]
[23] Efficiency Valuation Organization. 2014. Statistics and uncertainty for international performance measurement & verification protocol. Efficiency Valuation Organization, Washington, USA. [ Links ]
[24] Mathews, G.E., Hamer, W., Booysen, W., Vosloo, J.C. and Mathews, E.H. 2016. The case for multiple models and methods of verification in the measurement & verification of energy efficiency projects, in Industrial and Commercial Use of Energy conference, Cape Town, South Africa. [Online]. http://ieeexplore.ieee.org/document/7605640/. [ Links ]
[25] National Treasury. 2015. Regulations in terms of section 12L of the South African Income Tax Act, 1962, on the allowance for energy efficiency savings, Government Gazette, 38541(R.186), pp. 1-4. [ Links ]
[26] Hamer, W. 2016. A practical approach to quantify RSA Section 12L EE tax incentives for large industry. PhD thesis, North-West University, South Africa. [ Links ]
[27] Hubauer, T., Lamparter, S., Roshchin, M., Solomakhina, N. and Watson S. 2013. Analysis of data quality issues in real-world industrial data, in Annual Conference of the Prognostics and Health Management Society, New Orleans, USA. [Online]. https://www.phmsociety.org/node/1105. [ Links ]
[28] Booysen, W., Hamer, W. and Joubert, H.P.R. 2016. A simplified methodology for baseline model evaluation and comparison, in Industrial and Commercial Use of Energy conference, Cape Town, South Africa. [Online]. http://ieeexplore.ieee.org/document/7605637/. [ Links ]
* Corresponding author waldthamer7@gmail.com
# Author was a post-doctoral student at the North-West University's Centre for Research and Continued Engineering Development (CRCED) in Pretoria at the time of publication.

