


Servicios Personalizados
Articulo
 Inglés (pdf)
 Articulo en XML
 Referencias del artículo
Indicadores

Links relacionados
-
 Citado por Google
 -
 Similares en Google
Compartir

 Permalink
South African Journal of Industrial Engineering
versión On-line ISSN 2224-7890
versión impresa ISSN 1012-277X
S. Afr. J. Ind. Eng. vol.28 no.3 Pretoria 2017
http://dx.doi.org/10.7166/28-3-1846
GENERAL ARTICLES
Customer super-profiling demonstrator to enable efficient targeting in marketing campaigns
Department of Industrial Engineering, University of Stellenbosch, South Africa
ABSTRACT
Difficulties lie with identifying the right customers to engage in successful marketing campaigns. Thus far, segmentation has been a popular marketing method for selecting customer groups for targeted campaigns. However, each segment can be further exploited by performing customer profiling. In this paper, we explain the on-going development of a proposed simulator and demonstration tool that incorporates big data analytics to uncover hidden patterns within the customer dataset, thereby generating a customer super-profile. A developed toy problem and a large, realistic problem demonstrate segmentation, via clustering, and create customer profiles to enable marketers to identify appropriate marketing strategies. The proposed framework serves as the basis for enhancing customer relationship management by providing improved customer profiles for marketing campaigns.
OPSOMMING
Daar is uitdagings by die identifisering van die regte kliënte vir suksesvolle bemarkingsveldtogte. Tot dusver is segmentasie 'n gewilde bemarkingmetode om te gebruik om kliëntgroepe te kies vir teikenveldtogte. Elke segment kan egter nog verder ontgin word deur kliënteprofilering uit te voer. In die artikel beskryf ons die ontwikkeling van 'n voorgestelde simulator en demonstrasie-werktuig wat groot data-analise inkorporeer om verborge patrone binne die kliëntedatastel te ontbloot, en daardeur word 'n kliëntsuperprofiel geskep. 'n Eenvoudige asook 'n groot, realistiese probleem demonstreer segmentasie deur groepering, en ontwikkel kliëntprofiele om bemarkers in staat te stel om geskikte bemarkingstrategieë te identifiseer. Die voorgestelde raamwerk dien as 'n basis om kliënte-verhoudingbestuur te versterk, deur verbeterde kliëntprofiele vir bemarkingsveldtogte beskikbaar te stel.
1 INTRODUCTION
The research work reported on in this paper is part of a larger project in the domain of big data, and deals with specific aspects of customer profiling. Data are a resource that must be managed, since it costs money to acquire, secure, and retrieve. Nowadays, data are used more and more to generate revenue, and the industrial engineer is an ideal candidate to be involved in this new drive, which requires systems thinking, interfacing, and analysis.
In recent years information technology has transformed the way marketing is done, as well as how companies manage information about their customers [1]. Marketing managers can develop long-term and pleasant relationships with customers, if they can detect and predict changes in their customers' consumption behaviour [2]. The availability of large volumes of data about customers, empowered by new information technology tools, has created opportunities as well as challenges for businesses to leverage the data and gain competitive advantage [1]. Due to the growth of information systems and technology, businesses have an increasing capability to accumulate huge amounts of customer data in large databases. However, much of this useful marketing insight into customer characteristics and their purchasing patterns is often hidden and untapped. Therefore, businesses can achieve competitive advantage by studying customer behaviour through data mining tools and techniques [2]. Once this is established, these models can be used to classify new customers, leading to the ability to predict each customer's specific needs.
The goal of data mining varies from one area to another. According to [1], data mining tools can help discover hidden knowledge in datasets to understand customers better. Data mining is referred to as a technique used to extract knowledge from information [3]. Thus, one can define data mining, with respect to customer profiling, as being the technology that allows building customer models (profiles), where each model describes the specific habits, needs and behaviour of a customer group (segment). Therefore, developing customer profiles is an important step for targeted marketing campaigns, for it does not only classify new customers, but also provide information of current customers [4].
This paper first explores traditional segmentation and profiling methods, and subsequently reviews data mining tools used for these processes. Next, the paper envisages a proposed simulator that requires raw input data and a customised demonstration tool that incorporates big data analytics to uncover hidden patterns within the customer dataset, thereby generating a customer super-profile. A customer super-profile encompasses a traditional customer profile plus additional innovative value-adding customer attributes and behaviours that can be used to promote marketing schemes. The aim of the demonstration tool is to illustrate how new or existing customer profiles can be discovered and refined for use by companies in different trading domains (outdoors, sport, vehicles, clothing, etc.) in marketing. The intellectual property of the demonstrator tool can be trademarked by the developers, while the information (super-profiles) generated can be sold to various marketing companies.
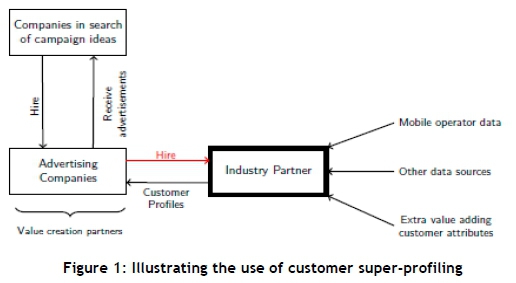
Figure 1 denotes the purpose of the proposed demonstration tool. It functions as a super-profiling analytics tool that receives various customer attributes as input to create customer super-profiles. Companies in search of campaign ideas appoint advertising companies to assist them with marketing campaigns. On the other hand, advertising companies are in search of companies/developers that possess a profiling tool to provide them with reliable customer profiles for targeted marketing campaigns. These advertising companies are the value-creation partners: when they hire the industry partner they provide a revenue stream.
The research methodology followed for this project is represented in Figure 2. However, this paper focuses only on Phases 1 and 2 of the project methodology (Figure 2). The literature review, which forms Phase 1 of the research methodology, includes segmentation, profiling, and big data analytics. Phase 2 follows with a solution architecture. Phases 3 to 5 form part of future work.
The paper is structured as follows: Section 2 provides a brief literature review of segmentation, customer profiling, marketing strategies, and big data analytics. Section 3 presents the proposed solution architecture for the customer super-profiling demonstrator. Section 4 states the current status of the research by using 1) a toy problem and 2) a large dataset, while the last section discusses future work and gives concluding remarks.
2 LITERATURE REVIEW
Within this section, segmentation and customer profiling will be examined first, leading to a marketing strategy associated with these two concepts. The purpose is not to do a comprehensive literature review, but rather to get a clear understanding of the differences between the two concepts. Segmentation is often used in conjunction with profiling; but for the purpose of this article, the authors deliberately separate the concepts. This section will begin by outlining segmentation, followed by customer profiling, and will conclude with a brief overview of big data analytics.
2.1 Segmentation
Segmentation is performed on an unordered customer dataset that is intended for marketing purposes. This section discusses both market segmentation and customer segmentation, and mentions available data mining techniques to support these processes. Market segmentation is a popular marketing technique; and its benefits are emphasised in numerous textbooks on marketing research [5].
2.1.1 Market segmentation
Market segmentation was first defined in 1956 to provide a conceptual view of an inherently heterogeneous market. Rather than offering the same market mix to massively heterogeneous customers, companies should divide customers into segments and modify the marketing mix for targeted segments to improve customer satisfaction and achieve maximum efficiency. A fundamental task of market segmentation is to group customers on the basis of similarities in their needs, preferences, and characteristics [5,8]. Market segment bases (variables), describing a certain aspect of the customer, include [6,9]:
1. Geographic location of a customer
2. Business demographics
3. Adopter categories
4. Product usage
5. Purchasing approaches
A common tool used for grouping customers with similarities is called clustering. Clustering could be defined as a technique that groups entities with similar characteristics into segments, and each segment is a group of homogeneous customers that marketers can identify, target, and communicate to.
In early market segmentation research, clustering was synonymous with market segmentation. However, as the spectrum of market segmentation expanded to studies of customer interaction with marketing mix, the market segmentation techniques evolved to simultaneously consider multiple sets of variables (more than one segmentation base). Traditional clustering analysis is suitable when only one set of variables (one segment base) needs to be clustered. For example, customer geographic location and customer product usage are two different segment bases, but could be used together in marketing research studies to understand their interactions and correlations. A market segmentation model that uses more than one segment base is called joint market segmentation, and traditional clustering techniques are not designed for multi-objective optimisation. For a multiple objective problem, a single 'optimal' solution is not usually available, because there are trade-offs among multiple objectives. To define the acceptable optimal solution, the term Pareto optimal is used by researchers [6].
Market segmentation is constantly under investigation by researchers. An abundance of segmentation methods is available, including k-means clustering, hierarchical clustering, automation detection, classification and regression trees, and neural networks. [6]. The overall goal of using a market segmentation strategy is to improve a company's position and better serve the needs of the customers [7]. This is done by discovering and characterising customer groups and attaining profitable customer segments.
2.1.2 Customer segmentation
The literature does not provide a plausible definition to distinguish between market segmentation and customer segmentation; therefore the authors understand that market segmentation is generally used for high level strategy, whereas customer segmentation provides a more detailed view. An approach to combine customer segmentation and customer targeting for campaign strategies can be initialised by using a well-known method called the recency, frequency and monetary (RFM) model, which represents customer behaviour characteristics [8,9,10]. The 'R' indicates the latest purchase amount, the 'F' indicates the total number of purchases during a specific period, and the 'M' indicates the monetary value spent during one specific period.
The literature indicates that the RFM model can be used together with a customer life time value (LTV) model, which evaluates the proposed segmented customers by calculating the current customer value and predicting the potential customer value [9]. Chan [9] proposes using a genetic algorithm to select more appropriate customers for each campaign strategy, with the LTV model serving as the fitness function of the genetic algorithm. Differentiating from the collaborative 'RFM-LTV' approach, Kim, Jung, Suh, and Hwang [10] suggest performing customer segmentation by using LTV components, which include the current value, potential value, and customer loyalty.
In traditional markets, customer segmentation is one of the most significant methods used in studies of marketing. However, numerous mathematical methods are available to determine customer groups. Existing segmentation studies that are methodology-driven and focus on how to identify the optimised segmented homogenous groups include statistics, neural networks, genetic algorithms, and fuzzy /(-means clustering; these studies were performed by various researchers [10,11,12,28].
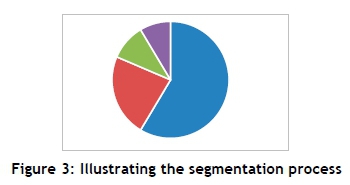
To conclude the discussion of segmentation, Figure 3 offers a simple explanation of the (market) segmentation process. As can be seen, a customer population can be divided into different segments according to different dimensions or characteristics. For example, imagine that Figure 3 represents a population that was separated according to the region in which the customers lived (geographic segmentation). It can be seen that four segments appeared, of different sizes. These different sizes illustrate that each region contains a different number of customers; but the picture would change if a different dimension were selected for segmentation. However, the members in a segment still have different characteristics that can be further exploited by a technique called customer profiling. This is discussed next.
2.2 Customer profiling
Customer profiling describes customers based on their attributes such as age, gender, income, and lifestyles, in order to identify the characteristics of a group of people and describe what they are like. Employing both the segmentation and customer profiling processes, marketers can decide which marketing strategies to adopt for each segment; this is a way of interacting with existing customers. This process also ensures better relationships with customers; the better the relationship, the easier it is to conduct business and generate revenue. Usually this is referred to as customer relationship management (CRM) [12]. It is clear from various studies that there is not a definite segmentation and customer profiling approach to follow: for each type of database a different approach is used. There are broadly two kinds of profiling: demographic profiling and behavioural profiling [13].
2.2.1 Demographic customer profiles
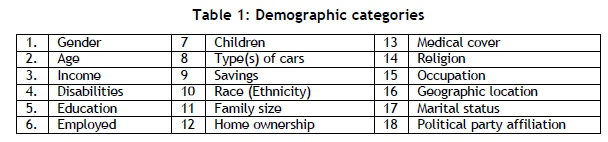
Customer demographical profiling is a classic marketing approach to follow, and contains a set of characteristics; the popular demographic categories are indicated in Table 1. Furthermore, different customers in different life stages have different needs, and so purchase differently [14].
Consider the following customer profile:
-
Profile 1: Customer is married, has children, lives in an up-market neighbourhood, and reads the Economic Times newspaper.
Profile 1 involves a set of characteristics that are demographic for someone in the advertising department, or while deciding the content for a website. A customer demographic profile is usually more important than a customer behavioural profile, because it defines the market for advertisement sales and provides clues to editorial direction [15]. Demographic profiles provide vital help in attracting the customer and generating revenue in the early stages of an on-line project [15].
2.2.2 Behavioural customer profiles
Customer behaviour is the process whereby individuals decide whether, what, when, where, how, and from whom to purchase goods and services [16]. However, Mowen and Minor [17] define customer behaviour differently. Behavioural profiling is based on customers' attitude towards, use of, or response to a product. Marketers believe that the behavioural variables that are the best starting points for constructing behavioural-based profiling include:
1. Occasions: Customers are profiled according to the time at which they get the idea to buy, make their purchase, or use the purchased item. A company may choose one kind of marketing strategy around Christmas and another before Valentine's Day.
2. Benefits: Benefit profiling is a process that divides the customers according to the different benefits they may look for in a product.
3. User status: Profiling according to non-users, ex-users, potential users, first-time users, and regular users of a product, a company can customise and personalise its marketing for each group.
4. Usage rate: The usage rate profiling separates the customers according to how much they use a product. They are divided into groups of non-users, light, medium, and heavy product users.
5. Buyer-readiness stage: The buyer-readiness stage refers to customers' awareness of and interest in the product.
6. Loyalty status: A customer can also be profiled according to their loyalty. Hard-core loyals are customers who buy the same product many times; split loyals are customers who are loyal toward two or three brands, and buy these randomly; shift loyals are customers who shift from one brand to another, staying with that brand for a period until they shift to another brand; and lastly, switchers are customers who do not show loyalty or preference towards one particular brand, but rather buy a product or brand that is on sale or available at the time of the occasion.
7. Attitude: Customers can be separated according to whether they have an enthusiastic, positive, indifferent, negative, or hostile attitude toward a product. By considering the customers' attitudes towards a brand or product, the company will get a wide-ranging view of the market and its customers.
Consider the following customer profile:
-
Profile 2: Customer visited an enterprise website every day for two months, but has not visited the website at all in the past two weeks.
Profile 2 involves the real actions of a customer that are behavioural-based, and is concerned with customer action and behaviour. Using customer behaviour information to predict the future relationship with a customer is more prominent than using the demographic information about a customer (Profile 1). The database of customer behaviour provides a better criterion for business enterprises when forecasting their sales/ transactions. Therefore, customer behaviour profiling is critical to a company interested in retaining its customers and increasing their value.
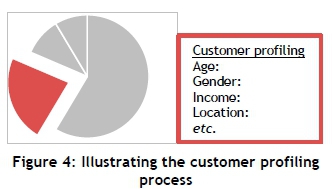
Combining both demographic and behavioural characteristics could serve as a powerful database in deciding the future profitability of a customer to a business enterprise [15]. Error! Reference source not found. provides a basic understanding of the profiling process discussed. Customer profiling is a process that extracts each segment and evaluates the customers in that segment. Figure 4 illustrates the extraction of the second segment (Error! Reference source not found.), and then creating customer profiles for the customers present. This process is followed for each segment. These profiles can contain demographic and other characteristics.
There are millions of unique customers world-wide, covering many potential marketing segments, and marketing to each individual will be very difficult and maybe even impossible. According to the literature, marketing success can be summarised by performing the segmentation, targeting and positioning (STP) strategy [18], with segmentation being seen as the starting point [7].
Having discussed segmentation and customer profiling, the next topic is big data analytics, which enables these concepts on massive datasets.
2.3 Big data analytics
First, 'big data' can be defined as any voluminous amount of structured, semi-structured, or unstructured data that has the potential to be mined for information where the individual records stop mattering and only aggregates matter [19]. Big data is any dataset that cannot be analysed with conventional tools. 'Big data analytics' is thus a relatively new term that is used to describe the analysis of big data. According to the USMA Working Group [20], big data analytics is the entire methodology that is used to analyse big data sets in order to create value for an enterprise.
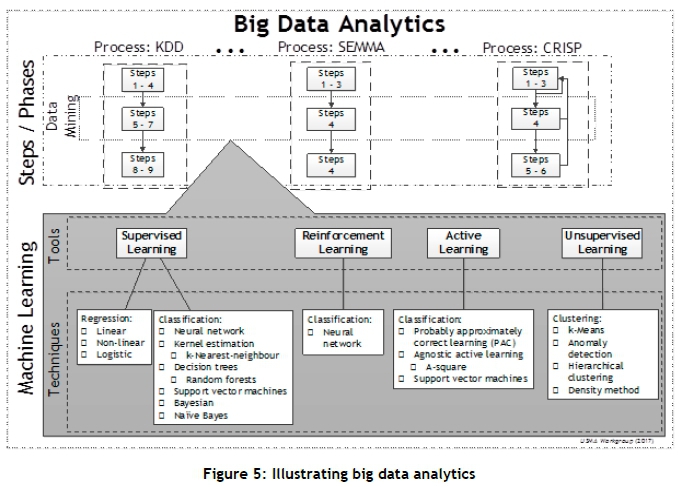
To understand big data analytics better, the USMA Working Group [20] created the diagram shown in Figure 5. There are various processes within big data analytics, with different phases. All the processes have a specific step during which data mining is performed. Figure 5 displays three data analysis processes: Knowledge Discovery in a Database (KDD), Sample, Explore, Modify, Model, and Assess (SEMMA), and an industry standard known as Cross-industry Standard Process (CRISP). These processes provide a structured approach to planning a data mining project. We shall briefly discuss supervised and unsupervised learning, since these are commonly used for segmentation and customer profiling.
Data mining is referred to as the process of searching and analysing data in order to find implicit (unspoken) but potentially useful information [1]. The process involves selecting, exploring, and modelling large amounts of data to uncover previously unspoken patterns, and ultimately comprehensible information, from large databases.
Supervised learning, according to Murphy [21], is the form of machine learning most widely used in practice. Supervised learning is a tool that is given a specific goal for grouping data - for example, to predict the target [16,19]. In machine learning communities, prediction methods are referred to as 'supervised learning' [23]. Therefore, when a question such as "Can we find groups of customers who have particularly high likelihoods of ending their subscription soon after their contracts expire?" is asked, it defines a specific target of whether or not customers will leave when their contract expired, and is referred to as a 'supervised data mining problem' [22].
In supervised learning, the goal is to learn a mapping from input to an output whose correct values are provided by a supervisor. However, in unsupervised learning, there is no such supervisor, and only input data are provided. Unsupervised learning does not have a dependent variable, and the methods are mainly descriptive, searching for unknown patterns or relationships [24]. The goal is to seek regularities within the input. Therefore, when a question like "Do our customers naturally fall into different groups?" is asked, no purpose or target has been specified for grouping. When no target attribute or known outcome is identified, the data mining problem is referred to as unsupervised [19,22]. There is a structure to the input space, such that certain patterns occur more often than others, and therefore it is possible to see what generally occurs and what does not. Each data mining tool contains numerous data mining techniques, which are listed in Figure 5.
2.3.1 Machine learning for the segmenting process
Data mining consist of machine learning tools and techniques [20], these tools and techniques could be used to perform market and customer segmentation. Cluster analysis, an unsupervised learning technique [20], is a common tool used by marketing researchers, for it is a reliable technique for developing empirical groupings of customers, products, or occasions by finding the relationship among data points in order to be segmented, which may serve as a basis for further analysis [25]. The primary use of cluster analysis in marketing has been for market segmentation. Therefore, segmentation research becomes a grouping task. To find customers who are similar, cluster models divide the customer base into many segments and treat the task as a classification problem. The goal of the clustering algorithm is to assign an individual to the segment containing customers with the greatest similarity [26]. Once the algorithm generates the segments, it computes the user's similarity to vectors that summarise each segment, then selects the segment with the strongest similarity and classifies the new individuals accordingly.
Some literature refers to cluster analysis for segmentation [2,28]. These clustering techniques include /(-means, hierarchical methods, complete linkage cluster analysis, average linkage cluster analysis, and iterative portioning methods. However, cluster analysis is not the only technique available for segmentation; market segmentation can also be performed by using the chi-squared automatic interaction detector (CHAID), the genetic algorithm [11,26], /-means, self-organising maps (SOM), and a rule-based approach [9]; and customer segmentation can be performed by using FUZZY, Fuzzy /-means clustering [27], the LTV model [10], and neural networks [27,28].
2.3.2 Machine learning for the profiling process
The literature confirms that the first step when creating a customer profile is to segment the database, as shown earlier. Once various customer segments are available, it is possible to profile the customers by using supervised learning techniques. A trained dataset (supervised learning) has the ability to correspond to a distinct customer profile (examining historic customer data); thus it will be capable of predicting customer profiles for campaigns.
Having presented the literature review, it is clear that the focus is on profiling. There is, however, a lack in the literature of another view on profiling. As mentioned in the literature, profiling has two broad categories: demographic and behavioural profiling. The attributes of both were discussed in this section. It was observed that insufficient literature about customer super-profiling is available, which inspired the authors to research the merits of combining both categories. This combination leads to the concept of super-profiling. The next phase (Phase 2, Figure 2) of the research methodology comprises the development of a solution architecture for customer super-profiling. This is discussed next.
3 DEVELOPMENT OF A SOLUTION ARCHITECTURE FOR SUPER-PROFILING
Our aim is to develop a demonstration tool containing a suite of big data analytics tools and techniques that will allow for customer super-profiling. The need for a simulator that creates data sets with domain-specific properties was identified. The data sets will be used by the customer super-profiling demonstration tool to illustrate the concept of customer super-profiling.
The solution architecture of the simulator and demonstration tool will be developed by following the object-process methodology (OPM), an ISO standard (ISO19450) that includes a clear and concise set of symbols that form a language enabling the expression of the system's building blocks and how they relate to each other. It is a symbolic representation of the structural relations between objects in a system as well as the functions they enable. The OPM represents two things that are essential in a system: its objects and its processes. Objects are what a system or a product consists of, while processes are what a system does. The OPM represents the system simultaneously in a graphic representation and in a natural language (semantic). The two are completely interchangeable, and they represent the same information [29].
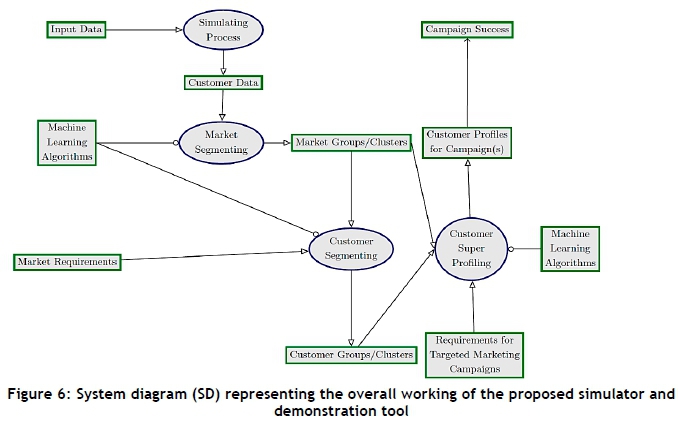
The three main components that constitute the simulator and demonstration tool proposed for predicting the customer profile for a targeted marketing campaign are 1) the simulating process, 2) the segmentation processes, and 3) the profiling process. The interaction between these components and the flow of information between them is illustrated in Figure 6.
The description that follows of the system diagram illustrated in Figure 6 is a broad outline of the demonstration tool, designed to move towards the aim, which is to develop customer super-profiles to enable efficient targeting in marketing campaigns. The simulation process consumes raw input data, and in return yields customer data. The market segmenting process then consumes this customer data, and requires the appropriate machine learning algorithms to yield market group/clusters. The customer segmenting process, together with the appropriate machine learning algorithms that the process requires, consumes both market groups/clusters and market requirements, in order to yield customer groups/ clusters. The customer super-profiling process consumes requirements for targeted marketing campaigns, as well as either market or customer groups. Machine learning algorithms are also required for this process in order to yield customer profiles for campaign(s). Lastly, the produced customer profiles relate to the campaign success.
Object process language (OPL) is the counterpart of the graphic OPM system specifications. The OPL is automatically generated as a textual description of the system in a subset in natural English. Following the OPM guidelines, the OPL for Figure 6 is:
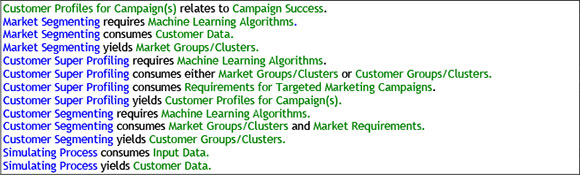
OPM is powerful because it presents a system architecture in visual and textual format.
4 CURRENT STATUS AND FUTURE WORK
In this section, the authors will first use a toy problem to provide an overview of the proposed architecture described in the previous section. A toy problem is a problem that is not of immediate scientific interest, yet it is a useful tool to create a simplified version of a complex problem that is used to demonstrate a concept or proposition. The toy problem presented will deliberately oversimplify the customer segmentation and profiling processes. The segmentation process will be performed by using MATLAB and its built-in clustering functions.
Market segmentation was performed on a very small dataset that contains N=100 customers with many attributes; segmentation divided the customers into different geographical regions. After the market segmentation took place, we supposed that a grocery store in the Western Cape (one of the market segments) desired to obtain more information about their customers; this included demographic and behavioural information, in order to promote targeted campaigns. To obtain this information, the customers of the segmented group (Western Cape customers) will be 'filtered' to consist of only the customers who purchased at the specific local grocery store, and then customer segmentation will be performed on that group (less than the original 100 customers). The customer segmentation process will follow the RFM model approach, determining the R, F, and M parameter values for each customer. After using the RFM model to represent customer behaviour, the data will be encoded by dividing the values of recency, frequency, and monetary into five categories. If the value lies between 100 per cent and 80 per cent, the category value is set to 5; if between 80 per cent and 60 per cent, the value is set to 4; etc.
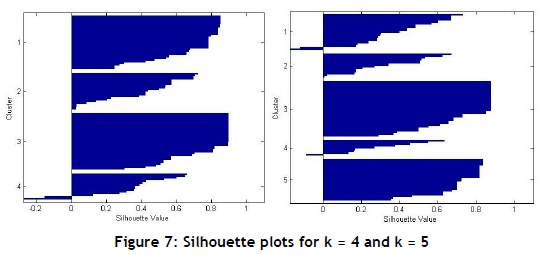
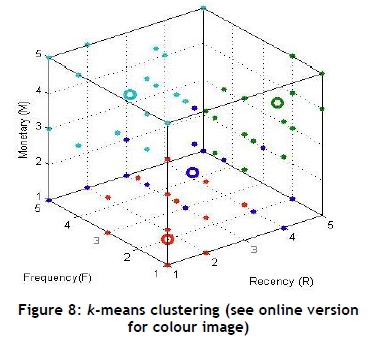
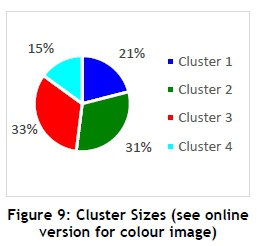
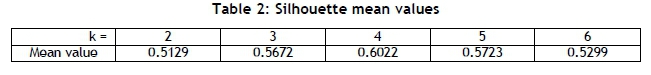
To determine the best number of clusters, silhouette plots were generated. Two of the five generated silhouette plots can be seen in Figure 7. The mean value of each silhouette plot is indicated in Table 2. To determine the best number of clusters from the silhouette plots (Figure 7), the mean value should be as close to one as possible; ideally the plot of each cluster should be above the mean value; and lastly, the width of the plot should be as uniform as possible. The /(-means cluster analysis was performed on the categorical dataset, and four clusters were identified, as seen in Figure 8. After further analysis, Figure 9 represents the four segments and the segmented population sizes.
Hereafter, additional information about each cluster and the customers that are grouped within that cluster could be extracted. The grocery store could specify what information about the customers they are interested in, and further analysis could take place to create customer profiles containing the specified information. For this problem, demographic information is required; therefore each customer within a cluster is profiled according to their gender, age, occupation, annual income, marital status, and whether they have children or not. This information is important for the grocery store, for it affects the customers' purchasing behaviour, and the store then has the ability to identify marketing strategies for their campaign programmes.
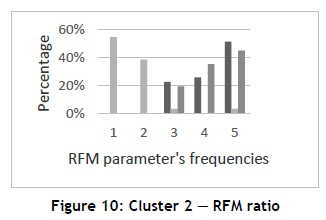
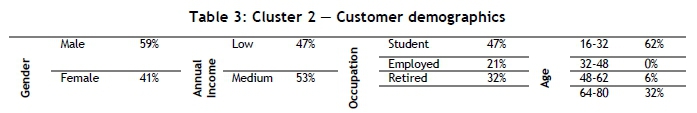
Figure 10 illustrates the RFM ratio of Cluster 2. The RFM parameter frequencies vary from one to five, with five being the highest 'score'. It can be interpreted that most of the customers in Cluster 2 (52 per cent of the customers) have a high recent purchase amount (R=5), where 45 per cent of the customers also have a high monetary value (M=5), but 55 per cent of the customers have a low frequency value (F=1). Table 3 provides a summary of the customers' demographic information, providing their gender, age, occupation, and annual income, which may lead to explaining the low F-value and high R and M-values. Table 3 indicates that 47 per cent of the customers are students, 21 per cent are employed and 32 per cent retired, and that 62 per cent of the customers fall in the age range of 16-32 years of age, 6 per cent in the 48-62 age range, and 32 per cent in the 64-80 age range; therefore the customers' marital and children statuses are intentionally not added, for they will not add value to this customer group.
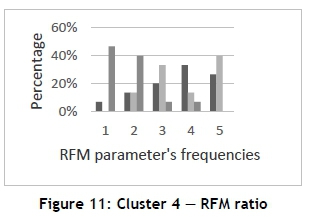
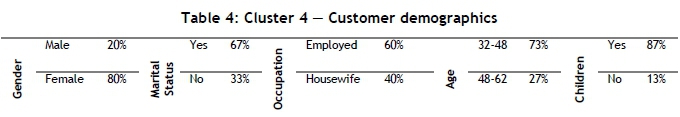
In contrast to Cluster 2, Cluster 4 (the smallest cluster) displays entirely different customer behaviour, as seen in Figure 11. Most of the customers in Cluster 4 (47 per cent) have a low monetary value (M=1), yet 40 per cent of the customers have a high frequency value (F=5), while the recency value is spread from low to high values, with the most customers (33 per cent) falling in the R=4 class. Examining the demographic information of Cluster 4 may provide more insight into their RFM scores. Table 4 provides a summary of the customers' demographic information, providing the gender, age, occupation, and marital and children statuses. Clusters 2 and 4 show a difference in the gender, occupation, and age status; so the marital and children statuses were added, for Cluster 4 customers are in different life stages than Cluster 2 customers, and will require a different marketing/campaign strategy. We have shown here what customer profiling is because we collected and analysed customer demographic information.
As demonstrated by the toy problem, each cluster is unique, as are individual customers. Each cluster has its own properties; therefore, the marketing strategy of each cluster will differ. This information is presented (sold) to the local grocery store, and its marketing team can use the results to prepare and run targeted campaigns.
The authors studied a second problem based on a large dataset, making use of the methodology of the toy problem to illustrate the segmentation and profiling processes in a different, less conventional, domain. The new problem will not focus on the purchasing behaviour of customers (as in the toy problem), but rather on the participation behaviour of campers (as opposed to purchasing behaviour). The authors used the American Camper Report of 2014 [30] as a platform on which to base this problem. This is done to make the RFM model and analysis more realistic.
The RFM model is also used for this problem, with the survey period being a year (January to December). The R indicates how recently the individuals participated in camping, the F indicates the number of camping trips within the survey period, and the M indicates the amount of money spent while camping (for all the trips added together). The length of the trip is not taken under consideration. This is because the information received from the profiling process is used by the outdoor domain for marketing; therefore, the frequency (number of times camped) of campers would be more useful for them than the number of days spent camping. For instance, when the frequency of campers is known, the outdoor domain could target high frequency individuals with advertisements rather than those with a low frequency. The dataset used for this problem consists of 100 000 records of individuals.
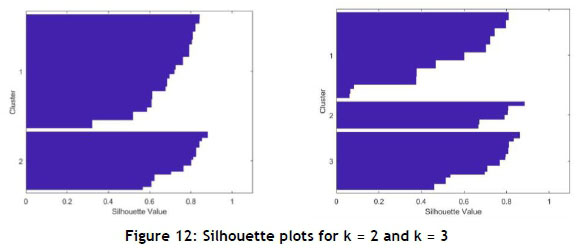
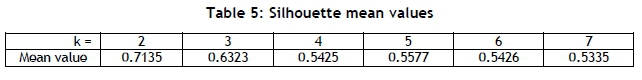
The first step is to determine the best number of clusters to use in the analysis, by generating silhouette plots. Table 5 represents the mean values for each silhouette plot, and it is observed that less misclassification of data point occurs when the dataset is bigger. The mean value for k = 2 is closer to one than k = 3; however, the cluster sizes of k = 3 are closer to each other than those of the k = 2 cluster sizes (Figure 12). Therefore, the authors decided to select three as the best number of clusters, as Figure 12 and Table 5 indicate that three clusters are still seen as a reasonable structure.
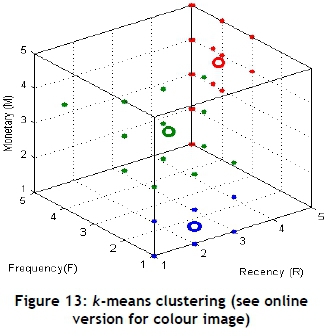
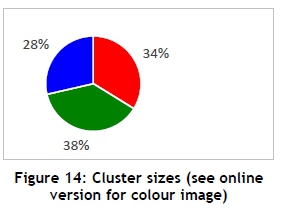
The /(-means cluster analysis was performed on the categorical dataset, and three clusters were identified (Figure 13). After further analysis, Figure 14 represents the three segments and their sizes. Additional information about each cluster and the individuals within that cluster could be extracted in the same manner as for the previous problem. The following variables were used: gender, age, annual income, marital and children statuses, occupation, campsite reservations, and type of shelter.
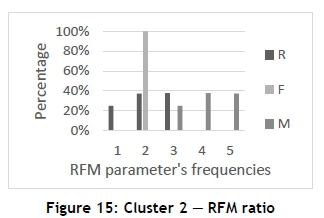
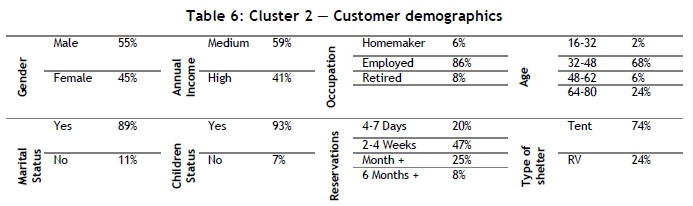
The authors decided to analyse Clusters 2 and 3, because they are the largest and smallest clusters respectively. Figure 15 illustrates the RFM ratio of Cluster 2. It can be interpreted that most of the individuals in Cluster 2 (99.997 per cent) have a low F-value (F = 2), which means that they are not frequent campers. Of the customers, 38 per cent have an R-value equal to three, 37 per cent have an R-value equal to two, and 25 per cent have an R-value equal to one. Lastly, the M-values of this cluster are quite high for campers that have low R and F-values. Therefore, Table 6 was constructed to provide more information about Cluster 2. Table 6 indicates that 55 per cent of the individuals are male and 45 per cent are female; 59 per cent receive a medium annual income and 41 per cent a high annual income. Most of the customers (68 per cent) fall in the age range of 32-48; 89 per cent are married and 93 per cent have children. The greater proportion of individuals (47 per cent) make reservations two to four weeks in advance, and 74 per cent of the individuals prefer tents.
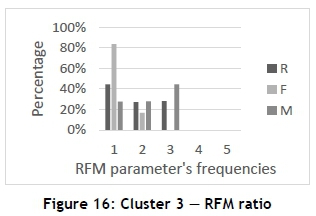
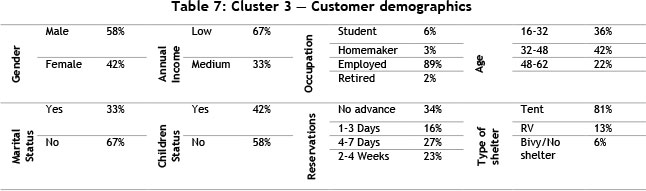
Cluster 3 (the smallest) displays similar RFM values; however, there is a major difference in the Mvalues, as seen in Figure 16. Cluster 3 has low R, F, and M-values; therefore Table 7 might provide insight into these low values. Table 7 indicates that 58 per cent of the individuals are male, and 42 per cent female; 67 per cent receive a low annual income and 33 per cent receive a medium annual income. The majority of individuals (42 per cent) fall in the age range of 32-48, and 36 per cent in the 16-32 age range. Most of the individuals (67 per cent) are not married, and 42 per cent have children. No advance reservations are made by 34 per cent of the individuals, 27 per cent make reservations four to seven days in advance, 23 per cent two to four weeks in advance, and 16 per cent one to three days in advance. Tents are preferred by 81 per cent of the individuals, recreational vehicles (RVs) by 13 per cent, and bivouac shelter (an improvised type of shelter that is usually of a temporary nature, also known as a bivy) or no shelter by six per cent.
If further analysis is needed for these clusters, the following variables could be considered: region, school holiday, seasonality, ethnicity, and medical. The correlation between these variables and camping might provide even deeper insight for the outdoor domain.
5 CONCLUSIONS
Customer super-profiling consists of a large set of analysis models that could be used to predict the behaviour and characteristics of new customers, which enables efficient targeting in marketing campaigns. This paper links segmentation and customer profiling to big data analytics, and more specifically to data mining tools and techniques, by providing a short literature review on the specified topics. After the literature review, the solutions architecture for super-profiling was proposed that encompass the computational properties of market segmentation, customer segmentation, and customer profiling. Two problems (one small, one larger) were created to demonstrate the outcomes of the proposed analyses. They indicated the current status of the research work and helped to identify future work, which includes developing an analytics tool that has the ability to perform segmentation and customer profiling on a real-world large database, and yield reliable customer profiles that are acceptable to marketers. The super-profiling methodology will be further tested on more business domains, such as banking and sport, in order to validate it. Results evaluation will be used to refine the methodology. With their understanding of systems, system integration, and analytical knowledge, industrial engineers should find these challenges exciting and relevant in our modern world.
REFERENCES
[1] Shaw, M.J., Subramaniam, C., Tan, W.G. & Welge, M.E. 2001. Knowledge management and data mining for marketing, Decis. Support Syst., 31(1), pp. 127. [ Links ]
[2] Romdhane, L.B., Fadhel, N. & Ayeb, B. 2010. An efficient approach for building customer profiles from business data, Expert Syst. Appl., 37(2), pp. 1573-1585. [ Links ]
[3] Chen, T.H. & Chen, C.W. 2010. Application of data mining to the spatial heterogeneity of foreclosed mortgages, Expert Syst. Appl., 37(2), pp. 993-997. [ Links ]
[4] Fan, S., Lau, R.Y.K. & Zhao, J.L. 2015. Demystifying big data analytics for business intelligence through the lens of marketing mix, Big Data Res., 2(1), pp. 28-32. [ Links ]
[5] Muller, H. & Hamm, U. 2014. Stability of market segmentation with cluster analysis - A methodological approach, Food Qual. Prefer., 34, pp. 70-78. [ Links ]
[6] Liu, Y., Kiang, Y. & Brusco, M. 2012. A unified framework for market segmentation and its applications, Expert Syst. Appl., 39(11), pp. 10292-10302. [ Links ]
[7] Weinstein, A. 2013. Handbook of market segmentation: Strategic targeting for business and technology firms, 3rd edition, USA: Taylor & Francis. [ Links ]
[8] Hosseini, M. & Shabani, M. 2015. New approach to customer segmentation based on changes in customer value, J. Mark. Anal., 3(3), pp. 110-121. [ Links ]
[9] Chan, C.C.H. 2008. Intelligent value-based customer segmentation method for campaign management: A case study of automobile retailer, Expert Syst. Appl., 34(4), pp. 2754-2762. [ Links ]
[10] Kim, S.Y., Jung, T.S., Suh, E.H. & Hwang, H.S. 2006. Customer segmentation and strategy development based on customer lifetime value: A case study, Expert Syst. Appl., 31 (1), pp. 101-107. [ Links ]
[11] Jonker, J.J., Piersma, N. & van den Poel, D. 2004. Joint optimization of customer segmentation and marketing policy to maximize long-term profitability, Expert Syst. Appl., 27(2), pp. 159-168. [ Links ]
[12] Zopounidis, C. (ed.). 2012. New trends in banking management. Germany: SpringerScience & Business Media. [ Links ]
[13] INDIGO Ltd. 2013. Factsheet: Customer profiling and segmentation tools, http://asimetrica.org/wp-content/uploads/2014/08/FACTSHEET-CUSTOMER-PROFILING-AND-SEGMENTATION-TOOLS.pdf. Accessed 16 May 2017. [ Links ]
[14] Ungerer, G.D. 2013. A competitive strategy framework for e-business start-ups. Doctoral dissertation, Stellenbosch: Stellenbosch University. [ Links ]
[15] Yankelovich, D. & Meer, D. 2006. Rediscovering market segmentation, Harv. Bus. Rev., 84(2), pp. 122-131. [ Links ]
[16] Walters, C.G. 1974. Consumer behavior: Theory and practice. Glencoe, III.: Irwin. [ Links ]
[17] Mowen, J. & Minor, M. 1997. Consumer behavior, 5th edition, USA: Prentice Hall. [ Links ]
[18] Lynn, M. 2012. Segmenting and targeting your mar(et: Strategies and limitations. USA: John Wiley & Sons, Inc. [ Links ]
[19] Prasad, Y.L. 2016. Big data analytics made easy. USA: Notion Press. [ Links ]
[20] USMA. 2017. USMA Working Group, Dept. of Industrial Engineering, Stellenbosch University, 2007. [ Links ]
[21] Murphy, K.P. 2012. Machine learning: A probabilistic perspective. Boston: MIT Press. [ Links ]
[22] Provost, F. & Fawcett, T. 2013. Data science for businesses, 1st edition. USA: O'Reilly Media, Inc. [ Links ]
[23] H. Dahan, H., Cohen, S., Rokach, L. & Maimon, L. 2014. Proactive data mining with decision trees, 1st edition. USA: Springer. [ Links ]
[24] Bramer, M.A. 2013. Principles of data mining, 2nd edition. UK: Springer. [ Links ]
[25] Punj, G. & Stewart, D.W. 1983. Cluster analysis in marketing research: Review and suggestions for application, Source J. Mark. Res. J. Mark. Res., 20(2), pp. 134-148. [ Links ]
[26] Linden, G., Smith, B. & York, J. 2013. Amazon.com recommendations Item-to-Item collaborative filtering. IEEE Internet Comput. , 7, pp. 76-80. [ Links ]
[27] Shin, H.W. & Sohn, S.Y. 2004. Segmentation of stock trading customers according to potential value, Expert Syst. Appl., 27(1), pp. 27-33. [ Links ]
[28] Bloom, J.Z. 2005. Market segmentation: A neural network application, Ann. Tour. Res., 32(1), pp. 93-111. [ Links ]
[29] Dori, D. 2002. Object-process methodology: A holistic systems paradigm. Germany: Springer Science & Business Media. [ Links ]
[30] American Outdoor Foundation. 2014. 2014 American camper report, http://www.outdoorfoundation.org/pdf/research.camping.2014.pdf. Accessed 14 September 2017. [ Links ]
* Corresponding author 17618142@sun.ac.za
# The author was enrolled for an M Eng (Industrial) degree in the Department of Industrial Engineering, University of Stellenbosch.

