


Services on Demand
Article
 English (pdf)
 Article in xml format
 Article references
Indicators

Related links
-
 Cited by Google
 -
 Similars in Google
Share

 Permalink
South African Journal of Industrial Engineering
On-line version ISSN 2224-7890
Print version ISSN 1012-277X
S. Afr. J. Ind. Eng. vol.28 n.3 Pretoria 2017
http://dx.doi.org/10.7166/28-3-1840
GENERAL ARTICLES
Automated electricity bill analysis in South Africa
P. Goosen*; M.J. Mathews; J.C. Vosloo
Center for Research and Continued Engineering Development (CRCED), North-West University, Pretoria, South Africa
ABSTRACT
The ever-increasing cost of energy puts industries under pressure. Industries are forced to monitor their energy consumption and to manage energy more efficiently and responsibly. Some industrial companies have multiple operations spread out over a wide area, making it logistically difficult to get a holistic view of the company's energy performance. Valuable information is freely available in the form of electricity bills. However, to benefit from the information in the bills, the data should be extracted and analysed, which is a time-consuming process. In this paper, a need for an automated centralised system that extracts and analyses electricity data from bills was identified. The methodology for extracting, organising, and presenting the electricity bill information is explained in detail. The system is implemented for a gold mining company, and the results are interpreted and discussed. It was found that the system is beneficial for companies with many operations. As the number of operations increases, the value of automated bill analysis increases.
OPSOMMING
Die kostes verbonde aan elektrisiteit in Suid-Afrika neem vinnig toe en die befondsingshekkie vir energiebesparinginsentiewe verminder. Daarom, met die toenemende internasionale mededinging en operasionele kostes, moet marginale industrieë fokus op energiebestuurstrategieë waar groot besparings met klein kapitaalbestedings verwesenlik kan word. 'n Behoefte aan 'n omvattende energiebestuur informasiestelsel word uiteengesit in hierdie artikel. Energiebestuur slaggate word uitgelig en energiebesparinginsentiewe word bespreek. Nuwe fokuspunte wat kliëntbewustheid verbeter en gevolglik die volhoubaarheid van energiebestuuringrypings verhoog word ook uitgelig. Om voordeel te trek uit energiebesparings word egter meer ingewikkeld en gevolglik ly baie kliënte daaronder, behalwe as hulle industriekenners betrek. Hierdie industriekenners vereis egter groot hoeveelhede data om 'n kliënt se energie effektief te bestuur. Daarin lê die noodsaak vir 'n omvattende energiebestuur informasiestelsel. So 'n energiebestuur informasiestelsel is ontwikkel en geïmplementeer vir verskeie industrieë in Suid-Afrika. Data is outomaties ingesamel, geprosesseer, analiseer en voorgehou op n daaglikse basis. 'n Gevallestudie ondersoek die enorme hoeveelheid data en verslae wat outomaties bestuur word. Dit beklemtoon die behoefte aan n omvattende energiebestuur informasiestelsel.
1 INTRODUCTION
Energy is expensive around the world; and in South Africa, electricity prices have increased dramatically in the last decade [1-4]. This has placed considerable pressure on industries to monitor their electricity consumption and implement initiatives to reduce their electricity costs [4-6].
Effective energy management requires comprehensive monitoring of energy consumption. Therefore, energy should be measured at as many nodes as possible, to determine which consumers are using energy inefficiently. However, to measure the electricity consumption at each node requires expensive additional infrastructure, if it is not already installed. Fortunately, high level electricity data is freely available in the form of electricity bills (invoices). Electricity bills contain a lot of information that can provide valuable insights to assist with energy management efforts [7].
Electricity bills, as a feedback instrument, are a form of indirect feedback, as it is only available some time after the energy has been consumed. The energy savings potential for indirect feedback is consequently not as large as direct feedback, if it is readily available. Darby investigated studies on indirect feedback that showed that domestic consumers can save up to 19 per cent on their electricity bill, using indirect feedback [8]. Although savings levels were not as high as for direct feedback, indirect feedback has been shown to increase the interest and awareness of consumers [8].
The problem for large electricity consumers is that bills are sent to the finance department. The actual electricity consumers on the ground do not always get a view, or any other detail, of their consumption. Therefore consumers do not necessarily grasp the cost implications of their actions. When energy information is available, awareness increases. Furthermore, a substantial amount of additional information is included in the bills, which might be of no interest to the finance department, but which can offer valuable insights to the consumer, engineer, or manager on the ground. Consumers also rarely see a holistic view of the company's electricity consumption, which could give them a better understanding of how their actions affect the company.
Large energy consumers, unlike most typical energy users, face an additional challenge - the scale of their operations, with most large energy users having multiple points-of-delivery (POD) where electricity is provided to the user. This complicates the bill analysis of these consumers by increasing the factors that must be considered. Therefore, a system that automatically analyses the electricity data on a company-wide scale is needed.
As stated, valuable insight can be gained from the information provided in electricity bills. The aim of this work is to develop a method to analyse electricity bills automatically, and provide information from which insights can be gained, to reduce electricity consumption and cost.
2 METHOD
The method explained here is for the electricity bills issued by Eskom, the main electricity supplier in South Africa. Many large industries in South Africa receive electricity bills directly from Eskom. Each bill has one account number and one or more premise numbers for each measuring point or point-of-delivery (POD). Essentially, several PODs can be grouped together in one account. In an Eskom bill, there is also a summary page containing the total energy and cost data for the account (sum of all PODs), and one page for each POD containing more detailed electricity consumption information. While this method is specific to Eskom bills, the underlying method can be applied to bills issued by any electricity supplier.
The process is divided into the following main steps:
1. Data retrieval
2. Data linking and organisation
3. Data analysis and presentation
2.1 Data retrieval
The data retrieval process is automated, from receiving the bills from Eskom to extracting data from each bill and storing it in a centralised database.
Document collection
Original PDF documents (bills) are emailed directly from Eskom to a designated mailbox. If the method is used for multiple clients, each client group will have their own email address to which their electricity bills are sent. An energy management information system (EMIS) monitors the mailboxes for new data in five-minute intervals. If an email containing a bill is found, the bill is downloaded to a predefined folder, to extract the text within the PDF, before the next step is taken.
Data extraction
The PDF text is processed using regular expression patterns to find and extract detailed information. A 'regular expression', in computer science, is a sequence of symbols and characters expressing a string or pattern to be searched for within a longer piece of text. All billing items are extracted as single data points with identifying characteristics. (The different types of data will be discussed in detail in section 2.2.) Overall, it is possible to have more than 45 different parameters that could be captured from different PODs with different tariff structures. A typical POD on a Megaflex tariff structure has about 36 different parameters available over a 12-month period.
Data storage
Each data point (referred to as a 'data tag') is stored in a centralised relational database. Each tag has identifying characteristics linked to it. For example, each tag will be linked to the specific POD and specific data type, such as total energy cost, peak energy cost, and off-peak energy cost.
2.2 Data linking and organisation
To analyse the electricity data in a better way, it is organised into a logical structure. Figure 1 below shows an example of how the electricity bills are organised. Each POD is referred to as a system (level 3). Each account (level 2) is also referred to as a system, and is the sum of all the underlying systems (or PODs). Finally, all the systems can be grouped to get a 'top' system, which represents the entire client group (level 1).

As mentioned earlier, each tag is linked to the specific POD and specific data type. For example, in Figure 1, the tag with the name 'POD A1 Admin charge' is linked to the data type 'Admin charge (R)' and to the corresponding system 'POD A1'. This way it will be easy to cross-reference the values of a specific data type for all the PODs.
Each system also has an alias by which it is better known. For example, in Figure 1, POD A1 is better known as 'Shaft A1'. It sometimes happens that the name of a mine or shaft is changed; but these name changes are not always updated at Eskom. The system therefore allows for name changes, making it easier to understand what data is presented.
2.3 Data analysis and presentation
After the data has been collected and organised, it is analysed and presented in a meaningful way. This section describes the methods used to analyse and present the data. The way data is organised, as shown in Figure 1, makes it possible to analyse the electricity cost and usage for the entire group, each account individually, as well as each POD individually. This is valuable because different shafts, plants, or factories within the same group can now be benchmarked and their electricity costs and consumption compared.
2.3.1 Monthly electricity costs and usage
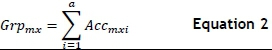
The actual electricity cost and usage data are compared with a cost and usage budget. Equation 1 shows how the value of a specific parameter χ (for example, total electricity cost) for a specific month m is calculated for an account. In the equation, PODmxiindicates the value of parameter χ for POD i in the electricity bill for month m. Consequently, Equation 2 shows how the value of a parameter for the entire group is calculated.
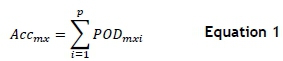
m = month index
χ = parameter index
ρ = number of PODs in an account (Acc)
a = number of accounts in the group (Grp)
The budget is usually determined beforehand by the client. (How it is calculated is not part of this study.) The actual and budget data are displayed for a 12-month period giving an overview of monthly performance. An example of this is given in section 3.1.
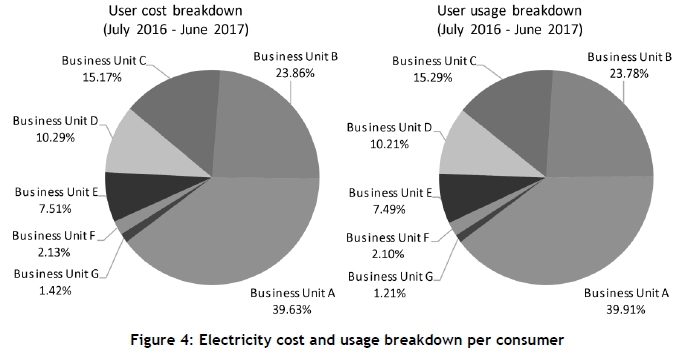
2.3.2 Electricity cost and usage breakdown by consumer
Electricity cost and usage per consumer is calculated and compared. The comparison can be done on the top level, giving the cost and usage breakdown of all the accounts. Equation 1 (above) is used to calculate the values for each account. The comparison can also be done on the account level, giving the breakdown of the PODs of the selected account. The proportional costs and usages are displayed in pie-charts, making it possible to identify any outliers. If there is a large difference between the proportional cost and the usage of a specific consumer, it may warrant further investigation. An example of this is given in section 3.2.
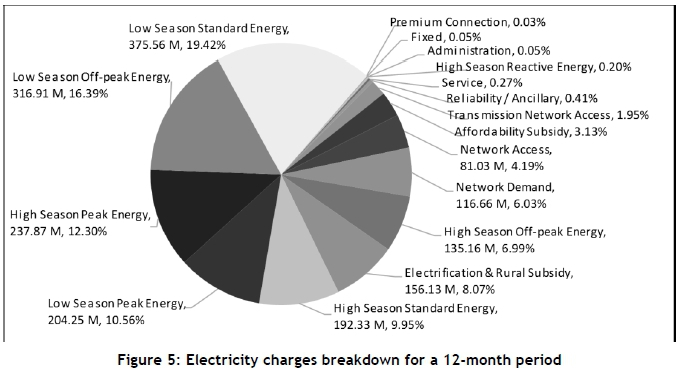
2.3.3 Electricity charges breakdown
Detailed electricity charges for a 12-month period are analysed. On the account level, Equation 1 is used to calculate the total of each charge parameter for each month in the 12-month period. The total of the parameter for the 12-month period is simply the sum of all the months. Similarly, on the group level, Equation 2 is used to calculate the total of each charge parameter. A 12-month period is used for this analysis, as not all the different charges are applicable every month. Potential opportunities to reduce costs can be identified by looking holistically at all the charges. An example of this is given in section 3.3.
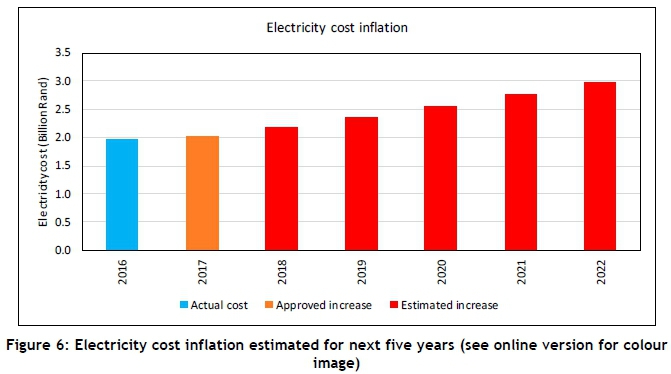
2.3.4 Electricity cost inflation
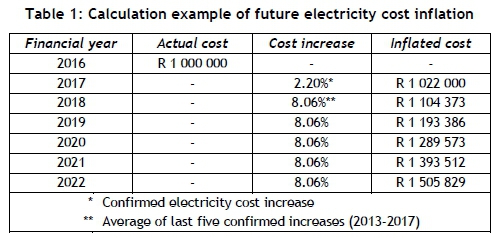
Potential electricity cost inflation for the next five financial years is calculated and displayed. In recent years, Eskom has increased electricity tariffs every year on 1 April. The confirmed average increase for each year is stored in the database. The estimated annual increases for the next five years are determined by calculating the average confirmed increase over the previous five years.
Table 1 shows an example of future electricity cost inflation. The electricity cost for the last complete financial year is calculated. In this example, the actual cost for the 2016 financial year is R1 000 000. For 2017, the inflated cost is calculated by increasing the actual cost for 2016 by the confirmed 2.2 per cent for 2017. The inflated costs for the years that follow are calculated by increasing the inflated cost of the previous year by an estimated 8.06 per cent. In this example, the electricity cost in the 2022 financial year will be more than 50 per cent higher than in the 2016 financial year.
The way the data is organised (shown in Figure 1) makes it possible to analyse the electricity cost inflation for the entire group, for each individual account, and for each POD. An example of this is given in section 3.4.
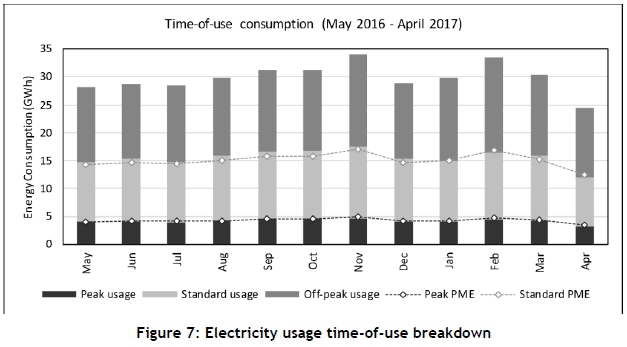
2.3.5 Time-of-use breakdown
Electricity cost and usage for each time-of-use period are compared. The time-of-use consumption data is displayed for each month, which makes it possible to identify opportunities for tariff optimisation strategies by implementing load-shifting initiatives. A normalised electricity usage value is also calculated for electricity usage for each time-of-use period. This is done to understand better the time-of-use breakdown of the total energy used during each month. The peak time-of-use period in the high season is weekdays between 6am-9am and 5pm-7pm. During low season, the peak time-of-use period is weekdays between 7am-10am and 6pm-8pm. Around 14 per cent of the hours in a year fall in this peak time-of-use period. Therefore, if the peak energy used during a month is more than 14 per cent of the total energy used, there is probably potential to improve the time-of-use energy consumption.
To calculate this value, the proportion of hours in a year for each time-of-use period is first calculated. For the peak and standard periods, the proportions are around 14 per cent and 36 per cent respectively. Thereafter, the proportional monthly energy (PME) for the month can be calculated for each time-of-use period, using Equation 3. Time-of-use cost data is also displayed for each month, together with the sum of all the other charges. By using Equation 1 and Equation 2, it is possible to analyse the time-of-use breakdowns for the entire group, for each individual account, and for each POD. An example of this is given in section 3.5.

t = time-of-use period (Peak/Standard/Off-peak)
Ei = total active energy for month i (kWh)
Ht = yearly proportion of hours for period t (%)
PMEti = Proportional Monthly Energy for month i,period t (kWh)
2.3.6 Maximum demand
The maximum demand information can be used to identify potential risks or opportunities. If the margin between the measured maximum demand and the notified maximum demand becomes small, the consumer runs the risk of exceeding the notified maximum demand and thus paying additional charges. In contrast, the maximum demand information can also identify potential opportunities to reduce the cost of the notified maximum demand. If the margin between the notified maximum demand and the measured maximum demand remains constantly large, the consumer can consider lowering the notified maximum demand to reduce these costs.
The average notified maximum demand and measured maximum demand are calculated for a 12-month period. With these values, the average margin is calculated as a percentage, shown in Equation 4 below. The measured maximum demand and notified maximum demand are also displayed for those 12 months. If the margin is relatively constant, the consumer can consider lowering the maximum demand to save costs.
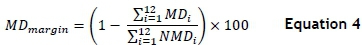
MDi = measured maximum demand for month i (kVA)
NMDi = notified maximum demand for month i (kVA)
2.3.7 Reactive power and power factor
Consumers are only charged during the peak and standard periods of the high season for reactive energy consumption. This charge is only applicable if the reactive energy during a 30-minute period is more than 30 per cent of the active energy, which implies a power factor below 0.96 [3]. Reactive energy can be reduced by installing power factor correction systems (capacitor banks). It is therefore imperative that these systems work correctly during the high season months.
The excess reactive energy consumed during a billing period is, however, only available in the electricity bill during the high-season period when the charge applies. Fortunately, the actual reactive energy for each time-of-use period is available in every electricity bill; the same applies to the active energy for each time-of-use period, which means that the average power factor for each billing period can be calculated. Equation 7, used for calculating the power factor, is derived from Equation 5 and Equation 6. The active, reactive, and apparent powers in the equations can be replaced with the active, reactive, and apparent energies, because they are measured over the same period.
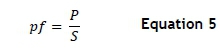
pf = power factor
Ρ = active power (kW)
S = apparent power (kVA)
Q = reactive power (kvar)
3 RESULTS
The method was implemented at a South African gold mine. The mine has 45 PODs divided into seven accounts, each of which is sent to a designated email address every month. The EMIS downloads these emails and extracts the data using regular expressions. The data is stored in a centralised database as tags, which are linked to systems, as described in Section 2.2. The sections that follow show some of the data that is available on the EMIS and that can be used by energy management personnel to make informed decisions.
3.1 Electricity costs and usage
Figure 2 shows a monthly electricity cost comparison for the entire group. The values of all the underlying PODs are summed to generate the information in this figure. The figure also displays the budgeted electricity cost for each month. It is therefore possible to track the electricity costs for the entire mining group, compared with the monthly electricity budget. As seen from Figure 2, the months of April to June show a large reduction in electricity cost compared with the budget. This can indicate that less energy than expected was consumed, or that a higher electricity tariff increase was expected for April 2017, or a combination of both.
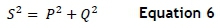
Figure 3 shows the monthly electricity usage comparison for the entire group. The values of all the underlying PODs are summed to generate the information in this figure. The figure also displays the budgeted electricity usages for each month. It is therefore possible to track the electricity usage for the entire mining group compared with the monthly electricity budgets. As seen from Figure 3, the months of March to June show a large reduction in electricity usage compared with the budget. Comparing Figure 3 and Figure 2, it can be argued that a higher electricity tariff increase was expected from April 2017, compared with the actual average increase of 2.2 per cent. Future budgets can now be adapted with the actual increase that was given, to ensure accuracy.
3.2 Electricity cost and usage breakdown by consumer
Figure 4 shows the electricity cost and usage breakdown of all the accounts over a 12-month period. From this figure, it is easy to identify which consumer has the highest electricity cost and who consumes the most electricity. In this example, the electricity cost and usage of the accounts correlate relatively well - meaning the more electricity consumed, the higher the electricity cost. This figure will make it possible to identify a system that consumes proportionately less or more energy than the electricity cost. This is possible due to the consumer being on a time-of-use tariff structure that allows different energy pricing at different times of the day. The results from Figure 4 indicate that the business units are making similar use of their time-of-use tariff structures. Section 3.5 will show how it is possible to investigate whether this is the best use of the tariff structure.
3.3 Electricity charges breakdown
Figure 5 shows a breakdown of all the electricity charges for a 12-month period for the entire group. The values of all the underlying PODs are summed to generate the information in this figure. From this figure, it is apparent that the active energy costs are about 75 per cent of the total electricity cost. It is also interesting to note that the cost of electricity during peak hours in the high season is higher than in the low season, even though there are only three months in the high season and nine months in the low season. This indicates to the energy manager that there is still potential for cost savings by implementing load shifting initiatives, to move electricity usage out of the peak periods, especially during the winter months.
3.4 Electricity cost inflation
Figure 6 shows what effect electricity cost inflation will have on the annual electricity cost of the mining group. Using the 2016 financial year as a base, the inflation for subsequent years is calculated. For 2017, the cost inflation of 2.2 per cent is already approved. The cost inflation for the next five years is estimated by calculating the average electricity cost inflation of the last five known annual increases. In this case, this is 8.06 per cent. The figure shows that the mining group's electricity costs will increase from about R2 billion in 2016 to R3 billion in 2022. This can be used to determine electricity budgets for the future.
3.5 Time-of-use breakdown
Figure 7 shows the monthly usage time-of-use breakdown for an individual POD. As explained in section 2.3.5, the proportion of hours in a year for each time-of-use period is calculated. For the selected period in these figures (May 2016 - April 2017), the peak and standard proportions are 14.3 per cent and 36.2 per cent respectively. Using Equation 3, the proportional monthly energy (PME) for the peak and standard periods is calculated for each month, and is displayed in Figure 7. As seen in the figure, the actual peak energy usage for August, September, and October is very close to the PME, which can indicate poor performance of existing load shifting initiatives. November and February might look better compared with the peak PME, but this is marred by the high amount of total energy consumed. April is the best performing month, with low total consumption and better performance of PME. These results indicate that there is potential scope for energy cost optimisation by using less energy during peak periods.
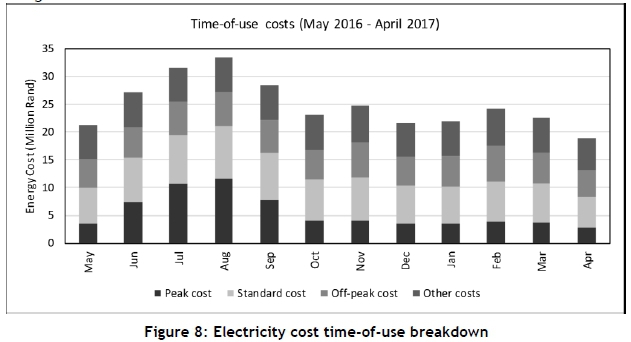
Figure 8 shows the electricity cost time-of-use breakdown for the same POD and period as in Figure 7. As expected, the peak periods in the high season months (June - August) are much more expensive and have a large effect on the total electricity costs for these months. June is lower than the other high season months, as its billing period includes days in the low season month of May. Similarly, September is higher than other low season months as its billing period includes days in the high season month of August. The cost effect of the improved time-of-use in April is also clearly visible in this figure.
3.6 Maximum demand
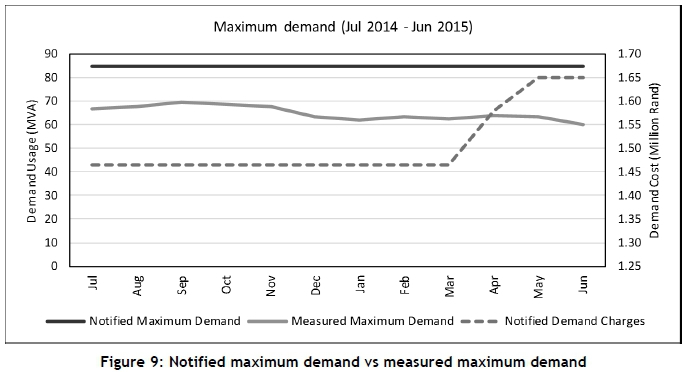
Figure 9 shows the notified maximum demand and actual maximum demand figures for a 12-month period, compared with the costs related to the notified maximum demand of an individual POD. On 1 April 2015, the electricity tariffs increased, with a concomitant increase in demand costs. For this POD, the costs in April are lower than in May, as the April billing period was from 21 March to 18 April and so was charged at two different rates. If there is a large difference between the notified and the measured maximum demand, there is potential scope to decrease costs by decreasing the notified demand. Conversely, if there is very little difference between the notified and the measured demand, this indicates that there is a risk of exceeding the notified demand and paying a penalty. This risk can then be mitigated by increasing the notified demand and/or reducing the measured maximum demand.
For the first six months, up to December 2014, the notified maximum demand for the mine was 84.66 MVA, while the average measured demand was 67.12 MVA. This means that there was a 'safety' margin of 20.7 per cent (17.54 MVA). For the last six months, from January 2015, the average measured maximum demand was 62.45 MVA, which means a margin of 26.2 per cent (22.21 MVA). If the notified maximum demand is reduced to 72 MVA (13.3 per cent margin), it will reduce the demand costs from R1.65 million in June 2015 by R246 743 per month. That is an annual cost saving of R2.96 million.
3.7 Reactive power
As mentioned in the method, consumers are only charged during peak and standard periods in the high season for reactive energy consumption. Figure 10 shows the average power factor per time-of-use period of an individual POD. The average costs of R132 687 (blue line), charged during the high-season months (June - August), are also displayed on the secondary axis. The dramatic decline in the average power factor from February is important to note in this example. This large decline will have an adverse effect on the reactive energy charges in the upcoming high season starting in June 2017.
3.8 Discussion
As seen from the results, various insights can be gained by analysing data gathered from electricity bills. Automated electricity bill analysis can easily be used as a tool to increase cost awareness. The consumers can see how their actions and decisions impact the consumption and costs involved, not only for a specific POD, but also for the entire company. Furthermore, automation can help minimise typical inaccuracies found in manual processes. However, automated bill analysis is only likely to be beneficial once there are multiple PODs and the analysis becomes more complex. As the number of PODs increases, the value of automated bill analysis also increases, due to the time that would be required to analyse the bills manually.
A few recommendations can be made about the analysis and presentation of data. The electricity cost inflation analysis can be adapted to use data from the previous 12 months, instead of the previous financial year. This way, the inflation risk will update every month as new electricity bills are processed. For the time-of-use analysis, the exact number of hours for each time-of-use period in a month should be used to calculate the monthly proportional energy, which will improve the accuracy of this analysis. Finally, an estimated cost risk for reactive power can be calculated and presented, based on the average power factor.
4 CONCLUSION
Increasing electricity prices puts a lot of strain on the profitability of industries in South Africa. This makes effective energy management vital for the survival of these industries. Although detailed energy measurements are ideal for energy management, a lot of information that is available in monthly electricity bills is also valuable for energy management. Some companies have large numbers of points-of-delivery, which makes it difficult to analyse all the data in the electricity bills. A need was therefore identified for an automated system that analyses electricity bills on a monthly basis.
A method was developed for an automated system to collect the electricity bills from the electricity utility company for various consumers. The data from these electricity bills was extracted using regular expression patterns. The data was then organised to enable the users of this system to extract valuable insights from the information provided, at various levels of the organisation. This is especially valuable for companies with numerous points-of-delivery. Analyses are done on various types of data found in an electricity bill, including total cost and usage, reactive energy, maximum demand, and time-of-use.
The system was implemented for a gold mining group with 45 different points-of-delivery. From the resulting data, various insights were gained. For example, the company's risk due to further electricity cost inflation is roughly R1 billion in 2022. A specific mine shaft can reduce the cost of notified maximum demand by as much as R2.96 million per year. The same shaft is also at risk of an increase in reactive energy charges in the high season, due to a dramatic decline in the power factor.
ACKNOWLEDGEMENT
This work was sponsored by ETA-operations.
REFERENCES
[1] Goosen, P., Swanepoel, J.A. and du Plessis, J.N. 2016. The need for a comprehensive energy management information system for industries, South African J. Ind. Eng., 27(3), pp. 1-11. [ Links ]
[2] Van der Zee, L.F. , Pelzer, R. and Bolt, G. 2014. Quantification of optimal electricity cost risk reduction for a South African gold mining company, in Proceedings of the Conference on the Industrial and Commercial Use of Energy, ICUE, pp. 1-9. [ Links ]
[3] Goosen, P., Pelzer, R. and du Plessis, H.J. 2015. A method for accurate electricity budget cost calculations for a deep mine, in Proceedings of the Conference on the Industrial and Commercial Use of Energy, ICUE, pp. 155-160. [ Links ]
[4] Bredenkamp, J.I.G., Schutte, A.J. and van Rensburg, J.F. 2015. Challenges faced during implementation of a compressed air energy savings project on a gold mine, in Proceedings of the Conference on the Industrial and Commercial Use of Energy, ICUE, pp. 23-29. [ Links ]
[5] Engles, J., van Jaarsveld, S. and van Heerden, S.W. 2016. Cost effective control of a platinum mine cooling system using combined DSM strategies, in Proceedings of the Conference on the Industrial and Commercial Use of Energy, ICUE, pp. 128-132. [ Links ]
[6] Deysel, J.A., Kleingeld, M. and Kriel, C.J.R. 2015. DSM strategies to reduce electricity costs on platinum mines, in Proceedings of the Conference on the Industrial and Commercial Use of Energy, ICUE, pp. 8996. [ Links ]
[7] Moran, A., Fuertes, J.J., Domínguez, M., Prada, M.A., Alonso, S. and Barrientos, P. 2013. Analysis of electricity bills using visual continuous maps, Neural Comput. Appl., 23(3-4), pp. 645-655. [ Links ]
[8] Darby, S. 2000. Making it obvious: Designing feedback into energy consumption, in Energy Efficiency in Household Appliances and Lighting, pp. 685-696. [ Links ]
* Corresponding author: pgoosen@researchtoolbox.com

