


Services on Demand
Article
 English (pdf)
 Article in xml format
 Article references
Indicators

Related links
-
 Cited by Google
 -
 Similars in Google
Share

 Permalink
South African Journal of Industrial Engineering
On-line version ISSN 2224-7890
Print version ISSN 1012-277X
S. Afr. J. Ind. Eng. vol.28 n.3 Pretoria 2017
http://dx.doi.org/10.7166/28-3-1836
GENERAL ARTICLES
Evaluating the feasibility of the 12L tax incentive for energy-intensive industries
K. Campbell*,# ; W. Booysen†; J.C. Vosloo
Centre for Research and Continued Engineering Development (CRCED), North-West University, Pretoria
ABSTRACT
Section 12L of the South African Income Tax Act (12L) aims to incentivse businesses to become more energy-efficient. However, claiming this benefit is a complex process that can become difficult, time-consuming, and costly if not clearly understood. It is therefore important to evaluate the feasibility of potential 12L applications before any unnecessary expenses are incurred or time is wasted. This article provides a brief overview of 12L and its associated literature before presenting a simplified feasibility evaluation strategy. The strategy consists of three key evaluation steps designed to identify potential issues quickly. The identified issues are linked to specific South African National Standards (SANS) guidelines to ensure that the issues can be resolved in a 12L-compliant manner. The strategy is applied to 47 industrial case studies. Some detailed results are presented to give a practical illustration of how the strategy works. The generalised results are further used to illustrate the potential benefit in time and cost reduction.
OPSOMMING
Artikel 12L van die Suid-Afrikaanse Inkomstebelastingwet (12L) beoog om besighede te stimuleer om meer energie-doeltreffend te word. Om hierdie voordeel te eis is egter 'n komplekse proses wat moeilik, tydrowend en duur kan word indien dit nie duidelik verstaan word nie. Dit is dus belangrik om die haalbaarheid van potensiële 12L-aansoeke te evalueer voordat enige onnodige uitgawes aangegaan word of tyd vermors word. Hierdie artikel bied 'n kort oorsig van 12L en die relevante literatuur, sodat 'n vereenvoudigde haalbaarheidsevalueringstrategie ontwikkel kan word. Die strategie bestaan uit drie sleutel evalueringstappe wat ontwerp is om vinnig moontlike kwessies te identifiseer. Die geïdentifiseerde kwessies word gekoppel aan spesifieke Suid-Afrikaanse Nasionale Standaarde (SANS) riglyne om te verseker dat die probleme op 'n 12L-voldoenbare wyse opgelos kan word. Die strategie word toegepas op 47 gevallestudies in industrie. 'n Paar gedetailleerde resultate word aangebied om 'n praktiese illustrasie te gee van hoe die strategie werk. Die algemene resultate word verder gebruik om die potensiële voordeel in tyd- en kostebesparing te illustreer.
1 INTRODUCTION
South Africa is an energy-intensive country due to various mining and industrial activities [1]. In recent years, Eskom has struggled to keep up with constantly increasing energy demand. Mining and other large industries use about 45 per cent of the total national energy consumed within South Africa [2]. Ever since the country's energy supply became a concern, the government committed itself to promoting energy efficiency (EE), and so introduced the 12L tax incentive [3] [4].
The incentive aims to motivate companies to reduce their energy use and become more energy-efficient. The process of applying for such a tax deduction can, however, be very challenging [5] [6] (Steyn, M&V Standard for 12L tax incentives 2014). Strict rules must be adhered to when applying for the 12L deduction, as described in the National Tax Act [8], the Regulations [9], and the Standard [10]. Most importantly, the EE savings must be verified and the data must be traceable, accurate, and transparent.
This verification needs to be done by an independent SANAS (South African National Accreditation System) accredited measurement and verification (M&V) body, which can incur a significant financial expense [11]. There are only nine of these SANAS accredited M&V bodies in South Africa, making this a limiting factor [12]. Having only nine specialised bodies increases the potential costs of the application process.
Time is also a potential constraint when considering 12L. A company that demonstrates EE savings must complete its entire application within a certain timeframe - i.e., before the tax submission date. Another time restriction is that this incentive is only valid until 1 January 2020; in other words, there are only two full claimable years left. Therefore, no time should be wasted when applying for the deduction, meaning that the process needs to be completed as quickly and effectively as possible.
There is a need for a practical approach to evaluate the feasibility of potential 12L applications quickly, before an M&V body is officially involved. This will address the cost and time constraints by only submitting viable applications to the official process. However, it is also necessary to present solutions for applications that were deemed non-feasible. This work is based on a Masters dissertation submitted in 2017 [13].
2 LITERATURE REVIEW
2.1 Feasibility studies
Feasibility studies are usually performed when it is necessary to determine the viability of an idea for a new business opportunity [14] [15] [16] [17]. The main reason for such a study is to decide whether a certain project idea should be further investigated in more detail [18] [19]. When this is applied to the feasibility of the 12L tax incentive, the important question to ask is: will it be worthwhile to further investigate an opportunity for 12L? A generic list of steps on how to do a feasibility study is constructed after the necessary research has been done [14] [16] [17] [20] [21] [22]. These steps are listed below:
-
Define the opportunity
-
Determine the requirements
-
Identify any competition
-
Conduct an assessment
-
Ask: Is there a financial benefit?
-
Ask: Is there sufficient technology?
-
Identify possible risks
-
Address risks identified with possible solutions
These steps will be used to develop an in-detail strategy for evaluating the feasibility of the 12L tax incentive for energy-intensive industries.
2.2 Section 12L tax incentive
The South African National Energy Development Institute (SANEDI) has been selected as the Section 12L official. They have the responsibility of appointing suitably qualified persons to ensure that an EE savings report [9]:
-
complies with the Section 12L Regulation,
-
complies with the SANS 50010 M&V Standard, and
-
is an accurate and conservative reflection of the actual EE savings.
If, and when, SANEDI is fully satisfied that all requirements are met, they must issue a certificate to the entity claiming the allowance.
2.2.1 Quantification of 12L potential
Energy savings must be calculated by comparing the measured use of energy before and after the implementation of a certain energy savings measure. The savings must also be determined by making suitable adjustments to account for possible changes in the relevant conditions [10].
According to the SANS 50010 [10], energy savings can be calculated by comparing the measured energy use before and after an energy savings intervention. This is done with the following equation:

The figure below provides a visual representation to explain what is meant by the terms savings (Es), baseline (Ebl), assessment (Eap), and adjustments (Eadj) [10].
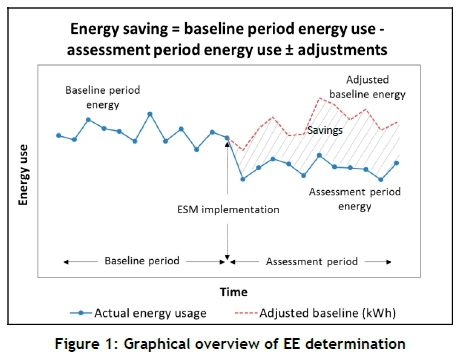
where EBL= baseline energy consumption, PBL= baseline production, PAP= assessment production, EAP= actual assessment energy consumption. If Esavings are negative, it means that there have been no significant EE improvements. However, a positive Esavingsvalue indicates 12L potential.
b) Regression model calculations
This calculation is recommended for a more accurate result, especially if higher data resolution is available. In order to calculate EE savings through the regression model, the following steps are required:
The energy savings of a certain entity can be determined by comparing the energy used before and after implementation. This can be done using different methods when making adjustments for process changes. This section will focus on two specific EE savings calculation methods: a) energy intensity calculations, and b) regression models [23].
a) Intensity calculations
An energy intensity calculation is a simple way of calculating the energy savings, and is suitable for data with a low resolution (fewer data points). This is simply done by using the next three equations: annual energy intensity (Equation 2), adjusted BL energy consumption (Equation 3), and annual energy savings (Equation 4):


-
Define the baseline model
-
Determine the predicted energy usage
-
Calculate the energy savings for each data point
-
Calculate the total annual energy savings
Defining the baseline model includes plotting the baseline values on a graph (energy driver, e.g. production = x-values; energy carriers, e.g. electricity consumption = y-values). A linear regression line is then drawn through the data points, according to Equation 5:

where y represents the predicted energy consumption at a certain data point, while x symbolises the energy driver. The slope of the regression line is indicated by m, while c is the intercept of the line.
Calculating the energy savings for each data point is done by simply subtracting the actual energy consumption from the predicted energy consumption (as described by Equation 4) for every data point.
2.2.2 Summary of 12L requirements
From the necessary research conducted, it can be concluded that, when applying for the 12L tax allowance, many rules and requirements need to be adhered to. Essentially, data is one of the most important aspects of the 12L requirements:
-
Data requirements: the BL and AP energy data needs to be accurate.
-
Calculating EE savings: accurate data is necessary to construct the correct baseline model, which is then used to calculate the energy savings.
-
Limitations and concurrent benefits: sufficient data management is needed in order to identify, and quantify, any limitations or concurrent benefits that may apply.
Thus, the quality of data is an important factor when claiming the 12L tax allowance. The next section will focus on the management of data and data quality in general.
2.3 Quality management systems (QMSs)
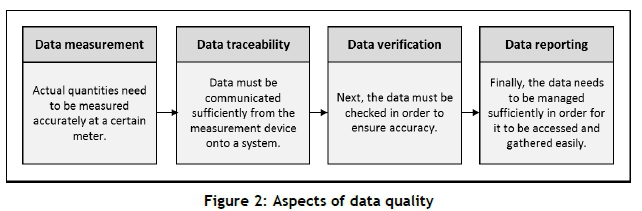
Having an accurate and transparent 12L application primarily depends on the data quality for the specific site. The manner in which the data is measured, processed, verified, and managed is significant for data quality. Below is a flow diagram (Figure 2) that has been created in order to illustrate the aspects of data quality.
Based on the flow diagram, it is clear that there are several areas where data related issues may arise during a 12L investigation. These four aspects have been investigated, and will be addressed on the basis of various national and international standards.
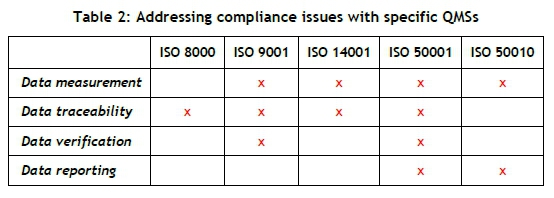
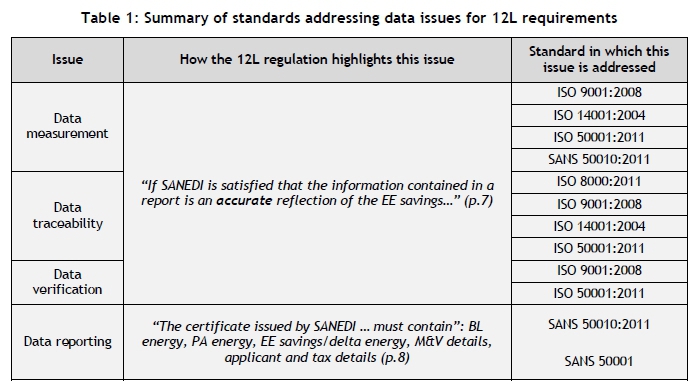
The following table summarises some standards that can be used to address various 12L data-related issues [10] [24] [25] [26] [27].
It is clear from this table that various standards are available to address the four main data issues for the 12L requirements.
2.4 Summary of literature review
Information about the feasibility studies was collected and summarised. The summary provided a general method for how feasibility studies are usually approached, based on the previous studies. After a literature study had been performed (regarding Regulations of 12L and Quality management systems), it was found that this general method could be applied specifically to 12L. This method for a generic feasibility study is applied to a 12L investigation, and is outlined below:
-
Define opportunity: Opportunity to claim 12L
-
Determine requirements: EE savings, as well as accurate and reliable data, are compulsory
-
Identify competition: Competition includes limitations and concurrent benefits (e.g., 12I, PPA)
-
Conduct an assessment: Calculate preliminary EE savings
-
Is there a financial benefit? Financial benefit due to savings?
-
Is there sufficient technology? Sufficient data basis technology or data management system to deliver reliable data? Data management?
-
Identify possible risks: Having no savings or unreliable or inaccurate data are both potential risks
-
Address risks identified with possible solution: Implementation of a quality management system
This method will be used to develop a strategy for evaluating the feasibility of the 12L tax incentive for energy-intensive industries. The final strategy will be used throughout the rest of this study.
3 METHODOLOGY
The methodology is divided into three divisions or main phases: quantifying EE savings; evaluating data compliance; and addressing potential compliance issues. An overview of this strategy is presented in Figure 3 (below).
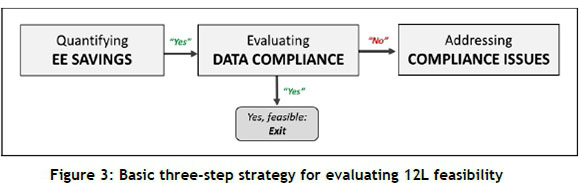
This strategy will provide the 12L applicant with a holistic approach to conducting an initial internal investigation before any unnecessary expense or time is wasted. This strategy can therefore serve as a practical application to investigate the possibility of claiming the 12L tax incentive. Each step will now be discussed in more detail.
3.1.1 PHASE 1: Quantifying EE savings
Phase 1 of the strategy presents the steps required to quantify the preliminary EE savings; this is presented in Figure 4.
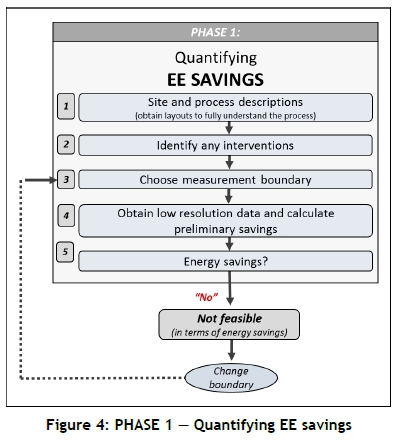
If there is a potential for a 12L claim (recommended as 1 GWh [28]), the applicant may proceed to the next phase (evaluating data compliance). If sufficient savings do not show, other boundary options can be evaluated. The investigation may be terminated if no potential is found.
3.1.2 PHASE 2: Evaluating data compliance
Having an accurate and transparent 12L application is essential. It is important that all the data used to calculate the EE savings for the 12L application accurately reflects the truth. The manner in which the data is measured, processed, used, and verified are all key factors to consider when evaluating data compliance. Phase 2 of the strategy is presented in Figure 5.
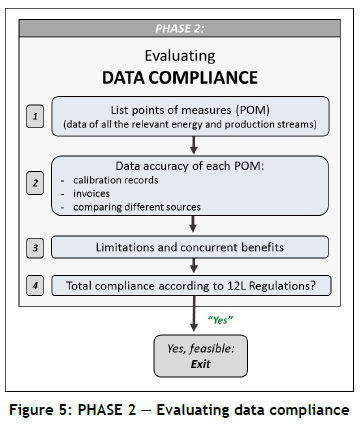
If thorough compliance cannot be proven, the applicant must proceed to Phase 3 (addressing compliance issues). It is assumed that non-compliance is generally due to inaccurate, unverified data, or the presence of a limitation or concurrent benefit.
3.1.3 PHASE 3: Addressing compliance issues
This section will provide ways to address the lack of data compliance. The suggested improvements are done on the basis of quality management systems (QMSs), as discussed in Section 2.3. The basic process of addressing potential problems is provided in Figure 6.
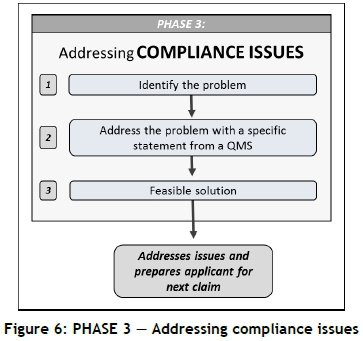
The last step of Phase 3 can be done using a condensed version of Table 1 (presented in Table 2). This table provides a quick and effective way to identify certain international standards that would address one of the issues regarding data compliance.
The final step of the strategy ensures that the identified issues are addressed, and that a feasible solution will eventually be achieved. This will prevent the issues from developing again in the future and will, therefore, prepare the applicant for the next claim.
3.1.4 FINAL STRATEGY
The three phases can be combined to present the final strategy (presented in Figure 7).
This strategy provides a way to simplify the process of a 12L feasibility investigation. It can provide the 12L applicant with practical guidelines to quantify potential, evaluate compliance, and address identified problems.
4 RESULTS
4.1 Case study
The final strategy is applied to various case studies, and is used to highlight specific scenarios or outcomes of the method. This case study represents the investigation for 12l feasibility in an underground gold mine. The investigation was done by implementing the strategy.
4.1.1 PHASE 1: Calculating EE savings
Electricity is the sole energy source used in underground mining. It is used by various sub-systems within the mine, such as fans, pumps, and other electricity-dependent systems within the shafts. Once the basic process is understood, interventions or energy savings measures must be identified, so that it is clear where the EE savings will occur.
It is known that several energy savings measures were implemented on the compressed air subsystems. Due to these measures, the initial measurement boundary will isolate the compressed air system. This is shown below in Figure 8.
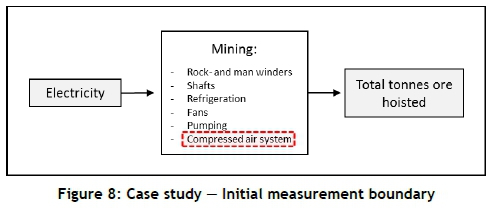
The next step requires low-resolution data for this specific boundary. The data obtained included monthly resolution electricity data as well as the total mass of ore hoisted from the mine. This is done in order to develop a baseline model that will be used to calculate the preliminary EE savings.
The preliminary EE savings can now be determined using two different calculation methods - i.e., an intensity calculation and a regression model. Figure 9 shows the monthly energy intensity of the gold mine's compressed air sub-system in kWh per tonne of ore hoisted.
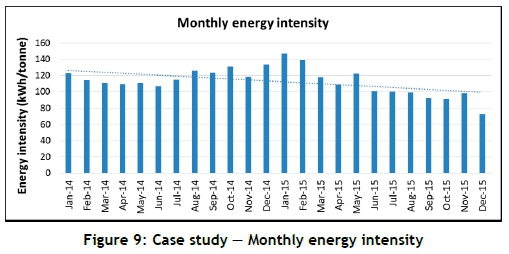
Improved energy efficiency can be observed from the baseline to the assessment year. Thus savings were achieved. The calculations are based on Equations 2, 3, 4; a summary is provided in Table 3.
The intensity analysis showed an EE saving of 40.9 GWh. A regression model analysis will also be used to calculate EE savings, and is defined in Figure 10.
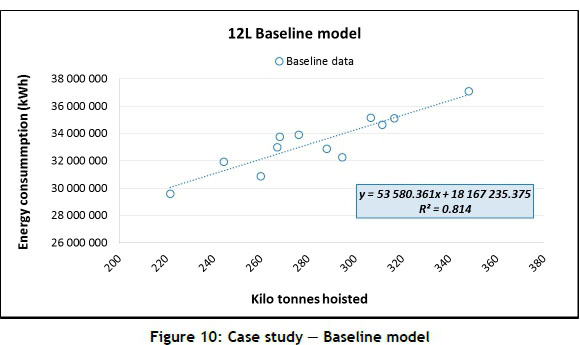
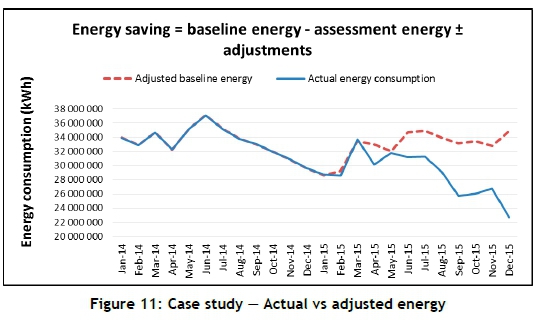
The statistical parameters (m and c) of the linear regression line are used to determine the predicted energy. This predicted, or adjusted, energy is plotted together with the actual energy in the figure below (Figure 11). This shows what the energy consumption would have been (red dashed line) if the system still operated under the same conditions as in the baseline period.
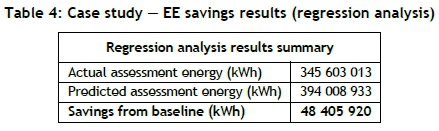
By using Equations 1 and 5, the regression analysis yielded positive EE savings. The results are summarised in Table 4.
A visual representation of the results is given in Figure 12, where the EE savings results obtained through intensity and regression calculations are compared.
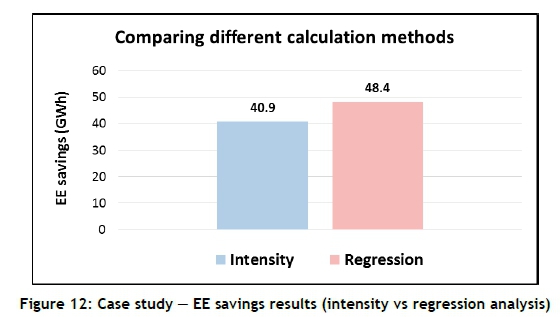
Since the EE savings are significant regardless of the method used (intensity = 40.9 GWh; regression = 48.4 GWh), the next phase may begin - i.e., evaluating compliance. This will be discussed in the next section.
4.1.2 PHASE 2: Evaluating compliance
Having an accurate and transparent 12L application is crucial. In order to confirm that the data (used to construct the baseline and assessment data sets) is in fact accurate, it must be critically assessed to ensure compliance with the SANS 50010 Standard and 12L Regulations.
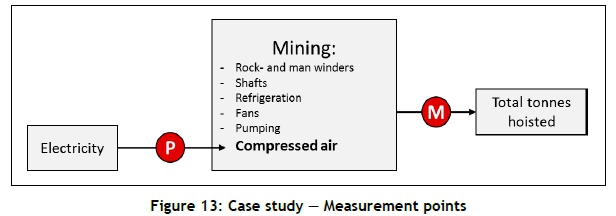
The first step is to list all the energy streams and drivers entering and exiting the measurement boundary, together with their corresponding POM. Figure 13 provides a diagram of the POM within the chosen boundary (note the red meters, which indicate a lack of compliance).
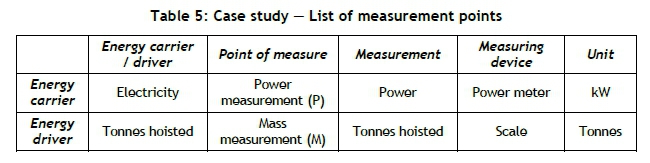
The list of energy carriers and drivers, together with their corresponding POM, includes the following (Table 5):
The compliance of the data of each POM must be evaluated by proving the accuracy of the data. This can be done through calibration records, invoices, or other certified reports or documentation. Unfortunately no calibrations, invoices, or other forms of proof for any of the data sets could be obtained; thus no 12L compliance could be proven. It was therefore necessary to proceed to the next phase, addressing compliance issues.
(However, if full 12L compliance could have been proven, and no concurrent benefits or limitations were applicable, the 12L potential on this specific energy-intensive industry would indeed have been feasible. The first and second steps (determining EE savings; evaluating data compliance) of the strategy could then have been completed, due to significant savings as well as compliant data.)
4.1.3 PHASE 3: Addressing compliance issues
The lack of data compliance during a 12L analysis may be one of the reasons for unsuccessful investigations. In the event of having issues with compliance, the 12L applicant must proceed to the next phase - addressing compliance issues. This step will aim to address the specific compliance issues using a quality management system.
In this case study, no 12L compliance could be proven, as no form of proof (the red meters in the process layout in Figure 13) for any of the data sets or data meters could be obtained. The quality of the measurement of the data is therefore considered untrustworthy. The issues of data measurement must therefore be addressed.
The involved meters or sensors should not only give accurate measurements: the data itself must be a true reflection of reality. Since the data sets of this case study could not be sufficiently verified to ensure the accuracy of the data, the issue of data verification must be addressed.
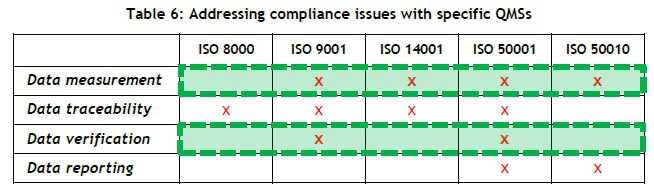
Several international standards or ISOs (International Organization for Standardization) address the issue of data measurement and verification. Table 6 (repeat of Table 2, with additional highlighted areas) indicates which QMSs are applicable to the specific issues identified.
ISOs 9001, 14001, 50001 and 50010 are all applicable when addressing the specific compliance issues. The first, second, and third steps (determining EE savings; evaluating data compliance; addressing compliance issues) of the strategy could be implemented during the investigation of this case study, due to significant savings but non-compliant data.
4.2 Estimated benefit from additional case studies
As demonstrated in the case study, implementing the proposed strategy would provide the 12L applicant with the necessary guidelines for a practical application to evaluate the 12L feasibility of an energy-intensive industry.
An additional 47 cases were also investigated. Of the 47 investigations, 26 were successful in achieving EE savings. This translates to about 55 per cent of the evaluated industries managing to achieve EE savings. However, only four of the 26 successful investigations showing EE savings had data that complied with the 12L Regulations and Standard. This means that (in this case) more than 80 per cent of the energy-intensive industries did not have sufficient data management strategies in place.
Generic equations were developed to quantify the estimated benefit of using the proposed strategy. The cost benefit (Equation 6) and time benefit (Equation 7 and 8) can be aggregated to quantify the total financial benefit of implementing this strategy (assuming that it takes about 40 man-hours to complete a simple feasibility study, and 160 man-hours for a detailed investigation and for submitting the application to M&V and SANEDI):
Cost benefit (R):

Time benefit (hours):

Time benefit (R):
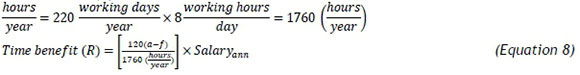
where a = number of total investigations, f = number of feasible investigations, s = number of feasible investigations that comply with 12L Regulations, M&V cost = average cost of M&V (assumed to be R100 000 - R1 000 000 [29]), and Salaryann = average annual engineering salary (assumed to be R500 000 [30]).
By implementing the strategy and applying these formulas to the 47 additional case studies, it would appear that a cost and time benefit exceeding R2 200 000 and 5 160 man-hours respectively could have been obtained.
5 CONCLUSION
This study introduced a new strategy that could be followed throughout the process of investigating the feasibility of claiming the 12L tax incentive. This strategy would provide the 12L applicant with a holistic approach to conducting an initial internal investigation, before any unnecessary expense or time was wasted, when applying for the 12L tax incentive.
The results revealed that, by implementing the proposed strategy, the complexity of the 12L investigation decreases significantly. The results were then validated by quantifying the cost and time benefits of implementing the strategy, and resulted in significant savings.
REFERENCES
[1] Davidson, O., Winkler, H., Kenny, A., Prasad, G., Nkomo, J., Sparks, D., Howells, M. & Alfstad, T. 2006. Energy policies for sustainable development in South Africa. Cape Town: Energy Research Centre, University of Cape Town. [ Links ]
[2] Republic of South Africa. 2013. Integrated planning report. Pretoria: Department of Energy. [ Links ]
[3] Republic of South Africa. 2015. 12L Regulations in relation to the National Energy Efficiency Strategy. Pretoria: Department of Energy. [ Links ]
[4] Manuel, T.A. 2009. Republic of South Africa budget speech. Pretoria: FormeSet Printers Cape (Pty) Ltd. [ Links ]
[5] Du Toit, E.F. 2011. Energy efficiency savings allowance in South Africa: An international comparison. Pretoria: University of Pretoria. [ Links ]
[6] Steyn, K. 2015. EE Publishers - Section 12L tax allowance: Why the delay? http://www.ee.co.za/article/section-12l-tax-allowance-delay.html [accessed 25/08/16]. [ Links ]
[7] Steyn, K. 2014. M&V Standard for 12L tax incentives. Pretoria: SABS. [ Links ]
[8] Republic of South Africa. 2012. Taxation Laws Amendment Act. Pretoria: Government Gazette No. 36122. [ Links ]
[9] National Treasury. 2013. Regulations in terms of section 12L of the Income Tax Act, 1962, on the allowance for energy efficiency savings. Pretoria: Government Gazette No. 37136. [ Links ]
[10] South African National Standard. 2011. SANS 50010:2011 Measurement and verification of energy savings. Pretoria: SABS Standards Division. [ Links ]
[11] GreenCape. 2015. 12L income tax allowance on energy efficiency savings. Cape Town: GreenCape. [ Links ]
[12] SANAS. 2015. South African National Accreditation System. http://home.sanas.co.za/?page_id=38 [accessed 13/10/16]. [ Links ]
[13] Campbell, K. 2017. Evaluating the feasibility of the 12L tax incentive for energy intensive industries. Potchefstroom: North-West University. [ Links ]
[14] IIBA. 2006. A guide to business analysis body of knowledge (BABOK), version 1.6. Toronto: International Institute of Business Analysis. [ Links ]
[15] Davis, B., Lockwood, A., Alcott, P. & Pantelidis, I. 2012. Food and beverage management. New York: Routledge Taylor & Francis Group. [ Links ]
[16] Campbell, G.M. & Baker, S. 2010. Project goals for project managers. Indianapolis: Alpha Books. [ Links ]
[17] Schiefer, U. & Döbel, R. 2001. Mapa-project: A practical guide to integrated project planning and evaluation. Budapest: Open Society Institute. [ Links ]
[18] El-Sharkawy, A. 2005. Economic feasibility studies. Cairo: Center for Advancement of Postgraduate Studies and Research in Engineering Sciences (CAPSCU), Faculty of Engineering, Cairo University. [ Links ]
[19] Nykiel, R.A. 2007. Handbook of marketing research methodologies for hospitality and tourism. Binghamton, NY: Haworth Press, Inc. [ Links ]
[20] Bridgewater Management Consulting Group. 2014. Guide to preparing a feasibility study. Thimblesofplenty. [ Links ]
[21] Department of Information Resources. 1992. How to conduct a feasibility study. Austin: DIANE Publishing Company. [ Links ]
[22] Panneerselvam, R. & Senthilkumar, P. 2009. Project management. New Delhi: PHI Learning Private Ltd. [ Links ]
[23] IPMVP. 2009. International performance measurement & verification protocol. Springfield: US Department of Energy. [ Links ]
[24] International Standard. 2008. ISO 9001: Quality management systems. Switzerland: ISO. [ Links ]
[25] International Standard. 2004. ISO 14001: Environmental management systems. Switzerland: ISO. [ Links ]
[26] International Standard. 2011. ISO 50001: Energy management systems. Switzerland: ISO. [ Links ]
[27] International Organization for Standardization. ISO 8000. http://www.iso.org/iso/home/search.htm?qt=8000&sort=rel&type=simple&published=on [accessed 18/05/16]. [ Links ]
[28] Green times. 2013. Claiming energy efficiency tax incentives. http://thegreentimes.co.za/claiming-energy-efficiency-tax-incentives/ [accessed 25/08/16]. [ Links ]
[29] Department of Energy. 2016. Draft post-2015 national energy efficiency strategy. Government Gazette No. 40515, Pretoria. [ Links ]
[30] Mybroadband. 2016. Engineering salaries in South Africa. http://mybroadband.co.za/news/business/160658-2016-engineering-salaries-in-south-africa.html [accessed 13/10/16]. [ Links ]
* Corresponding author: kristy.campbell9@gmail.com
# Author was enrolled for a PhD degree in the Department of Mechanical and Nuclear Engineering at the North-West University's Centre for Research and Continued Engineering Development (CRCED) in Pretoria
† Author was a post-doctoral student at the North-West University's Centre for Research and Continued Engineering Development (CRCED) in Pretoria

