


Servicios Personalizados
Articulo
 Inglés (pdf)
 Articulo en XML
 Referencias del artículo
Indicadores

Links relacionados
-
 Citado por Google
 -
 Similares en Google
Compartir

 Permalink
South African Journal of Industrial Engineering
versión On-line ISSN 2224-7890
versión impresa ISSN 1012-277X
S. Afr. J. Ind. Eng. vol.28 no.3 Pretoria 2017
http://dx.doi.org/10.7166/28-3-1835
GENERAL ARTICLES
The current and future energy economics of concentrating solar power (CSP) in South Africa
O.O. CraigI, *, #; A.C. BrentII; F. DinterIII
IDepartment of Industrial Engineering and The Centre for Renewable and Sustainable Energy Studies (CRSES), Stellenbosch University, South Africa
IIDepartment of Industrial Engineering, Stellenbosch University, South Africa and Sustainable Energy Systems, Engineering and Computer Science, Victoria University of Wellington, New Zealand
IIIDepartment of Mechanical Engineering and The Solar Thermal Energy Research Group (STERG), Stellenbosch University, South Africa
ABSTRACT
For South Africa, an increase in energy demand is associated with higher CO2 emissions. In order to overcome this challenge, the government started the Renewable Energy Independent Power Producer Procurement Programme (REI4P) to allow easy integration of renewable energy technologies into the existing energy mix. The country has an abundant solar resource, and the potential to harvest this resource through concentrating solar power (CSP) has been proven. 600 MW of CSP have been bought in the REI4P, but the future of CSP in SA looks bleak, as the government's recent Integrated Resource Plan (IRP) updates gave no allocation to new CSP plants beyond 2030. Very few CSP plants are connected to the grid, and there is limited research and literature on its learning effect and economics of scale. This study analyses the state of CSP and uses a mathematical relationship to determine the progress ratio, the learning effect, and the likely future of CSP in South Africa. The results address the difficulties involved in determining the learning effect of CSP.
OPSOMMING
Vir Suid-Afrika word 'n toename in die vraag na energie geassosieer met hoër CO2-uitlate. Om hierdie uitdaging te oorkom, het die regering die Renewable Energy Independent Power Produsent Procurement Program (REI4P) begin om maklike integrasie van hernubare energie tegnologieë in die bestaande energiemengsel moontlik te maak. Die land het 'n oorvloed in sonkrag, en die potensiaal om hierdie hulpbron te benut deur konsentrasie van sonkrag (CSP) is alreeds bewys. 600 MW CSP is in met die REI4P gekoop, maar die toekoms van CSP in SA lyk bleek, aangesien die regering se onlangse opdaterings van die Geïntegreerde Hulpbronplan (IRP) geen toewysing na 2030 aan nuwe CSP-aanlegte gedoen het nie. Baie min CSP-aanlegte is verbind met die netwerk, en daar is beperkte navorsing en literatuur oor sy leer-effek en skaalbesparing. Hierdie studie analiseer die stand van CSP en gebruik 'n wiskundige verhouding om die vorderingsverhouding, die leer effek, en die waarskynlike toekoms van CSP in Suid-Afrika te bepaal. Die resultate spreek die probleme aan in de bepaling van die leer-effek van CSP.
1 INTRODUCTION
The continuous increase in the demand for electricity and the desire to transition to a green economy has encouraged most nations to target the improvement of renewable energy generation. The measure of the environmental capability of a nation in the last decade has been based on its renewable energy and energy efficiency [1]. This is because the energy security of a nation is guaranteed when there is a well-balanced mix of the various types of renewable energy technologies, including wind, solar, geothermal, and biomass [2].
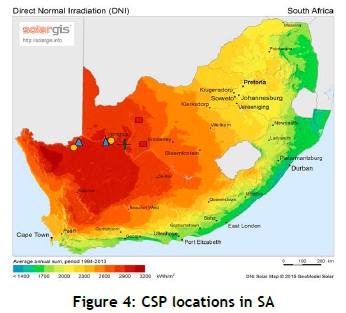
The annual solar irradiation received by South Africa (SA) is one of the highest in the world, making solar energy a realistic technology in the generation of clean energy, complementing the existing grid, and reducing carbon emissions [3]. There are two ways in which solar energy technologies have been deployed to generate electricity: solar photovoltaic (PV) technologies, and concentrating solar power (CSP) technologies [4]. SA has been identified as one of the best locations in the world for CSP technologies, especially in the Northern Cape Province of the country, where the annual direct normal irradiance (DNI) received varies between 2800 to 3000 kWh/m2/year [5]-[8].
In order to achieve its year 2030 goal of 43 per cent supply from renewable energy, the SA Department of Energy (DOE) rolled out sets of bids to regularise the RET cost [9], [10]. The sets of windows 1, 2, 3, 3.5, and 4 have proven the economic viability of CSP, as they generated an investment capital of up to ZAR 53 billion [11]. During the fifth bid windows, 600 MW of CSP was bought, and 200 MW is already connected to the grid, while the remaining 400 MW plants are either under construction or in development [12]. The cost of CSP electricity at the first bid window was relatively lower than that of PV, but it is of interest to note that, as the bid windows progressed, PV and other RETs experienced drastic reductions in their costs, while the cost of electricity from CSP remained fairly expensive [10], [11], [13].
Despite the challenges of a high tariff and relatively low adoption, CSP offers some unique advantages over many other RETs. For example, CSP can store its energy; the technology is therefore dispatchable and so offers flexibility in energy distribution. The CSP power block also uses the existing principles of power generation, and can use existing conventional power generation facilities; it can therefore easily be incorporated into existing plant designs to form hybrid systems [14]. It is important, therefore, to analyse the present and the future cost of CSP based on the existing data in SA. This can be used to develop strategies to maximise the available solar resources to meet South Africa's future energy demand.
This paper uses the existing limited data on CSP in SA to analyse the present and future costs of various capital subsystems of the CSP technology; develops a learning effect; and describes the current and future economics of CSP in SA.
1.1 Objectives of this paper
This paper seeks to analyse the present state of CSP cost evaluation parameters and the capital expenditure (CAPEX) of CSP, in order to present the learning rate/experience rate of CSP in SA. It also seeks to analyse data retrieved from reputable sources to determine the trend and the future cost of CSP in SA. The paper thus answers the following questions:
1. What is the current state of CSP in SA?
2. What are the existing economic indicators for CSP viability in SA?
3. What are the present and future costs of CSP subsystems?
4. What is the CSP learning rate in terms of competitiveness in SA?
5. What is the way forward?
1.2 Paper outline
The main barriers faced by CSP are no different from the general ones faced by most RETs. These include: efficiency, finance, breaking the carbon lock-in effect, and adoption and deployment.
The study presented in this paper analyses the state of CSP in SA for the levelised cost of electricity (LCOE) and the future cost of systems. The study presents a deployment strategy for market adoption of CSP in SA. The first part of the study shows the cost of electricity in SA and presents the need for more RET deployment, while the second part shows the future cost of CSP plant development in SA based on global forecasts and roadmaps.
The data and method used in this study are based on the analysis of existing reports on CSP in SA by various reputable organisations and research centres. Some of the studies reviewed in this paper include local and international reports ([10], [11], [13], [15]-[28]), academic publications, Eskom publications, SA DOE reports, World Wide Fund for Nature (WWF) 2015 reports, South Africa Renewable Energy Conference (SAIREC) 2015 reports, studies done at Solar Thermal Energy Research Group (STERG), Southern Africa Solar Energy Conference (SASEC) publications, European Solar Thermal Electricity Association (ESTELA) Outlook, the World Energy Outlook, and the Energy Technology Perspective (ETP) blue map.
2 STATE OF CSP
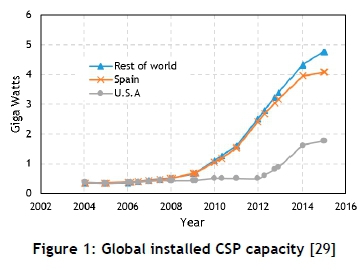
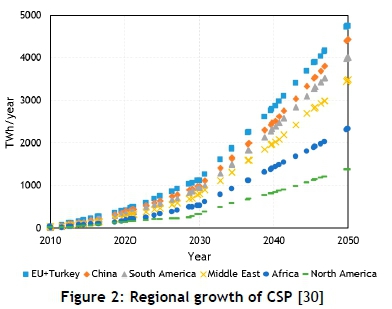
CSP is a type of solar technology that relies only on direct radiation from the sun, which is the direct normal irradiance (DNI). The global capacity of the technology stood at 4.8 GW at the end of 2015, as shown in Figure 1, while the regional growth and future projections of CSP based on regional analysis are presented in Figure 2.
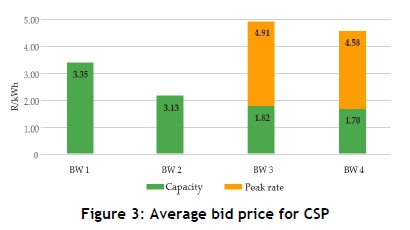
There are seven CSP plants with a total capacity of 600 MW in SA, in various phases of construction, commissioning, and operation. When all the plants are operational, they are expected to prevent carbon emissions of about 1.5 million tonnes per year, while their average payback period is 20 years. Currently, the cost of electricity from CSP in SA is based on a two-tier tariff: a base rate, and a peak rate [31]. The two-tier tariff was a modification of the initial single tariff plan. The cost of electricity from CSP increases by 270 per cent of the base rate during peak hours. Figure 3 shows the base hour cost as 1.82 and 1.70 ZAR/KWh, and the peak hour cost as 4.91 and 4.58 ZAR/KWh, in windows 3 and 4 respectively.
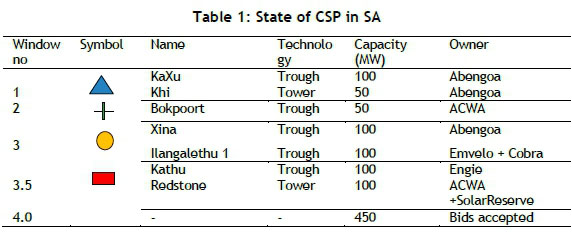
The DNI resources at a CSP site have a great influence on the cost of CSP electricity at that location [4], [32]-[34]. With the available solar resources in SA, CSP has the potential to attain the lowest electricity cost under favourable policies and support [5], [8], [33]. The technology type, capacity, and locations of various CSP plants in SA are presented in Table 1, while the locations of the plants are presented in the solar map in Figure 4.
3 CSP COST EVALUATION PARAMETERS
3.1 Levelised cost of electricity
Levelised cost of electricity (LCOE) is a widely accepted metric for comparing different energy sources, as its analysis is based on weighted cost average [35]-[37]. LCOE can be simply defined as the ratio of the total cost that goes into a project over its lifetime to the energy produced over the same period [38].
LCOE analysis can be good enough to equate the value of energy cost among RET, but the basic value of energy - the fluctuations in the demand and supply of electricity - is not well accounted for in the LCOE calculations [39]. This omission means that the LCOE does not take into account the strengths of energy sources such as CSP, with the extra added value or ability to supply energy on request. The general input factors to determine the LCOE of CSP are shown in Figure 5.
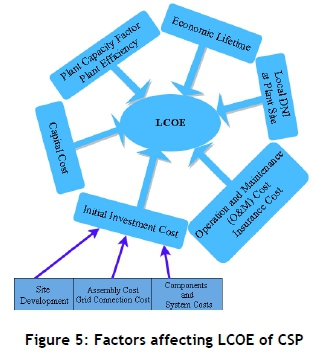
The factors that affect the determination of the LCOE for RETs are different from those of conventional fossil fuel energy sources [40], [41]. CSP, for instance, has a high initial investment capital, a relatively low operational and maintenance cost, and little or no fuel cost. Conventional energy sources, on the other hand, have high costs for fuel, but need relatively little initial start-up capital. Also, CSP costs are independent of the fluctuating fossil fuel price and more sensitive to investment capital and payback periods, while the cost of conventional energy is dictated by global fossil fuel prices [35], [42], [43].
A simple LCOE formula based on the existing analysis is presented in Equation 1:
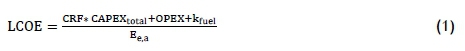
The capital recovery factor (CRF) in Equation 1 is the ratio of the present value of annuity with a discount rate (r) to the present value of the future sum of money to be repaid:
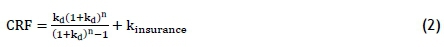
CAPEX in Equation 1 is the capital expenditure; kinsuranceis the annual insurance rate; OPEX is the operational expenditure; kfuel, is the fuel cost (which is zero for the CSP technology); Eeais the annual net electricity generation; and kdis the annual debt interest rate.
3.2 Levelised profit of energy
The levelised profit of energy (LPOE) was used by Silinga, Gauché, Rudman & Cebecauer [31] to determine the feasibility of CSP systems in SA. The LPOE is a function of the total income from a CSP plant, the operation and maintenance (O&M) costs, and the total capital cost, over the economic lifetime of the plant. A loan discount rate and the time value of money can be included in these calculations to levelise the cost. The LPOE can then be determined using Equation 3:
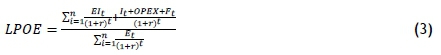
Etis the electricity generation in year t; Ftis the fuel cost; n is the life time of the plant; and Itis the investment in year t. EItis the energy income in year t and r is the discount rate.
The LPOE can be used to determine the profitability of CSP under various loading scenarios. In their analysis, Silinga et al. [31] proved that CSP will be profitable in SA if most of its supply to the grid is during peak hours. This is understandable, because if CSP generates heat during the day, supplies a minimal amount of energy to the grid, and saves the rest for peak hours it will maximise the peak hour tariff, which is 270 per cent of the base tariff. This will lead to a more profitable CSP sector, which can drive a 'pull' that will make the sector competitive.
3.3 DNI, LCOE, and LPOE
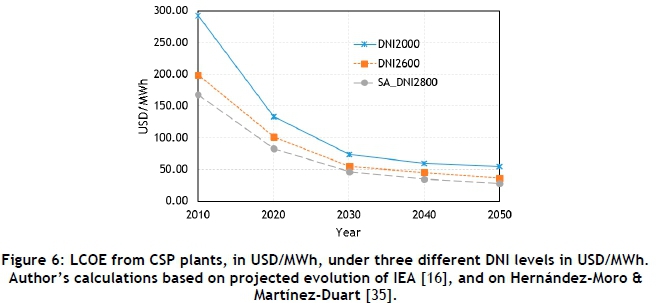
As stated before, the available DNI at a CSP plant's location has a significant impact on both the LCOE and the LPOE of the plant [31], [37], [44], [45]. In its report, The International Energy Agency (IEA) [15] showed that when a baseline of 2100 kWh/m2/year (Spain's average DNI) is assumed, the calculated LCOE of a CSP plant declines by 4.5 per cent for every 100 kWh/m2/year that the DNI exceeds 2100. An analysis of DNI as a function of LCOE was extrapolated from IEA data [15], [17], to determine the future LCOE in SA as a function of the DNI. An average DNI of 2800 kWh/m2/year was set for SA, resulting in a lower LCOE than expected, as shown in Figure 6. The LCOE cost of CSP in SA in 2050, according to this analysis, would be about 29 USD/MWh, compared with the current LCOE cost of 120 USD/MWh [46].
3.4 Specific investment cost of CSP
The specific investment cost of CSP in this study refers to the theoretical cost of investment that should be involved in CSP development in other locations, based on DNI variance. The available DNI in a plant location can serve as an indicator of the difference in the investment cost compared with other locations [2], [47], [48]. In Equation 4, the DNI in Spain and SA were compared with CSP cost to determine the specific investment cost of CSP electricity in SA. The average DNI of 2800 kWh/m2/yr in Upington in the Northern Cape Province of Sa was compared with the 2090 kWh/m2/yr DNI in Southern Spain (with the highest installed CSP capacity) [49]. CSP was widely deployed in Spain in 2010 as a result of the feed-in tariff that the government had introduced. The feed-in tariff of EUR 250/MWh (USD 34.8 cents/kWh) [17] for Spain in 2010 was then used, and the 2010 specific cost/tariff of CSP in SA was found to be USD 25.9 cents/kWh, which was seven per cent lower than the actual SA CSP feed-in tariff of 27.85 USD cents/kWh in the year 2009 [50].

The actual investment cost of CSP in SA in 2010 was 3.6 USD/kWh for CSP plants with no storage, 5.75 USD/kWh for six hours of storage, and 6.75 USD/kWh for plants with nine hours of storage [24]. However, the investment costs for parabolic trough CSP in SA in 2010, based on the analysis in this study, were 3.3, 5.3, and 6.2 USD/kWh for CSP plants with no storage, six hours of storage, and nine hours of storage respectively. This deviation, combined with a low local manufacturing capability for CSP components in 2010, may have contributed to the reduction in the learning rate of CSP in SA.
The expected future capital cost of CSP electricity in SA in 2050 will be 4700 USD/kW for a solar tower plant with energy storage of six to eight hours and a capacity of factor of 0.6-0.8, based on all the learning analysis presented in this section.
The current capital cost of the tower technology type of CSP is between 6800 USD/kW AND 12800 USD /kW, with energy storage of four to eight hours and a capacity factor of 0.4-0.8 [51].
4 CSP COST EVOLUTION
4.1 Experience curve and cumulative installed capacity
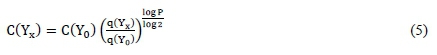
The experience curve explains that, whenever production doubles, the cost of a product is reduced by a certain percentage [52], [53]. In the case of CSP, it can be referred to as the reduction that occurs in the cost of CSP when the cumulative installed CSP capacity doubles. The experience curve can be related to the global cumulative installed capacity to highlight the present cost evolution, which can then be used to predict the future cost of development [15]. Experience curves can also be viewed as learning curves that represent cost reduction as a function of production [52], [54]-[56]. An important variable in the analysis of the learning curve is the learning rate (LR), which Hernández-Moro and Martínez-Duart [35] defined as the percentage cost reduction that happens when the global cumulative installed capacity doubles. The relationship between the global cumulative installed capacity, q, and the cost of the same system, C, at a reference year, Y0, and a future year, Yx, is shown in Equation 5a:

Nemet [57] defined the b in Equation 5a as a function of learning rate (LR), which he expressed as:

Therefore, Equations 5a and 5b can be rewritten in terms of progress ratio, P, as
The reduction in the cost of CSP components has led to an overall reduction in the cost of CSP electricity. The cost has fallen globally over the years from 80 USD cents/kWh in the 1980s to around 20 to 30 USD cents/kWh in 2010, 17 to 25 USD cents/kWh in 2013, and an expected six USD cents//kWh in 2050 [15], [35], [58]. However, this cost of electricity from CSP systems varies globally, depending on the DNI resources of the location [2], [45], [59], [60].
In order to determine the economics and future cost of CSP, reliable global CSP roadmaps and outlooks were analysed. These included the IEA technology roadmap [17] and the Greenpeace reports [15], [26], [30], [61]. These studies indicated the expected global annual CSP installation to be between 5600 MW and 49000 MW by 2030 with a per kW cost of between 3.4 and 3.8 USD/kW; between 9500 MW and 75 000 MW by 2040 with an electricity cost of between 2.6 and 2.8 USD/kW; and between 12000 MW and 131000 MW by 2050 with an electricity cost of between 2.5 and 2.7 USD/kW.
The rate of cost reduction of CSP electricity, R, was determined using an adapted compound growth rate, shown in Equation 6, where y is the number of reference milestone years, and the input data were from Fichtner [22], Black and Veatch [62] and WWF [61].
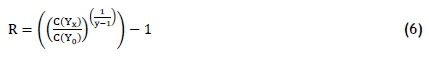
The SA CSP cost reduction rate based on the most realistic moderate scenario was found to be 11.4 per cent. The progress ratio, P, defined as a function of the cost reduction rate, was expressed by Shouman and Khattab [2] as (P =1-R); thus, P, based on this analysis, was 0.886. Using the cost reduction rate and the progress ratio, with a DNI of 2800 kWh/m2/yr, the overall experience curve of CSP in SA was determined. As a result, the CSP cost is expected to decrease from USD 0.12 /kWh (ZAR 1.6/kWh) to USD 0.07/kWh (ZAR 1/kWh) in 2030.
4.2 Limitations to future cost analysis of CSP
CSP technology has the capability to be a major player in the future energy mix of SA, owing to the available solar resources, the CSP plant configuration, and its energy dispatchability [63]. It is hard,
however, to estimate or predict the future cost of CSP, although some studies have attempted this - for example, the study of IEA [17]. Some of the reasons for the difficulties in estimating future costs include the following:
-
There are difficulties in getting real cost information for existing plants;
-
The manufacturing of each plant has different cost information structures, and these are often kept confidential;
-
Factors such as solar multiple, storage capacities, and solar resources, which are not general to RETs, influence the overall cost of CSP; and
-
CSP electricity LCOE is difficult to analyse, as it can be country-specific.
An experience curve analysis could be based on CSP subsystems (for example, thermal energy storage, solar thermal reflector, or heat receivers), or the complete system. Trieb [1] suggests that the best way to determine the learning rate of CSP is to combine the different learning rates of the various components involved. However, the IEA [17] report showed that there is a delay in the expected 10 per cent reduction for every time the CSP global cumulative capacity doubles. These delays generally affect the cost reduction rate of other components and materials (power block and balance of plants). This makes the work of the learning rate analysis complex.
4.3 CSP learning rate for cost competitiveness
The identified growth rate, the cost reduction rate, and the progress ratio form the basis for the analysis of the CSP learning rate. These factors act together to determine how competitive the cost of CSP would be with other conventional power generating systems in the future [44], [54], [59], [64].
In this paper, we use the average of all the baseline/current situation scenarios that have been published [30], [58], [61 ] to suggest the expected CSP learning rate. In Figure 7, the expected annual CSP capacity to be installed, based on the current state of CSP and the projected cost between now and 2050, are plotted on the primary axis, while the projected global cumulative capacity is plotted on the secondary axis, all as a function of year.
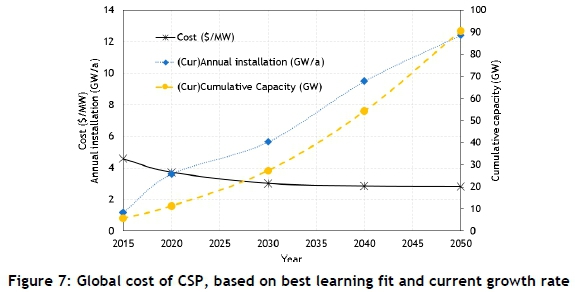
From Figure 7, and considering the 2015 global cumulative capacity of 4.5 GW, a 20 per cent learning rate would only be achieved if the capacity is increased to 11 GW by year 2020. The global installed capacity, which doubles between 2020 and 2030, will cause a 22 per cent reduction in the cost of installation. The annual installed capacity in Figure 7 is expected to double between 2020 and 2030, and this will be accompanied by a 25 per cent reduction in the cost of installation. In conclusion, a 20 to 30 per cent annual global cumulative growth rate will achieve a cost reduction of around 45 to 50 per cent by the year 2050.
4.4 Future of CSP capital cost
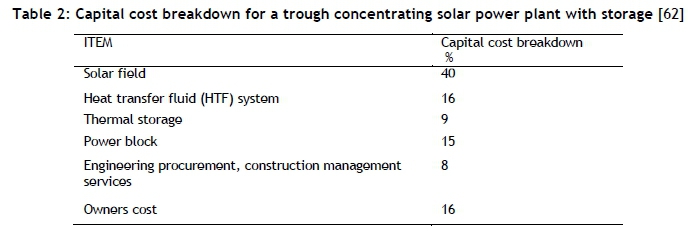
It has been proven that CSP is capital-intensive [65], [66], as the cost of investment is high. This increases the risk and often reduces confidence about getting the funds required to deploy the technology [59], [67], [68]. This section analyses the existing capital cost (or CAPEX) breakdown for a central receiver/tower plant, and a trough concentrating solar power plant with storage. The aim is to estimate the future cost of CAPEX and the accompanying experience curve in SA.
IRENA [51] reported that the tower technology has the greatest possibilities of LCOE cost reduction in the coming years, but argued that there is not enough data to substantiate this claim. Considering this, therefore, the analysis in this paper focuses only on the parabolic trough technologies in SA. The capital cost data breakdown of a CSP plant with dry cooling, six-hour storage, and a solar multiple of two was retrieved from Black and Veatch [62]. The costs are shown in Table 2.
The CAPEX breakdown in Table 2 was used to multiply the future cost of trough plants, based on the SA CSP CAPEX forecast, to get the future cost of various CAPEX subsystems, as shown in Figure 8. The CAPEX data from Fichtner [22], WWF [58], and Black and Veatch [59] for CSP in SA were retrieved and compared with data from other sources - NREL [12] and OECD/IEA [66]. The data was validated by experts to predict the future cost and possible trend of CSP in SA. The experience curve analysis in this paper describes the whole SA CSP industry, and is not merely a cost analysis based on any participating company.
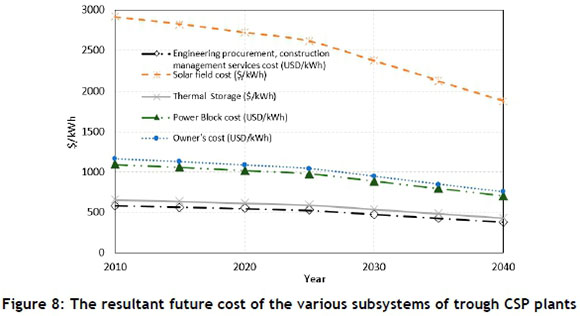
The various subsystems that make up the capital cost of CSP, according to the analysis, will experience about 33 per cent cost reduction between now and 2040. The cost will then stabilise, and is expected to be fixed until 2050.
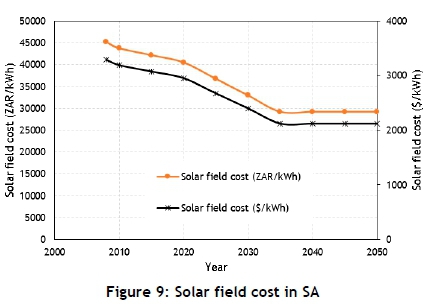
In SA, CSP is very promising in terms of future cost reduction; but with only three plants connected to the grid there is limited data to work with. The percentage share of the cost of a solar field in the CAPEX of a 100 MW parabolic CSP plant presented by Platzer and Dinter [54] was used to determine the specific solar field cost of the existing 100 MW plants in SA, as shown in Figure 9. The CAPEX values were based on data retrieved from Black and Veatch [62].
To get a more precise result for the current solar field cost projection of CSP in SA, a similar analysis to the one described above was performed using available data for all existing CSP trough plants in SA [12], [48], [69]-[72]. The specific solar field cost was calculated by dividing the solar field cost by the aperture area. The minimum and maximum cost deviation of -35 per cent and +15 per cent derived from Black and Veatch [62] was used, based on an IEA (2014) forecast and SA CSP project commissioning dates. The resultant specific solar field cost for all CSP plants in SA was determined.
Owing to the difficulty of a fractional breakdown of the components of power block and thermal storage, and the large disparity in the existing CAPEX fractional breakdown in the literature, only the specific solar field cost was analysed. This was done because the current solar field cost is easily comparable between the different types of plants and the various types of technologies, and can be validated from various data sources.
In Figure 10, the 50 MW plants in SA were represented by 'X' and the asterisk symbol (*), while the other data points represent 100 MW plants. Other subsystem cost analyses have been found to vary, based on the tenders, targets, or policies of the involved stakeholders.
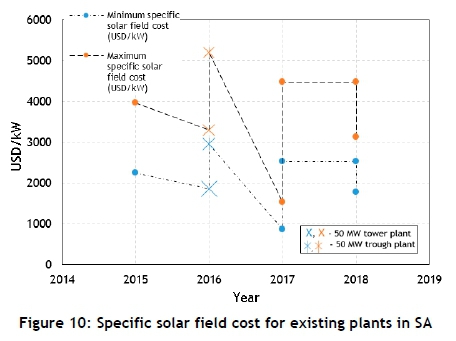
There is no visible trend for the minimum and maximum specific solar field cost for the existing CSP plants in SA, as shown by the dotted lines in Figure 10. There is, however, a large spread between the costs of the solar fields for plants with the same capacity. The results also show that there are no visible experience effects, suggesting that before a CSP company can enjoy experience effects in SA, it must have successfully developed several CSP plants locally. However, based on the maximum and minimum specific solar field cost and on expert opinion, a learning rate of nine per cent may be on-going in the solar field cost for parabolic troughs in SA.
5 CONCLUSIONS
This study has highlighted the current state of CSP in SA for capacity and costs. The economic indicators of CSP, which include LCOE, LPOE, DNI, and specific costs, were discussed, and the most realistic future cost of CSP in SA was presented. Limitations to the learning effect of CSP in SA were identified; existing principles were used with limited data to develop the learning rate, progress ratio, and cost reduction rate of CSP. The study showed that there are no existing patterns in the capital costs of the existing CSP plants in SA for technology, size, solar multiple, site location, or storage capacity; this makes the experience curve analysis of the CSP industry difficult. The solar field cost, which is the most significant capital cost, was analysed independently to give an idea of what the CSP experience curve might look like. The CSP learning rate in SA was calculated, the future of capital costs was then determined, and the likely experience curve for CSP in SA was presented.
6 RECOMMENDATIONS
With vast uncultivated land and DNI resources that are second only to Chile, CSP can become a major stakeholder in the energy mix of SA in the future. A collaborative approach is needed for CSP technologies to break through in efficiency and cost, because more CSP plants need to be rolled out to allow for the learning effect, which only comes by doing.
CSP components and facilities often need to be on a large scale before they can be highly efficient [73]. In SA and other parts of the world, there are few plants, and these are often built only a few units at a time. All the existing CSP facilities are near-unique, as they were developed on site due to their fragility and size and other complexities involved in moving CSP components. This near-uniqueness, and the small number of unit constructions, slow down the lowering of cost, which would otherwise have resulted from the learning effect and the exploitation of economies of scale.
Both a demand-pull and a technology-push approach should be deployed to make the cost of CSP competitive. Demand-pull will be effective when the locally available CSP technologies are subsidised, and the economies of scale and the learning effects are allowed to drag the cost down. A better alternative is the technology-push approach, in which there is a significant increase in the funding and motivation for basic and advanced research and development on CSP and its components. The technology-push will lead to the development of new technology, with reduced cost and higher efficiency that can penetrate the market without subsidies or with reduced support.
The learning rate for CSP systems and components is highly uncertain, given the early stage of CSP technology deployment. Estimates of eight to ten per cent based on other technologies are considered conservatively realistic [1], [15].
Strategic market introduction, in terms of smart cost calculations for the peak, medium, and base load power supply, will be a positive step in the quest towards massive CSP deployment [2], [73]; calculating the cost of technological subsystems, as performed in this study, will aid the optimisation of fund distribution and cost [74], [75].
REFERENCES
[1] Trieb, F. 2005. Concentrating solar power for the Mediterranean region, MED CSP Project. Stuttgart: German Aerospace Center (DLR). [ Links ]
[2] Shouman, E.R. & Khattab, N.M. 2015. Future economic of concentrating solar power (CSP) for electricity generation in Egypt, Renewable and Sustainable Energy Reviews, 41, 1119-1127.http://doi.org/10.1016/j.rser.2014.08.067. [ Links ]
[3] Gauché, P., von Backström, T.W. & Brent, A.C. 2012. A value proposition of CSP for South Africa. In Southern African Solar Energy Conference (SASEC) (pp. 1-12). South Africa. Retrieved from http://sterg.sun.ac.za/wp-content/uploads/2012/06/CSP-071.pdf. [Accesed: August 29, 2016] [ Links ]
[4] Barlev, D., Vidu, R. & Stroeve, P. 2011. Innovation in concentrated solar power, Solar Energy Materials and Solar Cells, 95(10), 2703-2725. http://doi.org/10.1016/j.solmat.2011.05.020 [ Links ]
[5] Gauché, P., von Backström, T.W. & Brent, A.C. 2013. A concentrating solar power value proposition for South Africa. Journal of Energy in Southern Africa. 24(1), 67-76 [ Links ]
[6] Fluri, T.P. 2009. The potential of concentrating solar power in South Africa, Energy Policy, 37(12), 5075-5080. http://doi.org/10.1016/j.enpol.2009.07.017. [ Links ]
[7] Brent, A.C. & Pretorious, T. 2010. Solar technology roadmap of South Africa. Retrieved from http://www.energy.gov.za/files/setr/solarenergytechnologyroadmapnew folder/setr_overview.html. [Accesed: March 12, 2016] [ Links ]
[8] Musango, J.K. & Brent, A.C. 2015. A roadmap framework for solar aided power generation in South Africa. Journal of Energy in Southern Africa, 26(4), 2-15. [ Links ]
[9] Eberhard, A., Leigland, J. & Kolker, J. 2014. South Africa's renewable energy IPPprocurement program: Success factors and lessons. Retrieved from http://www.ee.co.za/article/south-africas-reippp-programme-success-factors-lessons.html. [ Links ]
[10] DoE. 2011. Integrated resource plan for electricity 2010030. Retrieved from http://www.energy.gov.za/IRP/irpfiles/IRP2010_2030_final_report_20110325.pdf. [Accesed: April 19, 2016] [ Links ]
[11] DoE. 2015. State of renewable energy in South Africa. Retrieved from https://www.gov.za/sites/www.gov.za/files/State%20of%20Renewable%20Energy %20in%20South%20Africa_s.pdf. [Accesed: April 19, 2016] [ Links ]
[12] NREL. 2016. Concentrating solar power projects in South Africa. Retrieved from http://www.nrel.gov/csp/solarpaces/by_country_detail.cfm/country=ZA. [Accessed: March 29, 2017]. [ Links ]
[13] DoE. 2013. Integrated resource plan for electricity (IRP update 2013): Update report. Retrieved from www.doe-irp.co.za/content/IRP2010_updatea.pdf. [Accesed: December 19, 2016] [ Links ]
[14] Pierce, W., Bischof-Niemz, T., Mehos, M., Badeda, J. & Gauche, P. 2017. The role and value of CSP in the South African power system: Consensus statement. Pretoria. Retrieved from http://www.crses.sun.ac.za/media/uploads/presentations-5881d2c175c98.pdf?platform=hootsuite. [Accesed: March 10, 2017] [ Links ]
[15] IEA. 2010. IEA world energy outlook report, IEA Annual Report, 51. 75739 Paris Cedex 15. Retrieved from www.iea.org/Textbase/about/copyright.asp. [Accesed: January 19, 2017] [ Links ]
[16] OECD/IEA. 2010. Technology roadmap concentrating solar power, Current, 5. Retrieved from http://www.oecd-ilibrary.org/energy/technology-roadmapconcentrating-solar-power_9789264088139-en. [Accesed: July 19, 2016] [ Links ]
[17] IEA. 2014a. Energy technology roadmaps - A guide to development and implementation. Retrieved from http://www.iea.org/publications/freepublications/publication/Technol ogyRoadmapAguidetodevelopmentandimplementation.pdf [Accessed: March 6 2016]. [ Links ]
[18] StatSA. 2014. National accounts: Enviromental economic accounts compendium. Pretoria. Retrieved from www.statsa.co.za [Accessed: August 5 2016]. [ Links ]
[19] Eskom. 2013. Solar water heating rebate programme targets, Cop17 Fact Sheet, 17-19. [ Links ]
[20] Eskom. 2015. Eskom fact sheet: Concentrating solar power, Generation Communication RW 0003 Revision 5, pp. 2-4. [ Links ]
[21] Eskom. 2017. Coal power. Eskom Holdings SOC Reports, http://www.eskom.co.za/AboutElectricity/ElectricityTechnologies/Pages/Co al_Power.aspx [Accessed: April 8, 2017]. [ Links ]
[22] Fichtner. 2010. Assessment of technology options for development of concentrating solar power in South Africa. Final report prepared for World Bank and ESAP. Retrieved from https://www-cif.climateinvestmentfunds.org/sites/default/files/.Presentation-WB(Eskom)Project- 2010_12_07.pdf [Accessed: December 3, 2016]. [ Links ]
[23] BP. 2017. Global Energy Economics. Retrieved from http://www.bp.com/en/global/corporate/energy-economics.html. [Accessed: March 12, 2017]. [ Links ]
[24] EPRI. 2010. Power generation technology data for integrated resource plan of South Africa. EPRI Member Specific Final Report. Palo Alto, CA: EPRI. [ Links ]
[25] REN21. 2012. Renewables 2012 Global Status Report 2012, 172. Retrieved from http://www.ren21.net/[Accessed: August 21, 2015]. [ Links ]
[26] REN21. 2016. Renewables 2016 Global Status Report (K. Seyboth, F. Sverrisson, F. Appavou, A. Brown, B. Epp, A. Leidreiter,B. Sovacool, eds). Renewable Energy Policy Network for 21st Century. http://doi.org/ISBN978-3-9818107-0-7. [ Links ]
[27] Energy.gov. 2015. Renewable energy tax credits. Retrieved from http://www.energystar.gov/taxcredits [Accessed: March 16, 2016]. [ Links ]
[28] FS-UNEP. 2016. Global trends in renewable energy. Frankfurt. Retrieved from http://fs-unepcentre.org/sites/default/files/publications/globaltrendsinrenewable energyinvestment2016lowres_0.pdf. [Accessed: March 3, 2017]. [ Links ]
[29] REN21 . 2015. Renewables 2015 Global Status Report. Retrieved from http://www.ren21.net/wp-content/uploads/2015/07/REN12-GSR2015_Onlinebook_low1.pdf. [Accesed: March 10, 2017] [ Links ]
[30] Teske, S., Leung, J., Crespo, L., Bial, M., Dufour, E. & Richter, C. 2016. Solar thermal electricity -Global outlook 2016. Amsterdam. Retrieved from http://www.greenpeace.org/international/Global/international/publications /climate/2016/Solar-Thermal-Electricity-Global-Outlook-2016.pdf. [ Links ]
[31] Silinga, C., Gauché, P., Rudman, J. & Cebecauer, T. 2015. The South African REIPPP two-tier CSP tariff: Implications for a proposed hybrid CSP peaking system. Energy Procedía, 69, 1431-1440. http://doi.org/10.1016/j.egypro.2015.03.119. [ Links ]
[32] Martín, H., De La Hoz, J., Velasco, G., Castilla, M. & García De Vicuña, J.L. 2015. Promotion of concentrating solar thermal power (CSP) in Spain: Performance analysis of the period 1998-2013. Renewable and Sustainable Energy Reviews, 50, 1052-1068. http://doi.org/10.1016/j.rser.2015.05.062. [ Links ]
[33] Viebahn, P., Lechon, Y. & Trieb, F. 2011. The potential role of concentrated solar power (CSP) in Africa and Europe - A dynamic assessment of technology development, cost development and life cycle inventories until 2050. Energy Policy, 39(8), 4420-4430. http://doi.org/10.1016/j.enpol.2010.09.026. [ Links ]
[34] Franchini, G., Perdichizzi, A., Ravelli, S. & Barigozzi, G. 2013. A comparative study between parabolic trough and solar tower technologies in solar ranking cycle and integrated solar combined cycle plants. Solar Energy, 98, 302-314. http://doi.org/10.1016/j.solener.2013.09.033. [ Links ]
[35] Hernández-Moro, J. & Martínez-Duart, J.M. 2012. CSP electricity cost evolution and grid parities based on the IEA roadmaps. Energy Policy, 41, 184-192. http://doi.org/10.1016/j.enpol.2011.10.032. [ Links ]
[36] Shum, K.L. & Watanabe, C. 2008. Towards a local learning (innovation) model of solar photovoltaic deployment. Energy Policy, 36(2), 508-521. http://doi.org/10.1016/j.enpol.2007.09.015. [ Links ]
[37] Silinga, C. & Gauché, P. 2014. Scenarios for a South African CSP peaking system in the short term. Energy Procedía, 49, 1543-1552. [ Links ]
[38] IRENA. 2012. Renewable energy technologies cost analysis series: Concentrating solar power. Comprehensive Renewable Energy, 3(2), 595-636. http://doi.org/10.1016/B978-0-08-087872-0.00319-X. [ Links ]
[39] Kost, C., Schlegl, T., Thomsen, J., Nold, S. & Mayer, J. 2012. Levelized cost of electricity renewable energies. Heidenhofstraße 2: 79110. [ Links ]
[40] Liu, M., Steven Tay, N.H., Bell, S., Belusko, M., Jacob, R., Will, G. & Bruno, F. 2016. Review on concentrating solar power plants and new developments in high temperature thermal energy storage technologies. Renewable and Sustainable Energy Reviews, 53, 1411-1432 [ Links ]
[41] Baharoon, D.A., Rahman, H.A., Omar, W.Z.W. & Fadhl, S.O. 2015. Historical development of concentrating solar power technologies to generate clean electricity efficiently: A review. Renewable and Sustainable Energy Reviews, 41, 996-1027. http://doi.org/10.1016/j.rser.2014.09.008. [ Links ]
[42] García-Barberena, J., Monreal, A., Mutuberria, A., & Sánchez, M. 2014. Towards cost-competitive solar towers - Energy cost reductions based on decoupled solar combined cycles (DSCC). Energy Procedia, 49, 1350-1360. http://doi.org/10.1016/j.egypro.2014.03.144. [ Links ]
[43] Ouyang, X. & Lin, B. 2014. Levelized cost of electricity (LCOE) of renewable energies and required subsidies in China. Energy Policy, 70, 64-73. http://doi.org/10.1016/ j.enpol.2014.03.030. [ Links ]
[44] Xu, X., Vignarooban, K., Xu, B., Hsu, K. & Kannan, A.M. 2016. Prospects and problems of concentrating solar power technologies for power generation in the desert regions. Renewable and Sustainable Energy Reviews, 53, 1106-1131. http://doi.org/10.1016/j.rser.2015.09.015. [ Links ]
[45] Kraas, B., Schroedter-Homscheidt, M. & Madlener, R. 2013. Economic merits of a state-of-the-art concentrating solar power forecasting system for participation in the Spanish electricity market. Solar Energy, 93, 244-255. http://doi.org/10.1016/j.solener.2013.04.012. [ Links ]
[46] Hashem, H. 2017. CSP tower installation costs drop on heliostat innovations, pre-assembly. New Energy Update: CSP [Online]. Available: http://analysis.newenergyupdate.com/csp-today/csp-tower-installation-costs-drop-heliostat-innovations-pre-assembly. [Accessed: April 5, 2017]. [ Links ]
[47] Shum, K.L. & Watanabe, C. 2009. An innovation management approach for renewable energy deployment: The case of solar photovoltaic (PV) technology. Energy Policy, 37(9), 3535-3544. http://doi.org/10.1016/j.enpol.2009.04.007. [ Links ]
[48] CSP-World. 2012. IFC (World Bank) disclose the summary of proposed investment for Abengoa's South Africa CSP plants. Retrieved from http://www.csp-world.com/news/20120430/00194/ifc-world-bank-disclose-summary-proposed-investment-abengoa-s-south-africa-csp [Accessed: February 12, 2016]. [ Links ]
[49] NREL GIS. 2015. Solar maps. NREL GIS, National Renewable Energy Laboratory: dynamics maps, GIS and analysis tools data. Retrieved from: http://www.nrel.gov/gis/solar.html [Accessed: March 17, 2015]. [ Links ]
[50] IEA. 2013. Renewable Energy Feed-in Tariff (REFIT) South Africa. International Energy Agency (IEA) Policies and measures. National Energy Regulator of South Africa (NERSA). Retrieved from https://www.iea.org/policiesandmeasures/pams/southafrica/name-24547-en.php [Accessed: April 6, 2017]. [ Links ]
[51] IRENA. 2015. Renewable power generation costs in 2014: An overview, http://www.irena.org/DocumentDownloads/Publications/IRENA_RE_Power_Costs_ 2014_report.pdf [Accessed: January 14, 2017]. [ Links ]
[52] Weiss, M., Junginger, M., Patel, M.K. & Blok, K. (2010). A review of experience curve analyses for energy demand technologies. Technological Forecasting and Social Change, 77(3), 411-428. http://doi.org/10.1016/j.techfore.2009.10.009. [ Links ]
[53] Papineau, M. 2006. An economic perspective on experience curves and dynamic economies in renewable energy technologies. Energy Policy, 34(4), 422-432. http://doi.org/10.1016/j.enpol.2004.06.008. [ Links ]
[54] Platzer, W.J. & Dinter, F. 2016. A learning curve for solar thermal power, 160013, 0-8. http://doi.org/10.1063/1.4949254. [ Links ]
[55] Afuah, A.N. & Bahram, N. 1995. The hypercube of innovation. Research Policy, 24(1), 51-76. http://doi.org/10.1016/0048-7333(93)00749-J. [ Links ]
[56] Ibenholt, K. 2002. Explaining learning curves for wind power. Energy Policy, 30(13), 1181-1189. http://doi.org/10.1016/S0301-4215(02)00014-9. [ Links ]
[57] Nemet, G.F. 2006. Beyond the learning curve: Factors influencing cost reductions in photovoltaics. Energy Policy, 34(17), 3218-3232. http://doi.org/10.1016/j.enpol.2005.06.020. [ Links ]
[58] IEA. 2014b. Technology roadmap solar thermal electricity. International Energy Agency (IEA), 52. http://doi.org/10.1007/SpringerReference_7300. [ Links ]
[59] Ummadisingu, A. & Soni, M.S. 2011. Concentrating solar power - Technology, potential and policy in India. Renewable and Sustainable Energy Reviews, 15(9), 5169-5175. http://doi.org/10.1016/j.rser.2011.07.040. [ Links ]
[60] Boyle, G. 2012. Renewable energy: Power for a sustainable future. The Open University (3rd ed., Vol. 19). Milton, Keynes, UK: Oxford University Press. [ Links ]
[61] WWF. 2015. Concentrated solar power: A strategic industrial development opportunity for South Africa. Gland, Switzerland: WWF. Retrieved from http://awsassets.wwf.org.za/downloads/concentrated_solar_power _report_final.pdf. [Accesed: November 17, 2016] [ Links ]
[62] Black and Veatch. 2012. Cost report: Cost and performance data for power generation. Cost report prepared for the National Renewable Energy Laboratory. Retrieved from http://bv.com/docs/reports-studies/nrel-costreport.%0A.pdf. [Accesed: April 17, 2017] [ Links ]
[63] Gauché, P., Pfenninger, S., Meyer, A.J., von Backström, T.W. & Brent, A.C. 2012. Modeling dispatchability potential of CSP in South Africa. In Southern African Solar Energy Conference (SASEC) (Vol. 1, pp. 1-11). Stellenbosch, South Africa. [ Links ]
[64] Pitz-Paal, R., Dersch, J., Milow, B., Tellez, F., Ferriere, A., Langnickel, U. & Popel, O. 2007. Development steps for parabolic trough solar power technologies with maximum impact on cost reduction. Journal of Solar Energy Engineering, 129(4), 371. http://doi.org/10.1115/1.2769697. [ Links ]
[65] Timilsina, G.R., Kurdgelashvili, L. & Narbel, P.A. 2012. Solar energy: Markets, economics and policies. Renewable and Sustainable Energy Reviews, 16(1), 449-465. http://doi.org/10.1016/j.rser.2011.08.009. [ Links ]
[66] Devabhaktuni, V., Alam, M., Shekara Sreenadh Reddy Depuru, S., Green, R.C., Nims, D. & Near, C. 2013. Solar energy: Trends and enabling technologies. Renewable and Sustainable Energy Reviews, 19, 555-564. http://doi.org/10.1016/j.rser.2012.11.024. [ Links ]
[67] Pierce, W., Gauché, P., von Backström, T., Brent, A.C. & Tadros, A. 2013. A comparison of solar aided power generation (SAPG) and stand-alone concentrating solar power (CSP): A South African case study. Applied Thermal Engineering, 61(2), 657-662. http://doi.org/10.1016/j.applthermaleng.2013.08.014. [ Links ]
[68] Charles, R.P., Davis, K.W. & Smith, J.L. 2005. Assessment of concentrating solar power technology cost and performance forecasts. In Electric Power 2005 (pp. 1-25). Chicago: Sargent & Lundy LLC. http://doi.org/SL750-011. [ Links ]
[69] Abengoa Solar. 2010. Summary of proposed investment by Abengoa Solar for IFC. Retrieved from http://ifcext.ifc.org/ifcext/spiwebsite1.nsf/DocsByUNIDForPrint/758093F9932 24DD3852579DC00652C84?opendocument. [Accesed: November 17, 2016] [ Links ]
[70] Abengoa Solar. 2014. Solar power for a sustainable world. Retrieved from http://www.abengoasolar.com/web/en/plantas_solares/plantas_propias/suda rica/#seccion_1 [Accessed: February 11, 2016]. [ Links ]
[71] ACWA Power. 2016. Redstone CSP IPP. Retrieved from http://acwapower.com/project/redstone-csp/ [Accesed: April 19, 2016]. [ Links ]
[72] CSP Today Markets Reports - South Africa. 2015. CSP today markets reports series 2015 - Industry overview South Africa. Retrieved from http://www.csptoday.com/research/pdf/BrochureMarketsReports.pdf. [Accesed: May 11, 2017] [ Links ]
[73] Schmalensee, R. 2015. The future of solar energy: A personal assessment. Energy Economics, 52, S142-S148. http://doi.org/10.1016/j.eneco.2015.08.012. [ Links ]
[74] Bosetti, V., Catenacci, M., Fiorese, G. & Verdolini, E. 2012. The future prospect of PV and CSP solar technologies: An expert elicitation survey. Energy Policy, 49, 308-317. http://doi.org/10.1016/j.enpol.2012.06.024. [ Links ]
[75] Craig, O. O., Brent, A. C., & Dinter, F. 2017. Concentrated solar power (CSP) innovation analysis in South Africa. South African J. Ind. Eng., vol. 28, no. 2. [ Links ]
Presented at the 28th annual conference of the Southern African Institute for Industrial Engineering (SAIIE), held from 25-27 October 2017 in Vanderbijlpark, South Africa
* Corresponding author toyosi@sun.ac.za
# The author is enrolled for a PhD degree in Engineering with the Engineering Management and Sustainable Systems Research Group in the Department of Industrial Engineering, of Stellenbosch University

