


Services on Demand
Article
 English (pdf)
 Article in xml format
 Article references
Indicators

Related links
-
 Cited by Google
 -
 Similars in Google
Share

 Permalink
South African Journal of Industrial Engineering
On-line version ISSN 2224-7890
Print version ISSN 1012-277X
S. Afr. J. Ind. Eng. vol.28 n.2 Pretoria Aug. 2017
http://dx.doi.org/10.7166/28-2-1639
GENERAL ARTICLES
Water resource infrastructure implications of a green economy transition in the Western Cape province of South Africa: A system dynamics approach
A. PienaarI, #; A.C. BrentII; J.K. MusangoIII; I.H. de KockI, *
IDepartment of Industrial Engineering, Stellenbosch University, South Africa
IIDepartment of Industrial Engineering, Centre for Renewable and Sustainable Energy Studies, Stellenbosch University, South Africa; Sustainable Energy Systems, Engineering and Computer Science, Victoria University of Wellington, New Zealand
IIISchool of Public Leadership, Stellenbosch University, South Africa
ABSTRACT
The Western Cape Province government in South Africa has established the transition to a green economy as a high priority. The sustainable use of water resources has been identified as a critical necessity for such a green economy transition. The research summarised in this paper conceptualised the factors that relate to water resources, and that influence the transition to a green economy in the Western Cape Province. Subsequently, a system dynamics model was developed to evaluate the impact of key strategic interventions of the green economy transition. The results from the model show that the Province could possibly experience extreme water shortages in the near future if a business-as-usual scenario continues. However, with sufficient investment and effective management, the water demand of the Province can be met.
OPSOMMING
Die Wes-Kaapse Provinsiale regering in Suid-Afrika het die oorgang na 'n groen ekonomie as 'n hoë prioriteit gestel. Die volhoubare gebruik van waterbronne is geïdentifiseer as 'n noodsaaklikheid vir so 'n groen ekonomie oorgang. Hierdie navorsing som die faktore wat verband hou met waterbronne, en wat die oorgang na 'n groen ekonomie in die Wes-Kaap Provinsie kan beïnvloed op. Daarna is 'n stelsel dinamika model ontwikkel om die impak van die belangrikste strategiese ingrypings van die groen ekonomie oorgang te evalueer. Die resultate van die model toon dat die provinsie moontlik uiterste watertekorte in die nabye toekoms as ervaar indien die huidige gebruiklike scenario voortduur. Maar met voldoende investering en doeltreffende bestuur, kan die vraag n water in die Provinsie bevredig word.
1 INTRODUCTION
The United Nations Environment Programme (UNEP) has a Green Economy Initiative that attempts to leverage significant green economy expertise within its global network of partners to build a global green economy, which it states is: "an economy that results in improved human well-being and social equity, while significantly reducing environmental risks and ecological scarcities" [1]. According to UNEP, building a green economy involves analysing challenges and opportunities in specific sectors, such as agriculture, fisheries, forests, buildings, industry, renewable energy, transport, waste, and water [1]. However, Swilling et al. [2] call for a shift from a sector focus that tends to be narrow to a "broad understanding of greening as a transitioning process of becoming more economically, socially and environmentally sustainable across the entire economy".
Transitioning to a green economy for the Western Cape Province of South Africa has its own complexities. On the one hand, the Province is South Africa's major agricultural export area and also the most important international tourist attraction [3]. On the other hand, climate change is expected to affect the Western Cape Province the most, with drought conditions that will worsen in this already water-stressed region. The Western Cape Government [3] released a document, Green is Smart, which underlines its endeavours to become the lowest carbon emitting province in South Africa, and the leading green economic hub of the African continent. An integral part of Green is Smart is to promote and improve the sustainable use of water resources.
In a green economy, the role of water in maintaining ecosystem services and water supply would be acknowledged, appreciated, and paid for [1]. The green economy recognises the direct benefits that society as a whole gains by conserving water-critical ecosystems, and by investing in water supply and sanitation and in wastewater treatment [4]. The cross-sectoral transition to a green economy requires new approaches throughout society, and includes embracing green technologies, planning for adaption to uncertain futures, improving the efficiency of water provision, and developing alternative water resources along with alternative forms of management [1] [4].
A green economy is advanced when water resources are invested in, protected, and managed sustainably. In addition, the management and allocation of water resources impacts the whole of the society and the economy; hence, sufficient governance becomes essential. Embedding water management at the centre of sustainable development requires institutions that facilitate discussion and decisions on society's targets, and the allocation of water resources to optimise production and equitable distribution [5]. Consequently, it is the role of water management authorities to initiate, implement, and support the process of transitioning to a green economy from a water resources perspective.
2 OBJECTIVE OF THE PAPER
The management of water resources in the Western Cape Province involves a number of non-linear and complex interactions among various role players [6]. Thus, to provide insight into the implications of a green economy transition in water resources infrastructure, requires the use of appropriate tools that can account for these complex interactions. Pienaar et al. [6] identified system dynamics as the most appropriate modelling tool that would be useful to understand better the water resources implications of a green economy transition within the Western Cape Province. This research paper thus develops a system dynamics model to provide insight into potential investment and management interventions that are relevant to the Western Cape Province green economy transition agenda.
3 SYSTEM DYNAMICS MODELLING
System dynamics is a method used to define, model, simulate, and analyse 'real-world' issues dynamically [7]. It takes into account non-linearity, feedbacks, and time delays, which are what characterise complex systems; and it has been used to investigate water resources problems [8]. While different studies provide different steps in system dynamics modelling (for example, [9], [10], [11]), generally the process can be categorised into five phases: problem identification, conceptualisation, model building, model testing, and policy analysis [11] [12]. These phases are iterative, and involve qualitative and quantitative modelling.
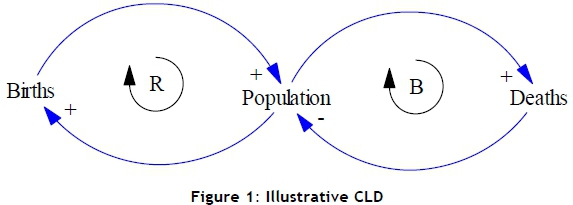
Qualitative modelling entails problem identification and conceptualisation. It involves mainly developing dynamic hypotheses, where causal loop diagrams (CLDs) are used (see Figure 1). CLDs illustrate direct causal links between variables, where the arrows point in the direction of influence [12]. The signs "+" or "-" indicate whether the influence is moving in the same or the opposite direction, while the signs "R" and "B" denote whether a feedback loop is either reinforcing or balancing [12]. A reinforcing loop is a positive feedback system. It can represent growing or declining actions [12]. The reinforcing loop shown in Figure 1 is an example of a growing action where the more the births that occur, the greater the population. Also, an increase in the population will result in an increase in births. A balancing loop is a negative or counteracting feedback loop, and seeks stability [12]. The balancing loop in Figure 1 indicates that the increases in the population will result in increases in deaths; however, the more deaths there are, the smaller the population.
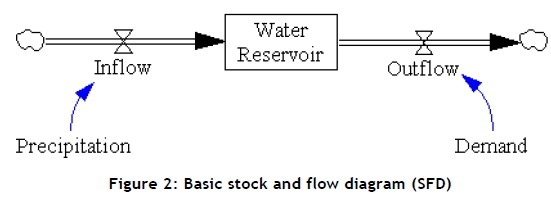
Quantitative modelling entails the remaining three phases of the modelling process, and provides insight into the actual observed behaviour of the system over time [12]. It makes use of four building blocks: stocks, flows, auxiliaries, and constants [13], as illustrated in Figure 2. In this example a water reservoir represents a stock; inflow and outflow represent the flows; precipitation and demand are constants, with arrows linking to inflow and outflow respectively. Stocks describe the condition of the system, and it would continue to exist even if all flows in the system were to be stopped. Flows are the changes in the stocks that occur over time. The amount of water in the reservoir will rise when the inflow exceeds the outflow, and vice versa. Precipitation and demand are used to influence the flows, and are assumed to remain constant.
4 WESTERN CAPE WATER RESOURCE MODEL (WECAWARM)
WeCaWaRM forms part of a larger Western Cape Green Economy Model (WeCaGEM), introduced by Musango et al. [14], which aims to provide insight into the implications of a green economy transition in the Western Cape Province. WeCaWaRM consists of eight sub-models: supply and demand, wastewater, surface water and groundwater, green economy investments, population, growth domestic product (GDP), education, and provincial land. Four of the sub-models - population, education, provincial land, and GDP - were built for the larger model (WeCaGEM), and were used to inform the analysis in WeCaWaRM.
WeCaWaRM was developed to evaluate the impact of green economy investments in water conservation and demand management interventions in the medium to long term. Based on the available data, the model simulated a period of 39 years, from 2001 to 2040. The historical trends from 2001 to 2011 were used to ensure that the model replicates the characteristics of the behaviour of the issues investigated.
4.1 WeCaWaRM dynamics proposition
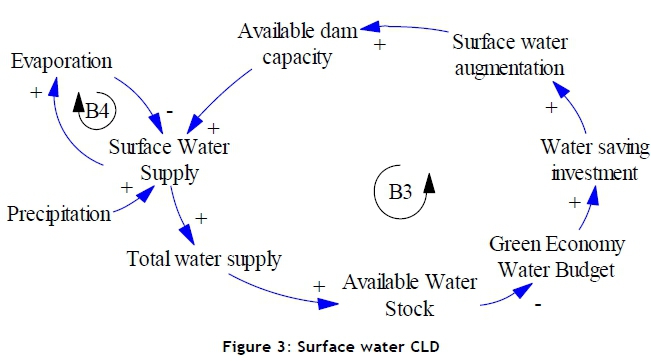
The WeCaWaRM dynamics proposition consists of thirteen feedback loops. Four are reinforcing (R1 to R4) and nine are balancing (B1 to B9). One of the main feedback loops is the surface water CLD (see Figure 3), which is discussed in more detail here; however, an in-depth discussion of the remaining CLDs can be found elsewhere [15].
The surface water CLD consists of two balancing loops, B3 and B4. B3 is balanced due to the connection between available water stock and the green economy water budget. The greater the available water stock, the smaller the green economy water budget will be. The more funds that are available in the green economy water budget, the more investment can be made in the augmentation of surface water sources. The more that augmentation and construction takes place, the more the available dam capacity, and ultimately the more surface water supply. It is evident through this CLD that surface water supply is limited by the available dam capacity. B4 shows the causal relationship between surface water and evaporation. The more surface water, the more the evaporation; and the more evaporation, the less surface water is available. Evaporation could be reduced if new dams were built deeper rather than wider; however, this could result in a 'fixes that fail' system, since water quality is reduced if the dams are built too deep. Therefore, this is not taken into account in this model.
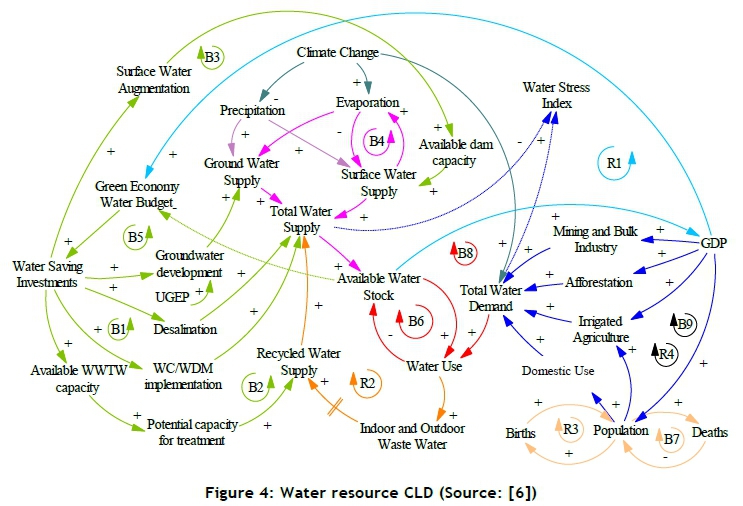
As shown in the water resource CLD (Figure 4), the water demands of the following sectors were considered: mining and bulk industry, afforestation, irrigated agriculture, and domestic use. In this model it was assumed that population growth, GDP growth, and climate change drive demand. Population growth drives demand for the obvious reason that people require water to survive from day to day. Also, an increase in the number of people results in an increase in activities such as agriculture and industry, and thus increased water demands. GDP increases the demand of the various sectors, since they will require more water as they expand. It is predicted that the Western Cape Province will become warmer as a result of climate change [6], and this will increase the water demand because it will cause people and agriculture to require more water. Furthermore, an additional connection not mentioned in the previous CLDs is between evaporation, precipitation, and climate change. Climate change is assumed to increase evaporation and decrease precipitation in the Province.
Water supply and demand influence the available water stock and the Water Stress Index. The available water stock refers to the amount of water that is available for use. In this CLD, demand is seen as conceptual, and the water use is seen as the actual amount of water used. The Water Stress Index is an auxiliary variable that is influenced by the total water supply and the total water demand. Generally a Water Stress Index is an indicator used to show areas of water stress. In this model it is also used as an indicator to show the water stress that the Western Cape Province experiences. The Water Stress Index is calculated by dividing the total demand by the total supply; therefore, the higher the demand, the higher the Water Stress Index.
Additional feedback loops that should be noted are B9 and R4. These loops emerged as a result of the link between GDP and population. The link shows that the population will increase as the GDP increases. This is a result of more funds being available to sustain life. Loops B9 and R4 follow the same path until they reach the variable named 'water use'. B9 originates as a result of the connection between water use and available water stock. An increased water use results in less available water stock. Loop R4 increases the available water stock, since the higher water use increases the amount of recycled water and thus the total water supply, and ultimately increases the available water stock. In the dynamic model, however, the link between GDP and population is not simulated. The reason for this is that, even though there is a connection between the variables, it is not certain exactly which mathematical equation would represent this connection. Hence, the link is included merely to show that the connection was considered.
4.2 WeCaWaRM sub-models
The VENSIM software1 was used to develop the simulation model. The key variables that were considered as essential in catalysing the green economy transition, with water resources as the primary focus, were calculated endogenously in the model. WeCaWaRM consists of eight sub-models [6]:
i. Water supply and demand sub-model;
ii. Waste water sub-model;
iii. Surface water and groundwater sub-model;
iv. Green Economy Investments sub-model;
v. Population sub-model;
vi. GDP sub-model;
vii. Education sub-model; and
viii. Provincial land sub-model.
The first four sub-models are clustered as the key WeCaWaRM sub-models, and are detailed here. The details of the other four are part of the WeCaGEM model, and are reported by Musango et al. [14].
4.2.1 Water supply and demand sub-model
Water supply in the model, for the 'business as usual' (BAU) case, is the sum of recycled water, groundwater, and surface water, which are all calculated in the sub-models. Therefore, the different supply sources are shadow variables in this sub-model, which indicates that they are calculated in other sub-models.
Historical water supply data for the Western Cape Province as a whole is scarce, and different information is available from different sources. However, after careful consideration, it was decided to use the data presented by Statistics South Africa [16]. The data are represented by various other documents, such as the NWRS1 [17], and it was assumed that it can be used with confidence. The data represent the water supply for the year 2000; however, it was assumed to be valid for the year 2001, since the time horizon of the model spans the period from 2001 to 2040.
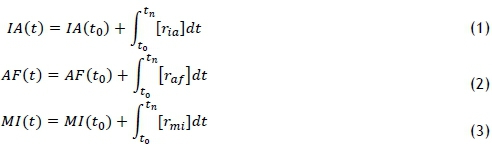
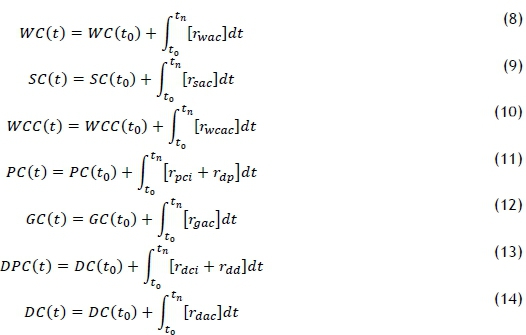
The water demand in this model is based on irrigated agriculture (IA), afforestation (AF), mining and bulk industry (MI), and domestic demand (DD). All except domestic demand are calculated with a stock and flow diagram. The non-domestic demand sectors are all dependent on the growth factor of the specific sectors, as discussed throughout the section. The stock and flows of the non-domestic demands are given as:
Desalination of seawater in the Western Cape Province had its origins at a coastal town named Sedgefield in 2009 [18]. Since 2009, four additional desalination plants have been built throughout the Province. Even though the existing desalination plants are only operated intermittently, desalinated water was still considered part of the base supply of the Province, adding a total of 8,687 million litres of water to the system.
Many factors influence water demand in South Africa, including climate, the nature of the economy, and standards of living, among others [17]. In this model it is assumed that the economy drives the non-domestic water demand growth. The literature confirmed this by using GDP as a guideline for the future demand growth pattern [19]. Accordingly, the annual per cent GDP growth rate was determined through the following equation:

where
PR = Annual percent growth rate
Vpresent = Present or future values
Vpast = Past or present value
n = Amount of years between past and present values
Domestic demand is calculated as an auxiliary variable, where the dynamics are determined by population growth and per capita demand. According to StatsSA [16], the rural and urban demand was 529 billion litres of water in 2000 (assuming that this is also true for 2001), and the population was 4,524,000 people. The per capita demand per year then equates to 320 litres/person/day.
4.2.2 Water supply and demand sub-model
Wastewater is treated in wastewater treatment works (WWTWs) to produce recycled water, which is used as a source in the total water supply system. Recycled water supply is calculated as an auxiliary variable in the model. It is primarily dependent on the indicated WWTW capacity and the amount of wastewater available for treatment, which in turn is dependent on the potable water SFD, as well as the WWTW SFD. The stock dynamic behaviour of potable water (PW) is dependent on the potable water inflow (rpwi), unaccounted-for water (UAW) in the treatment system (ruaw), and water outflow for domestic use (rdom). The WWTW capacity (WC) stock is dependent on two flows: annual WWTW construction (rwc), and WWTW depreciation (rwd). The two SFDs are given as:
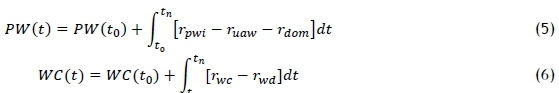
In the potable water SFD, the amount of potable water inflow is driven by the total water supply. It is assumed that potable water is given the highest priority in water allocation, and therefore the total supply is available should it be required. An outflow from the potable water stock is the unaccounted-for water (UAW) in the treatment system. UAW is water that is lost due to infiltration, leaks as a result of poor maintenance, and evaporation. According to the DWA [20], at least 36 million m3 of water is lost in the Western Cape Province each year between the water resource and the end user. The DWA [20] presents a table that contains nine towns in the Western Cape Province with high UAW. For the purpose of the model, the average percentage of the UAW for the nine towns was calculated and used in the model, which is 53 per cent.
Equation 6 describes the WWTW capacity SFD. In the Western Cape Province, wastewater services are carried out by 27 water service authorities via an infrastructure network comsisting of 158 WWTW facilities [21]. From the Green Drop Progress Report of the Department of Water Affairs [21], it can be concluded that only 79.13 per cent of the total design capacity of the WWTWs is used. In the model this is accounted for by the auxiliary variable 'ratio of WWTW capacity being used'.
The water treated in these WWTWs is generally considered to be polluted water originating from sewage treatment facilities, or the wastewater discharge from industrial facilities. In the model this water is accounted for by the inflows identified as 'wastewater as a result of indoor and outdoor use'. According to the CCT [22], research indicates that the average wastewater flow from a residential unit is about 70 per cent of the water consumption. Also, 90 per cent of water consumed by industrial consumers falls into the category of 'wastewater producing' consumption [22].
4.2.3 Surface water and groundwater sub-model
Surface water supply and groundwater supply are modelled as auxiliary variables. The only SFD that indirectly influences these water supplies is the dam capacity (DC). This stock is dynamically influenced by the annual dam construction (rdc) and dam depreciation (rdd). The SFD is presented as:

The dam capacity limit is set equal to the sum of the capacities of all the dams in the Western Cape Province [23]. The total capacity of the dams has changed throughout the time horizon of the model; these changes are also simulated in the model. The Berg River dam was built and completed in 2009, adding 127.1 million m3 to the total capacity of the Western Cape Province dams [24]. The Clanwilliam dam is currently undergoing construction, which aims to raise the dam wall by 13 metres, thus increasing the capacity by about 206 million m3 [21]. The construction of the Clanwilliam dam was on going at time of writing [25].
Surface water supply is dependent on the indicated dam capacity and the water that potentially enters the dams. The latter is calculated by considering the amount of runoff, evaporation, and percolation in the Western Cape Province. The runoff is dependent on the mean annual precipitation (MAP), the total provincial land, and conversion of rainfall to runoff. The total provincial land is calculated by the Provincial Land sub-model.
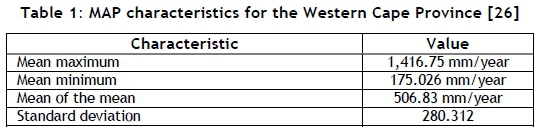
The average precipitation of the Western Cape Province was determined by using data from the study of the WRC [26], known as Water Resources of South Africa (WR2005). Various quaternary catchments throughout the Western Cape Province were analysed, from which a mean maximum, minimum, and average MAP and the standard deviation could be calculated (see Table 1). These figures were used in the random normal function in VENSIM to generate random numbers over the time horizon.
The prevailing patterns of variable and unevenly distributed rainfall in the Western Cape Province, combined with high evaporation rates, result in a very low conversion of rainfall to runoff. A study conducted on the river basins of South Africa indicates that the conversion ratio ranges from 3.4 per cent to 14 per cent throughout the country [27]. From this study it can be concluded that the conversion ratio for the Western Cape Province is equal to 12.1 per cent.
Water losses that occur before water enters the dams are due to evaporation, transpiration, infiltration losses, and water flowing directly into the sea. These losses are accounted for by the auxiliary variables 'fraction of rain evaporating immediately' and 'fraction of rain infiltrating and percolating'. Water losses that occur after the water has entered the dams are due to spillage if the dam is full, and seepage into aquifers. In the model it is assumed that groundwater stock is recharged if the dam spills or if seepage/ infiltration occurs.
Groundwater and surface water are commonly hydrologically connected, but the interactions are difficult to observe and measure. However, the model attempts to include a connection between these water supply sources. Apart from spillage and seepage of dams/surface water, groundwater is also recharged by rainfall that percolates into the ground, which is accounted for by the auxiliary variable 'possible rainfall to become groundwater'. It is a highly complex operation to determine the fraction of precipitation percolating for the whole Western Cape Province, as this fraction is dependent on vegetation cover, slope, soil composition, depth of the water table, the presence or absence of confining beds, and other factors, all of which are greatly variable factors in the Western Cape Province. However, based on the amount of precipitation inflow calculated by the model and the utilisable groundwater exploitation potential (UGEP) of the Province, it is assumed that 2 per cent of the precipitation percolates to become usable groundwater.
The capacity of the groundwater stock is set equal to the UGEP of the Western Cape Province, which is 1,049.3 million m3/annum [28]. The UGEP represents a management restriction on the volumes of water that can be abstracted, based on a defined maximum allowable water level drawdown. According to the DWA [28], only about 30 per cent of South Africa's groundwater is being used. This is assumed to be true for the Western Cape Province as well, and is simulated into the model with the auxiliary variable 'fraction of groundwater extracted'.
4.2.4 Green economy investments sub-model
The purpose of this sub-model is to inform stakeholders about the amount of investment required annually to ensure that the Western Cape Province has sufficient water supply to meet growing demand until 2040. The sub-model comprises seven SFDs. The total annual cost is calculated as an auxiliary variable, and involves the costs associated with the maintenance and implementation of WWTW, surface water, groundwater, WC/WDM, and desalination.
The WWTW cost stock (WC) accumulates the annual costs for WWTW (rwac). The surface water cost stock (SC) accumulates the annual costs for surface water (rsac). Similar to WWTW cost and surface water cost, WC/WDM cost stock (WCC) accumulates annual cost for WC/WDM (rwcac). To determine the groundwater costs, the change in pump station capacity is required. This is determined by a SFD that consists of one stock - pump station for groundwater capacity (PC) - and an in- and outflow -pump station capacity increase (rpci) and depreciation of pump station (rdp). The groundwater costs stock (GC) is subsequently calculated by the accumulation of annual costs for groundwater (rgac), which is subject to the change in pump station capacity. Desalination cost (DC) is determined in a similar way to that for groundwater. These SFDs are given as:
The annual costs in the model are all calculated with a Rand per kilogram water value. A detailed discussion of the specific interventions that are implemented in the model, and of the costs involved, can be found in the scenarios section, which follows after the section below on validation.
4.3 Validation of WeCaWaRM
The validation of WeCaWaRM was an iterative process that took place continuously throughout the modelling process, as required according to Barlas [29]. In addition, a formal validation process was followed to validate the model. A range of formal model structure and model behaviour tests was combined for the validation, as outlined by Barlas [29]. From the validation process it was concluded that the model is valid for its purpose [15]. However, more substantial historical data for precipitation, water supply, and demand for the Western Cape Province as a whole is required to gain further confidence in WeCaWaRM.
4.4 WeCaWaRM scenarios
The scenarios that were developed involve the implementation, at specific points in time, of various water conservation and water demand management (WC/WDM) and supply-side interventions. A decision rule was used to determine the characteristics of each scenario, based on the cost of the intervention, as well as the Water Stress Index calculated in the model. A detailed discussion of the development of the evaluated scenarios follows here; however, the scenarios evaluated are summarised in Tables 2 and 3 at the end of this section.
The water conservation and demand management (WC/WDM) elements and supply side interventions that are implemented in the model were chosen based on the amount of consideration the intervention received in the literature. If the intervention appeared in all the literature that was reviewed, it was assumed that there is a high likelihood that it will be implemented in the future and that it is deemed relatively feasible. Subsequently the evaluated interventions are:
i. WC/WDM (leakage repair, pressure management, user education);
ii. Augmentation (dam construction and groundwater development);
iii. Waste water re-use; and
iv. Large-scale desalination.
Each of these interventions was ranked according to cost, from least expensive to most expensive. In South Africa unit reference values (URVs) are commonly used to assess the economic efficiency of proposed water projects [30]. They are calculated by dividing the present value of the costs of the project by the present value of the water supplied by the project. This would be the most effective way to determine the ranking of the interventions. However, although project-specific details are required, these are not applicable to this research inquiry, since specific projects are not considered, but rather a general overview of possibilities.
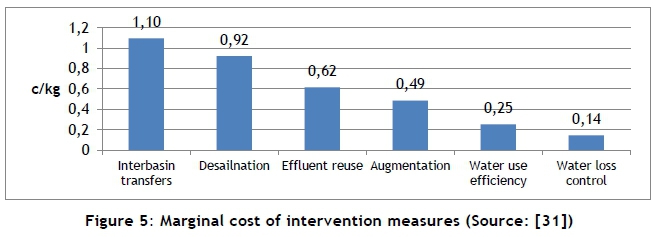
As a substitution for the URV, the DWAF [31] provided an indicative costing of the interventions based on a case study of the marginal cost of water sources in a municipal area. Figure 5 provides the cost of water, in cents per kilogram, for each intervention. These costs were adjusted from the costs in the DWAF report [31] according to inflation in South Africa from 2009 to 2014. It should be noted that the costs found in the graph do not depict the actual costs of the different intervention options, as these will vary on a project-by-project basis. However, these figures were used to provide an indication of the possible costs involved for the various interventions, should they be implemented in the Western Cape Province. Even though the implementation of different interventions depends on various aspects, such as the viability and practicality of the intervention, this was not taken into account in this study, since these aspects can only be determined with an in-depth feasibility study of specific projects concerning such interventions. The ranking of the interventions was based purely on the costs illustrated in Figure 5.
Water conservation and water demand management (WC/WDM) interventions are categorised as water loss control or water use efficiency interventions. However, the price associated with water use efficiency was used, with the aim of ensuring a more prudent approach. As previously mentioned, augmentation includes dam construction and groundwater development. Evidently, wastewater re-use was associated with 0.62 c/kg and desalination was associated with 0.92 c/kg. Inter-basin transfers were not taken into account in this research inquiry; however, it might become necessary to take this into account in the future.
Subsequent to the ranking of the interventions, the Water Stress Index was examined. As mentioned previously, the Water Stress Index is a universally recognised ratio that indicates risk. It is calculated by dividing water demand by water supply; therefore, once the water demand is more than the available water supply, the Water Stress Index will be larger than 1, which indicates the risk of drought.
By examining the Water Stress Index, six scenarios were developed. It was assumed that the first ranked intervention would be implemented in the year that the Water Stress Index (subsequent to 2015) rises above 1. The model was simulated again after the proposed intervention had been implemented to establish the next proposed year for intervention implementation. Therefore, each scenario includes an intervention from the preceding scenario. This process was continued until a satisfactory (below or equal to 1) Water Stress Index was established in 2040. The final results are discussed in Section 4.
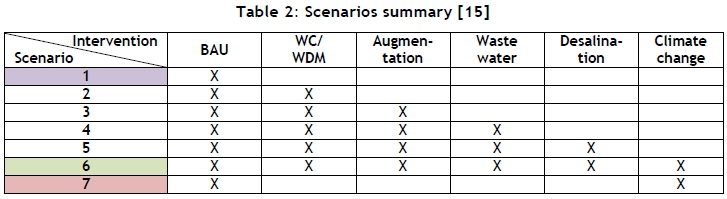
To provide clarity on the scenarios that were developed, a summary of them is presented in Table 2. Scenarios 1 to 6 each include the intervention of the previous scenario. Scenario 7 was developed with the aim of providing additional information about possible future scenarios without the proposed interventions implemented.
Table 2 summarises the variables in each intervention in the scenarios. The variables affected were categorised into the different interventions, which specified the quantity of the variable changed, as well as the year in which the change was introduced. As specified previously, some changes were implemented as a step-function, while others were assumed to change gradually over the given time periods.
Table 3 should be viewed in conjunction with Table 2. For example: in Table 2, scenario 3 includes BAU, WC/WDM, and augmentation. Subsequently, in Table 3, the variables affected in the scenario were those specified under WC/WDM and augmentation.
5 WECAWARM RESULTS
Three scenarios that were developed and evaluated will be discussed. The three selected scenarios were chosen because of their importance to relevant stakeholders and policy-makers. (For a full discussion of the results generated by the model, refer to Pienaar [15].)
For Scenarios 1 to 6, Table 2 shows that each scenario includes the evaluated intervention of the previous scenario. Scenario 7 does not simulate any reconciliation strategies, but represents a scenario where BAU continues with the added effects of climate change. Therefore, the discussion below addresses the results generated by each specified scenario, and follows the next sequence.
i. BAU scenario / Scenario 1;
ii. BAU with climate change scenario / Scenario 7; and
iii. Green economy scenario / Scenario 6.
Scenario 6 is considered as a possible strategy to assist the Western Cape Province to transition to a green economy. The results are discussed by means of graphical representations of the key variables, which are total supply and demand, and total annual cost for the water sector. However, annual cost is not discussed as part of the sections concerned with the selected scenarios, but rather under its own heading.
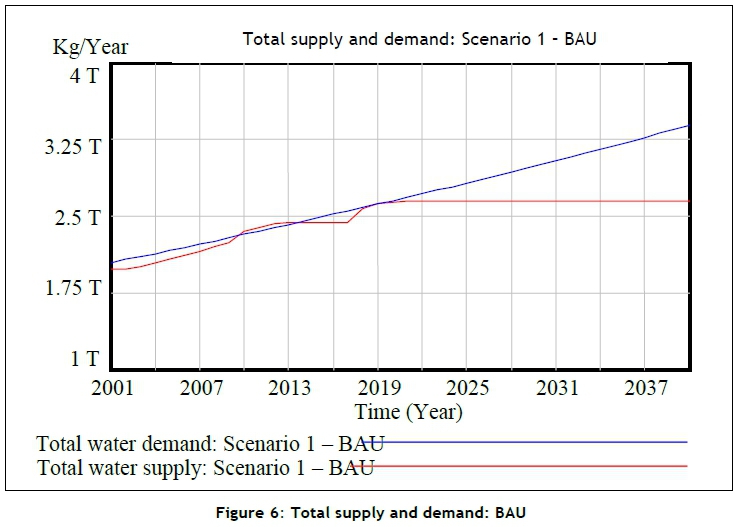
5.1 Business as usual (BAU) (Scenario 1)
Figure 6 illustrates the BAU, Scenario 1, for the predicted growth in water demand and the available water supply. Plotting the supply against the demand is an alternative way of indicating the risk, similar to the Water Stress Index. It should be noted that the demand is simulated, and not the actual consumption. This means that the total supply and demand graph (Figure 6) does not imply that the whole of the Western Cape Province would be without water if the demand exceeded the available supply. For example, in the Figure it can be seen that the demand was slightly more than the supply in 2008 and 2009. In actual fact, a drought occurred in the Eden and Karoo districts of the Western Cape Province in 2009. However, during this time the rest of the Province still had sufficient amounts of water available to satisfy the minimum water demand.
Furthermore, Figure 6 indicates that the demand exceeds the supply from 2014 onwards. This water shortage refers to, among others, the agricultural drought experienced by the farmers surrounding the Clan William dam, also known as the Olifantsriver Valley. According to Agri Western-Cape's CEO, Carl Opperman, the 2014 to 2015 summer was the driest the Western Cape Province had seen in many years [32]. Beaufort West, situated in the Great Karoo region, also struggled to maintain a sufficient water supply [33]. Evidently, the demand for water in the Western Cape Province is growing at a rapid pace, and the available water supply is not predicted to increase if the BAU scenario continues. This will most likely result in the entire Western Cape Province experiencing water shortages within the near future. By 2040 the water supply demand deficit in the Western Cape Province will be 745 billion litres.
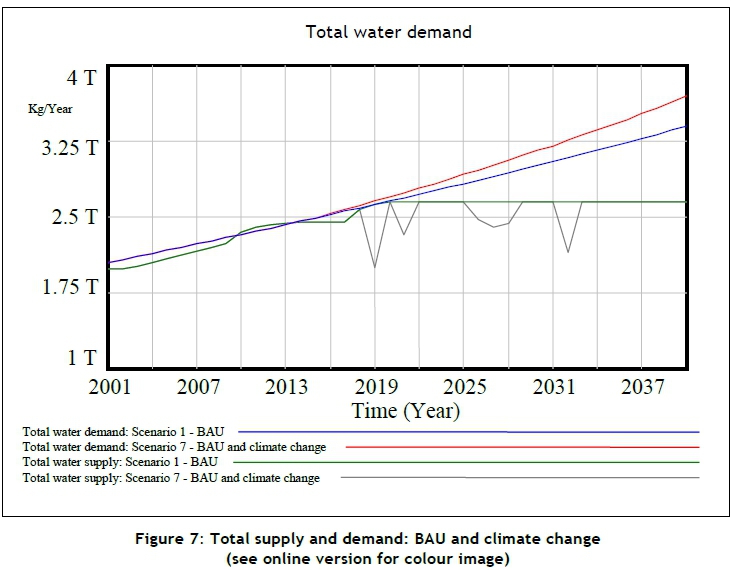
5.2 BAU and climate change (Scenario 7)
Climate change is predicted to increase the mean temperature, and cause more frequent and severe extreme weather conditions. Thus the Western Cape Province is predicted to become an increasingly water-scarce area. A random normal function was used to generate random numbers for the precipitation over the simulation period.
Figure 7 compares the results generated by the model for Scenario 1 and Scenario 7. Two primary differences should be noted. Firstly, the growth in water demand increases with climate change. This can be attributed, among other factors, to agriculture requiring more water as a result of higher evaporation rates and less rainfall. According to the results generated in Scenarios 1 and 7, the Western Cape Province will require 295 billion litres more water by 2040, with climate change taken into account and compared with the BAU scenario.
Secondly, the available water supply was observed to become increasingly variable with climate change - specifically through an increase in drought periods. Future drought periods were observed to become more frequent, especially in 2019, 2021, 2025 to 2029, and 2032, resulting in a sharply decreasing water supply.
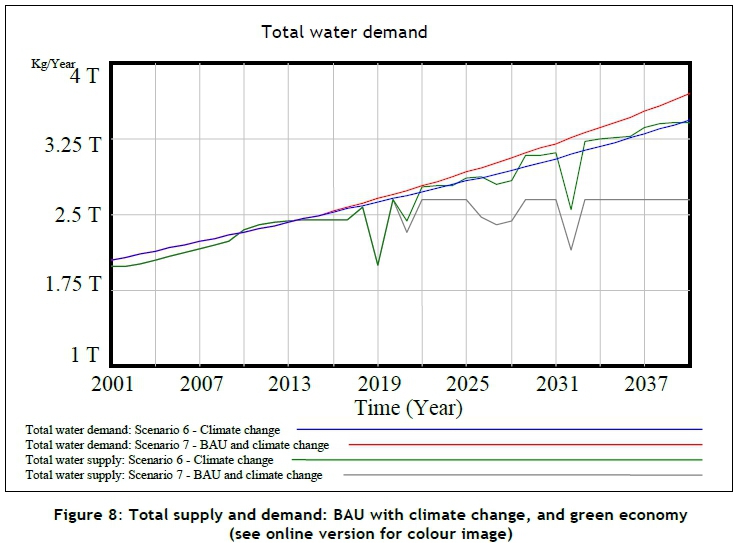
5.3 Green economy (Scenario 6)
Scenario 6 was selected as a feasible strategy in the transition to a green economy, since it takes climate change into account, and the interventions implemented in the scenario show adequate water supply for the Western Cape Province over the simulation period.
The total supply and demand for Scenarios 6 and 7 are presented in Figure 8. Firstly, the water supplies of the two scenarios are similar in the sense that the droughts occurring in 2019, 2021, 2025 to 2029, and 2032 are present in both scenarios. As seen in Figure 8, in the green economy scenario (Scenario 6) the proposed interventions will not fully alleviate the droughts, but will serve to reduce their effects. The water supply differs in the sense that Scenario 6 shows an increase of 756 billion litres by 2040 over the BAU with climate change scenario (Scenario 7). This increase in water supply is a result of water conservation and water demand management (WC/WDM) and the augmentation of the supply system through dam construction, groundwater development, wastewater treatment works (WWTWs) construction, and desalination implementation.
The water demand in the BAU with climate change scenario (Scenario 7) is 7.5 per cent more (or 256 billion litres of water) than the water demand inthe green economy scenario (Scenario 6). This can be attributed to the WC/WDM intervention, which aims to lower per capita water demand and reduce unaccounted-for water (UAW) throughout the supply system.
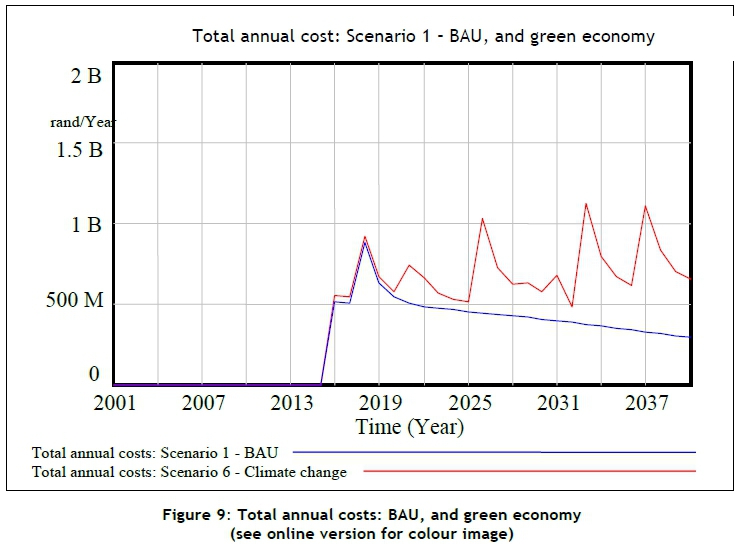
Figure 9 provides a comparison of the possible total annual costs that would be required to implement and maintain the BAU scenario (Scenario 1) with those required to implement the proposed interventions in the green economy scenario (Scenario 6).
The spikes in the green economy scenario (red line) can be attributed to the implementation of the various interventions. Understandably, the implementation of the interventions requires capital investment, whereafter only operational and maintenance costs are required. The amount required to implement the interventions depend on the type of intervention that is implemented, and on the extent of the intervention. The maintenance costs depend on the life cycle expectancy of the specific intervention.
6 CONCLUSION
The key output variables were evaluated against three different scenarios that included BAU, BAU with climate change, and the green economy. The results generated for the different scenarios were evaluated separately and in comparison with one another with the aim of attaining a full understanding of the system.
For the BAU scenario and the BAU with climate change scenario, the total supply and demand results indicated that the Western Cape Province might face severe water shortages in the near future. The BAU with climate change scenario indicated that the Province will experience extreme drought conditions more frequently and more intensely. The results generated by the green economy scenario illustrated that the proposed interventions would be able to provide the Western Cape Province with sufficient water until 2040, with the implication of a large capital investment, among others.
From the results discussed, it is concluded that the green economy scenario is the best case, since it indicates sufficient water until 2040.
6.1 Recommendations and implications for policy-makers
The research objectives were developed with the aim of providing stakeholders with support in order to improve management within the the Western Cape Province's water sector with the transition to a green economy. The systems dynamics modelling process ensured a better understanding of the interrelationships, structure, causal factors, and systemic problems of the green economy transition.
The scenario development and testing highlighted specific areas that could be targeted to assist this transition. As mentioned, the green economy scenario was identified as the best case, since it ensures sufficient water supply despite the effects of climate change. The green economy scenario holds various implications for policy-makers and stakeholders. Seven areas were identified as high impact areas that could be targeted to assist the green economy transition: financial investment, water demand, water supply, water quality, strong management structure, data availability, and social equity. (Further details can be found in Pienaar [15].)
REFERENCES
[1] United Nations (UN) and United Nations Environment Programme (UNEP). 2011. A green economy in the context of sustainable development and poverty eradication: What are the implications for Africa? Economic and Social Council, Economic Commission for Africa, Available at: http://www.greengrowthknowledge.org/sites/default/files/downloads/resource/Green _Economy_What_Are_The_Implications_For_Africa_UNEP_UNECA.pdf (accessed 26 February 2016). [ Links ]
[2] Swilling, M., Musango, J.K. and Wakeford, J. 2016. Greening the South African economy. Cape Town: UCT Press. [ Links ]
[3] Western Cape Government. 2013. Green is smart. Cape Town. https://www.westerncape.gov.za/assets/departments/transport-public-works/Documents/green_is_smart-4th_july_2013_for_web.pdf (accessed 26 February 2016). [ Links ]
[4] De Lange, W.J. 2016. Water for greening the economy. In: Swilling, M., Musango, J.K., Wakeford, J. (eds), Greening the South Africa economy: Scoping the issues, challenges and opportunities. Cape Town: UCT Press. [ Links ]
[5] World Water Assessment Programme (WWAP). 2012. The United Nations World Development Report 4: Managing water under uncertainty and risk. Paris: UNESCO. [ Links ]
[6] Pienaar, A.P., Brent, A.C. and Musango, J.K. 2015. Water resource implications of a green economy transition in the Western Cape Province of South Africa: A modelling approach review. Proceedings of the International Association for Management of Technology (IAMOT) 755-771. http://iamot2015.com/2015proceedings/documents/P093.pdf (accessed 17 February 2016). [ Links ]
[7] Pruyt, E. 2013. Using small models for big issues. Delft, The Netherlands. http://www.researchgate.net/publication/234538269_Using_Small_Models_ for_Big_Issues_Exploratory_ System_Dynamics_Modelling_and_Analysis_for_Insightful_Crisis_Management (accessed 26 February 2016). [ Links ]
[8] Mirchi, A., Madani, K., Watkins, D. and Ahmad, S. 2012. Synthesis of system dynamics tools for holistic conceptualization of water resources problems. Water Resources Management 26 (9), 2421 -2442. [ Links ]
[9] Randers, J. 1980. Guidelines for model conceptualization. In Randers, J. (ed.) Elements of the system dynamics method. Portland, OR: Productivity Press. [ Links ]
[10] Roberts, N., Andersen, R., Deal, M., Shaffer, G. and Shaffer, W. 1983. Introduction to computer simulation: A system dynamics modeling approach. Portland, OR: Productivity Press. [ Links ]
[11] Sterman, J.D. 2001. System dynamics modeling. California Management Review 43 (4), 8-25. [ Links ]
[12] Maani, K.E. and Cavana, R.Y. 2007. Dynamic modelling, systems thinking, system dynamics. New Zealand: Pearson. [ Links ]
[13] Musango, J.K., Brent, A.C. and Bassi, A.M. 2014. Modelling the transition towards a green economy in South Africa. Technical Forecasting & Social Change 87, 257-273. [ Links ]
[14] Musango, J.K., Brent, A.C. Van Niekerk, J.B.S., Jonker, W.D., Pienaar, A.P., York, T.A., Oosthuizen, J., Duminy, L. and De Kock, I.H. 2015. A system dynamics approach to understand the implications of a green economy transition in the Western Cape Province of South Africa. 33rd International Conference of the System Dynamics Society, Cambridge, USA. [ Links ]
[15] Pienaar, A.P. 2016. Water resource infrastructure implications of a green economy transition in the Western Cape Province of South Africa: A system dynamics approach. Masters thesis, Stellenbosch University, South Africa. [ Links ]
[16] Statistics South Africa (STATSSA). 2010. National accounts: Water management areas in South Africa. Pretoria. https://www.statssa.gov.za/publications/D04058/D04058.pdf (accessed 26 February 2016). [ Links ]
[17] Department of Water Affairs and Forestry (DWAF). 2004. National water resource strategy: First edition. Pretoria. http://soer.deat.gov.za/dm_documents/National_Water_Resource_Strategy_7-ABx.pdf (accessed 26 February 2016). [ Links ]
[18] Blersch, C.L. 2014. Planning for seawater desalination in the context of the Western Cape water supply system. Masters thesis, Stellenbosch University. http://hdl.handle.net/10019.1/95848 (accessed on 26 February 2016). [ Links ]
[19] Wang, S., Xu, L. and Wang, H. 2014. Assessment of water ecological carrying capacity under the two policies in Tiling City on the basis of the integrated system dynamics model. Science of the Total Environment 472, 1070-1081. [ Links ]
[20] Department of Water Affairs (DWA). 2011. Development of reconciliation strategies for all towns in the Southern Planning Region: Provincial summary report - Western Cape. Directorate: National Water Resource Planning. DWA Report No. P RSA 000/00/15411. [ Links ]
[21] Department of Water Affairs (DWA). 2012. Green drop progress report: Chapter 13. Pretoria. http://www.ewisa.co.za/misc/BLUE_GREENDROPREPORT/GreenDrop2012/013_ Chapter13%20W-Cape%20(FINAL)25Apr2012%20Ver2.pdf (accessed 26 February 2016). [ Links ]
[22] City of Cape Town (CCT). 2010. City of Cape Town Water and Sanitation Department. Issue 1. https://www.capetown.gov.za/en/Water/Documents/FAQIssue1_17May2010.pdf (accessed on 26 February 2016). [ Links ]
[23] Department of Water and Sanitation (DWS). 2015. Western Cape state of dams on 2015-08-31. Pretoria. https://www.dwa.gov.za/Hydrology/Weekly/ProvinceWeek.aspx?region=WC (accessed 26 February 2016). [ Links ]
[24] Trans-Caledon Tunnel Authority (TCTA). 2015. Berg water project. Online. http://www.tcta.co.za/#!berg/motzc (accessed 26 February 2016). [ Links ]
[25] Molewa, B.E.E. 2011 . National Assembly: Question no 1407. Internal Question Paper. No. 13, Cape Town. http://www.parliament.gov.za/live/commonrepository/Processed/20130507/ 348679_1.doc (accessed 26 February 2016). [ Links ]
[26] Water Research Commission (WRC). 2005. Water resources of South Africa, 2005 Study. Pretoria. http://www.wrc.org.za/Lists/Knowledge%20Hub%20Items/Attachments/9663/ TT%20381%20complete.pdf (accessed 26 February 2016). [ Links ]
[27] Ashton, P.J., Hardwick, D. and Breen, C. 2008. Changes in water availability and demand within South Africa's shared river basins as determinants of regional social and ecological resilience. http://www.anthonyturton.com/assets/my_documents/my_files/C2B _AshtonHardwick6Breen_-_Final_-_25May2008.pdf (accessed on 26 February 2016). [ Links ]
[28] Department of Water Affairs (DWA). 2010. Groundwater strategy. Pretoria. https://www.dwa.gov.za/Groundwater/Documents/GSDocument%20FINAL%202010_ MedRes.pdf (accessed 26 February 2016). [ Links ]
[29] Barlas, Y. 1996. Formal aspects of model validity and validation in system dynamics. System Dynamics Review 12 (3), 183-210. [ Links ]
[30] Van Niekerk, P.H. and Du Plessis, J.A. 2013. Unit reference value: Application in appraising inter-basin water transfer projects. Water SA 39 (4), 549. [ Links ]
[31] Department of Water Affairs and Forestry (DWAF). 2009. Water for growth and development framework. Pretoria. https://www.dwa.gov.za/WFGD/documents/WFGD_Frameworkv7.pdf (accessed 26 February 2016). [ Links ]
[32] Mortlock, M. 2015. WC Farmers face trouble if no rain falls soon. Eyewitness News. http://ewn.co.za/2015/05/18/W-Cape-farmers-face-dry-season-due-to-lack-of-rainfall (accessed 26 February 2016). [ Links ]
[33] Matthews, S. 2015. Re-using water: Again and again. Plumbing Online. http://www.plumbingafrica.co.za/index.php/water-management/water-management-features/972-re-using-water-again-and-again (accessed 26 February 2016). [ Links ]
Submitted by authors 8 Sep 2016
Accepted for publication 2 Jul 2017
Available online 31 Aug 2017
* Corresponding author: imkedk@sun.ac.za
# The author was enrolled for a MEng (Engineering Management) in the Department of Industrial Engineering, Stellenbosch University, South Africa
1 http://vensim.com

