


Serviços Personalizados
Artigo
 Inglês (pdf)
 Artigo em XML
 Referências do artigo
Indicadores

Links relacionados
-
 Citado por Google
 -
 Similares em Google
Compartilhar

 Permalink
South African Journal of Industrial Engineering
versão On-line ISSN 2224-7890
versão impressa ISSN 1012-277X
S. Afr. J. Ind. Eng. vol.28 no.2 Pretoria Ago. 2017
http://dx.doi.org/10.7166/28-2-1311
GENERAL ARTICLES
A transportation model for an effective disaster relief operation in the SADC region
J.-C.M. BarakaI, *; V.S.S. YadavalliII; R. SinghI
IDepartment of Industrial Engineering, Durban University of Technology, South Africa
IIDepartment of Industrial and Systems Engineering, University of Pretoria, South Africa
ABSTRACT
This paper reviews some challenges faced by humanitarian logistics and supply chain organisations in the transportation of resources, evacuees, and emergency supplies for disaster relief operations in the SADC region. To identify the appropriate transportation to assist in the region, three models were reviewed and proposed: A typical transportation problem, a genetic algorithm based on a spanning tree, and a linear optimisation using Excel Solver. Reviewing the literature revealed that both man-made and natural disasters have caused over ninety thousand fatalities and affected millions just over the past three decades. A further review shows that most disaster deaths are the result of poor infrastructure, especially in populated areas. This presents a challenge to relief organisations in their efforts to provide on-time relief to victims in pre- and post-disaster periods. Although each proposed transportation problem has particular complexities, each of them could assist the region to decrease the relief operation response time and cost. This paper provides the reader with a greater understanding of the challenges faced by the humanitarian supply chain in the SADC region. This paper proposes a conceptual model based on an actual empirical case.
OPSOMMING
Hierdie artikel hersien sommige van die uitdagings wat deur humanitêre logistieke- en voorsieningskettingmaatskappye ervaar word met betrekking tot die vervoer van hulpbronne, ontruiming van vlugtelinge en noodgevalvoorrade vir rampverligting in die Suider-Afrikaanse ontwikkelingsgemeenskap. Om die gepaste vervoertegniek te identifiseer, word drie modelle ondersoek en voorgestel, naamlik 'n tipiese vervoerprobleem, 'n genetiese algoritme gebaseer op 'n uitstrekkende boom en 'n lineêre optimisering. 'n Literatuurstudie het gevind dat beide mensgemaakte- en natuurrampe meer as negentigduisend sterftes veroorsaak het, terwyl dit miljoene geaffekteer het in die afgelope drie dekades. 'n Verdere ondersoek toon ook dat die meeste rampsterftes as gevolg van swak infrastruktuur is, veral in bevolkte areas. Dit skep 'n uitdaging vir rampverligtingorganisasies in hul poging om betyds verligting aan slagoffers te bring. Alhoewel die voorgestelde vervoerprobleme spesifieke kompleksiteite bevat, kon elkeen gebruik word om die streek by te staan om verligtingsaksies se reaksietyd en koste te verminder. 'n Konspetuele model gebaseer op empiriese data word voorgestel.
1 INTRODUCTION
According to Tatham and Houghton [1], the international academic community has, not surprisingly, been increasingly interested in the challenges of humanitarian logistics [2]. They believe that this rise from a near-zero baseline in 2005 to around ten journal special editions published between 2008 and 2011 is due to the rise in disaster cases in recent decades. Throughout history, both natural and man-made disasters have caused loss of life and environmental damage. The Centre of Research on the Epidemiology of Disasters (CRED) website [3] has reported that earthquakes, floods, landslides, and extreme weather conditions made 2010 the deadliest year for disasters in the last two decades [3]. Some 373 natural disasters killed almost 300 000 people in 2010, affecting nearly 207 million others, and costing nearly US$ 10 billion in economic losses" [4]. Thomas [5] defines disaster relief chains as the processes and systems involved in mobilising people, resources, skills, and knowledge to help vulnerable people affected by natural disasters and complex emergencies. With 90 000 registered victims of disasters since SADC's creation, Balcik, Beamon and Smilowitz [6] believe that providing relief rapidly and cost-effectively to the affected areas minimises human suffering and death. Therefore, some humanitarian organisations - such as the Fritz Institute - have begun to demonstrate the need for models and tools to improve the efficiency and effectiveness of humanitarian supply chains [7].
Some SADC countries are more advanced in their humanitarian supply chain planning than others. A survey by Thomas and Mizushima [8], at a major aid organisation that included about 300 logisticians, revealed that the majority of logisticians typically get their education and training on the job by co-workers. The inexperienced and unskilled logisticians in the field potentially hinder the provision of effective logistics support. Other hindrances include infrastructure (hospitals, roads, communications, railways, airways, buildings, etc.) and transportation (vehicles, trains, planes, helicopters, ships, etc.).
The aim of this paper is to review the existing transportation models and discuss the most effective system to assist SADC decision-makers in their quest for humanitarian logistic and supply chain optimisation.
The objectives of this study are the following:
1. Evaluate the region's humanitarian logistics and supply chain preparedness.
2. Identify key regional infrastructural and transportation challenges for disaster activities and relief organisations in SADC.
3. Investigate available transportation models that would be suitable for the SADC region, with common parameters such as road conditions, level of preparedness, supply chains, logistical arrangements, and so forth.
4. Make conclusions and recommendations on the appropriate methods to be used by SADC decision-makers to ensure that the region is safe.
2 LITERATURE REVIEW
2.1 SADC vs preparedness
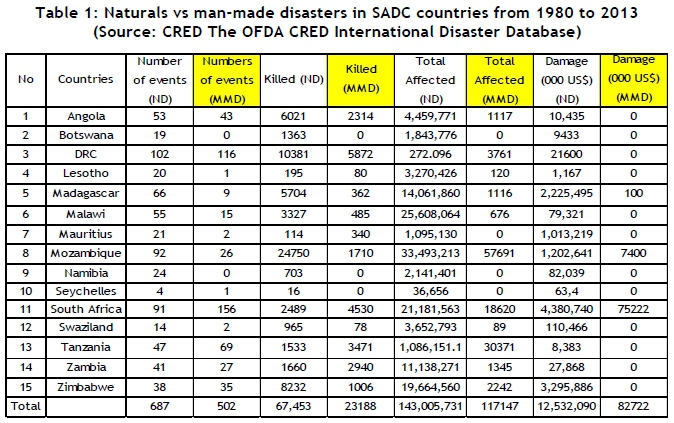
This paper provides a record of disaster activities in the Southern African region, and the current best, or worst, preventive and preparedness practices. SADC consists of 15 countries: Angola, Botswana, Democratic Republic of Congo, Lesotho, Madagascar, Malawi, Mauritius, Mozambique, Namibia, Seychelles, South Africa, Swaziland, Tanzania, Zambia, and Zimbabwe. Each of those countries has had firsthand experience of both natural and man-made disasters. The reviewed literature included areas that have been, and still are, at great risk of disaster activities, with additional emphasis being placed on the current best preventive and preparedness practices. CRED [3], in Table 2.1, lists the SADC disaster statistics in numerical values for both natural disasters (ND) and man-made disasters (MMD).
In the SADC region, natural disasters have occurred in the form of drought, famine, earthquakes, epidemics, extreme temperatures, floods, storms, wildfires, etc. [15].
According to the statistics listed in Table 2.1, from 1980 to 2013 the SADC region has endured 687 natural disasters, killing about 68 000 people and affecting 143 000.
A more recent example is the Ebola epidemic in the Democratic Republic of Congo in 2014, when 40 lives were lost in the Equateur Province.
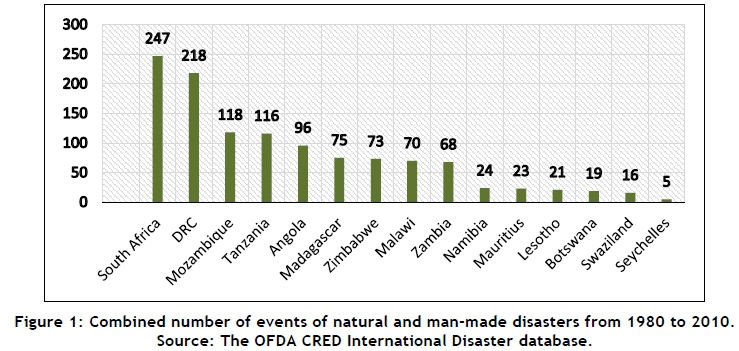
Table 1 also lists, per country, the 502 man-made disasters experienced by the SADC countries, killing over 23 000 people, affecting nearly 120 000 more, and causing just under US$ 83 million worth of damage. Combining both natural and man-made disasters, the Southern African region has endured a total of 1 189 disaster cases from 1980 to 2013, with South Africa having the greatest number of them.
Disasters are unpredictable; disaster relief demands during an event are also often unpredictable [12]; [13]; [14]. According to Hills [17], the phrase 'disaster management' implies a degree of control that rarely exists in disasters [15]. This view supports Altay and Green [18], who state that standard management methods used in industry may not directly apply to disaster situations.
Since the beginning of the Industrial Revolution in 1750, the increase in infrastructure and transportation systems, and the development of faster and more accurate ways to maximise productivity and transform raw materials to finished-goods products, have triggered the boom of western civilisation; but they have also contributed to the increase in man-made disasters such as war, crimes, industrial accidents, transport accidents (road, rail, and air), terrorism, and political disasters.
According to Benson and Clay [9], poorer countries are most affected by disasters; they argue further that the poorer areas of the population are often the most severely affected [9]. Similarly, Samii [10] estimates that 90 per cent of those affected by natural disasters are in countries with medium human development, while two-thirds of those killed are from countries with low human development [11]. Southern Africa, with over 70 per cent of its population living below the poverty datum line (according to Southern African Development Community (SADC) statistics), requires a collective approach.
2.2 SADC region disaster preparedness challenges
2.2.1 Challenges related to infrastructure
SADC infrastructure challenges have long been seen as a major handicap for the region's aspirations for economic growth. According to the World Bank's 2013 annual report, "Infrastructure has the potential to help the region be successful" [19]. Figure 2 shows the trend in disaster behaviour in each country for the growing cost of infrastructural damage and the number of fatalities. For instance, South Africa and Mauritius are the leading SADC countries in infrastructure; although the cost of damage is higher, the trend indicates a lower number of fatalities in those two countries. Countries such as Malawi or the DRC, where infrastructure is almost non-existent, have a relatively higher number of fatalities.
According to Long and Wood [16], the number of victims is higher due to inadequate infrastructure and lack of transport connectivity between, and within, particular countries. Kovács and Spens [12] add that the effects of earthquakes and floods are often magnified by poor housing situations and inadequate construction requirements.
The SADC region alone suffered damage worth US$ 12.5 billion from 1980 to 2013, with countries such as South Africa and Zimbabwe heading the list. Any future infrastructure development should take past experience into account in order to build more robust transportation and communication systems, and infrastructure that will resist natural and man-made disasters. As indicated by Jacob, Edelblum and Arnold [22], "the robustness of infrastructure systems depends on their design, state of maintenance, and the man-made, environmental and natural stresses to which they are exposed. Besides man-made stresses, weather, climate, and extreme natural events such as floods, earthquakes, wind, or ice storms regularly test the vulnerability of these systems".
2.2.2 Challenges related to transportation
In advanced economies, recent years have seen a transport revolution driven by affordable mass air travel, train travel, high and rapidly rising levels of personal car mobility, and the containerisation of general freight with associated concepts of inter-modalism, just-in-time delivery, and restructured distribution channels [23]. These advancements have improved disaster mitigation, response, and recovery. The quick and efficient response to the 2010 earthquake in Japan serves as a testament to the positive contribution that a system such as 'just-in-time' could make in the aftermath of a disaster.
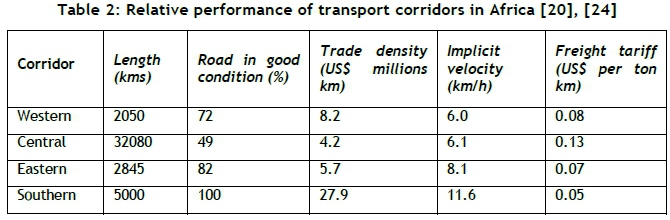
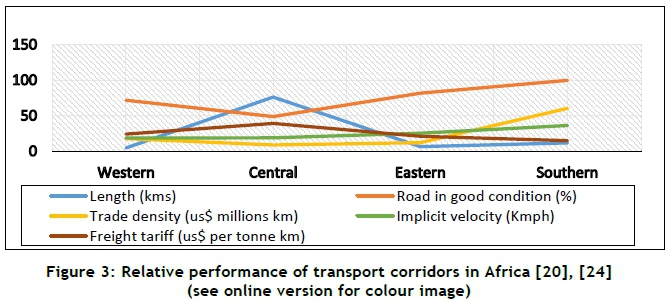
In this "increasingly becoming money rich and time poor" [25] world, developing an effective transportation system reduces congestion, pollution, accidents, financial deficits, pockets of poor access, potholed roads, etc. It also increases accessibility between nations within the region. The roads in many countries are currently poorly maintained and in disrepair, with the skills and resources necessary to upgrade transport generally lacking. Table 2 shows the performance of transport corridors in Africa. Table 2 and Figure 3 indicate that, when the roads are in a good condition, trade density and the implicit velocity increases, while the freight tariff decreases (southern corridor). When the roads are not well-maintained, the trade density and the implicit velocity both decrease, while the freight tariff is the highest of the four corridors (central corridor). The region's future transportation systems should respond to the rising disaster concerns. For instance, the distance of the trip impacts on the trade density and the freight tariff, while the road condition affects the scheduling of the reception and condition of the freight received.
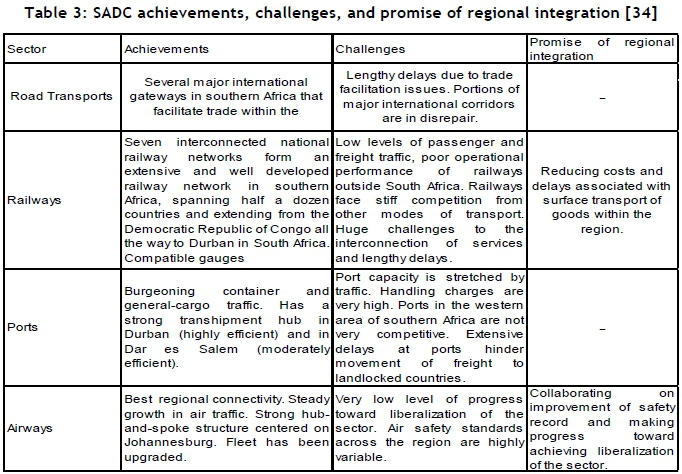
Table 3 illustrates the Africa Infrastructure Country Diagnostic (AICD) analysis of infrastructure in Africa, including the SADC regions, between 2001 and 2006 [34].
Although road transportation is subject to high risk and low reliability [26], and is the second largest overhead cost to humanitarian organisations after personnel [28], [29], Balcik et.al [6] predict that road transportation will remain the cornerstone of 'last mile' distribution for the foreseeable future.
3 RESEARCH METHODOLOGY
This paper champions a SADC region with a cost-effective supply chain for disaster rather than one with a logistical response to a disaster [30]. In order to achieve this, the research began with an extensive review of the literature on humanitarian supply chains, and by collecting data from disaster management databases. This method helped to identify the areas of highest risk within the southern African region (see Table 2.1). Statistical data on the history, type, and magnitude of different disasters were available from the CRED. The literature review alone identified enormous challenges, among them the lack of collaboration, the lack of standards and indicators, inadequate training of disaster personnel and volunteers, (low) recognition of logistics, and inadequate infrastructure and transportation systems [31]. A survey was distributed to relief and church organisations that are actively involved in disaster response in the SADC region. Their responses were added to the data collected from multiple other sources to increase the depth of the study and thus its external validity [27], and to increase its construct validity [37]. The survey feedback was not included in the findings of this paper, as the main function of the survey was to establish a common conceptual understanding of the relief organisations on the ground and to validate the data collected.
The transportation problems for disaster situations are complicated. The optimisation target is usually not unique. There is often a need to take these optimisation objectives of cost and time into account [35]. According to Vignaux and Michalewicz [32], transportation problems seek to determine a minimum-cost transportation plan for a single commodity from a number of sources to a number of destinations.
3.1 Linear programming problem
Linear programming (LP) is a widely used mathematical modelling technique designed to assist decision-makers in planning and resource allocations [39]. According to Render, Stair, and Hanna [39], this technique has very little to do with computer programming. (The word 'programming' in science refers to modelling or solving a problem mathematically.) To develop such a model, the following information is critical:
1. A list of the origins.
2. A list of destinations and each destination's demand per period.
3. The unit cost of shipping items from each origin to each destination.
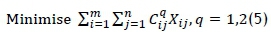
Considering all this, the linear programming problem (LP) is represented as follows: A load product is transported from each of m sources to n destinations. The sources are relief organisation facilities, warehouses, or supply points, characterised by available capacities ai, for i = 1,2,3,4,5,6,7,..., m. The destinations are disaster consumption facilities, warehouses, or demand points, characterised by required levels of demand bj, for j = 1,2,3,4,5,6,7,..., n. For the transportation time and cost to meet the minimum value simultaneously, the LP minimisation zp needs to be formulated as follows:

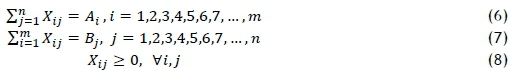
Subject to:

with Cij(t) as the unit cost of transportation from supply point i(i = 1,2, ..., m) to demand point j(j = 1,2, ..., n), when the duration allowed for the transportation is t units and the destination quantities for each country is q units. Now, setting Xijto be the variable denoting the amount transported from supply point i to demand point j, let aibe the availability at source points i and bjthe demand at demand point j.
The transportation problem (TP) input data could be expressed as intervals instead of point values. According to Jimenez and Verdegay [38], intervals are needed when uncertainty exists in a data problem, which is often the case in a disaster response situation. And decision-makers are more comfortable expressing it as intervals. In this exercise, Jimenez and Verdegay [38] have considered the TP in which intervals appear only in the constraint set - i.e., in the supply-and-demand capacities, using equality constraints. The formula could be interpreted as follows:
Subject to:
where 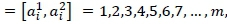 m, Bi =
  , ..., n are intervals of possible values for the supply-and-demand capacities respectively, and relation = j is formally defined as

3.2 Genetic algorithm based on a spanning tree
A genetic algorithm is an evolutionary technique that constantly searches for the best solutions and varies them until the research results are concluded [33]. Bryant and Benjamin further describe a genetic algorithm as a "new optimization technique which can be applied to various problems, including those that are NP-hard (non-deterministic polynomial-time hard)" [33].
To solve an algorithm problem, Van Wassenhove and Pedraza Martinez [28] and Xiangyu, Yan, and Chunyu [35] adopted a genetic algorithm coding method based on prüfer numbers of a spanning tree in order. From the coding method finding, Van Wassenhove and Pedraza Martinez [28] designed an adaptive weight multiple-objective genetic algorithm [35].
According to Gen and Li [36], during the solving of a transportation problem, the spanning tree-based GA saved more computational time than the matrix-based GA, and it had a higher solution quality.
A matrix is the most natural representation of a solution for a transportation problem. The transportation problem matrix is written as follows:
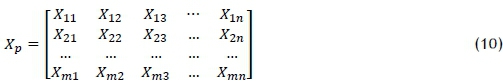
where Xp denotes the pth chromosome (solution) and Xij is the corresponding decision variable.
3.2.1 Coding method
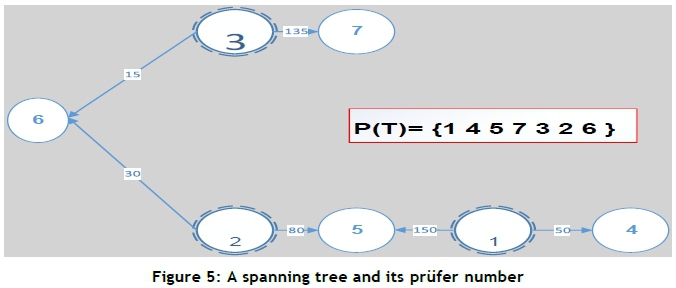
The transportation tree can be represented as a spanning tree with a prüfer number. To complete constructing prüfer numbers P (T), Xiangyu et.al [35] suggest a gradual process. To code a transportation tree, first record a non-leaf node that directly connects a minimum leaf node, and then remove the minimum leaf node from the transportation tree. The process needs to be done until only two nodes are left in the tree. Leaf nodes are marked out with dotted line circles in the chart below. The overall process of constructing prüfer numbers is detailed in the results section.
3.3 Linear optimisation using Excel Solver
Linear programming is an extremely powerful tool to address a wide range of applied optimisation problems. The developed model is associated with the total transportation cost and the total transportation time by setting a limit on time while optimising the cost.
3.3.1 Constraint development
Constraints must be set because finding real-life time and cost optimal points is too cumbersome. Five constraints have been generated from the study. These constraint are as follows:
1. Transportation time cannot exceed the decided maximum reaction time.
2. Transportation cost must be minimised.
3. The transportation quantity has to exceed or equal the demand.
4. The transportation quantity from each country cannot exceed its own supplier quantities.
5. The transportation time must exceed zero.
3.3.2 Variables
The variables are the entire SADC region, comprising 15 countries that will be shipping and receiving, with the cost multiplied by time (C X T= V). Due to the obviously larger number of variables required in this model, this minimisation problem is too cumbersome to solve manually or with a calculator. The problem constraints and variables are used in the EXCEL Solver optimisation tool to obtain the optimal cost for the different time:

Subject to:
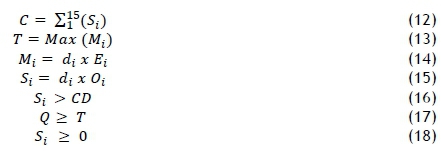
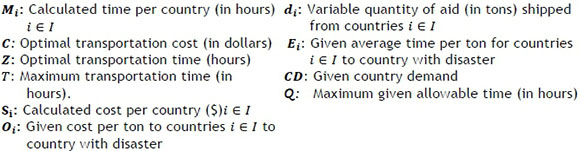
Constraint (11) denotes the optimal cost of the transportation from supply points i to a demand point j, while constraint (13) denotes the maximum time it takes for a supply to reach its demand point. Constraint (14) denotes a calculated time per country (in hours) by considering the given time per ton for countries and the quantity of aid (tons) shipped from countries. Constraint (15) denotes a calculated cost per country by considering the given time per ton for countries and the quantity of aid shipped from countries. Constraint (16) denotes that the calculated cost per hour is superior to the country demand, while constraint (17) clarifies that the maximum given allowable time (in hours) is superior to the maximum transportation time. Lastly, constraint (18) specifies that the calculated cost per countries is superior to zero.
With:
4 RESULT
4.1 Linear programming problem
Using the LP problem methods detailed in section 3.1, some constraints, some facts, and some assumptions were included in the model development. The supply and demand quantity for each of the 15 countries included in this transportation problem are imposed based on the countryside and disaster history. The transportation time and distance are obtained using historical data and Google maps. The countries are categorised based on their geographical position (inland, coastal, or island countries), and their supply (warehouses) and demand quantities. The cost of transportation of goods by road is determined by the quantity, the distance to be covered, and the road quality from origin to destination. As for air and marine transportation, the distance and the good quantity of goods determine the cost. "Transportation of goods using trucks in the SADC Region cost between $120 and $280 per tonne, while air transportation varies between $4000 and $6000 per tonne" [20]. Including all the variables and constraints, this proposed model appears too large to compute manually or with a calculator. The next point adapts this proposed problem by reducing the countries from 15 to four for demanding, and to three for supplying, a predetermined amount of relief.
4.2 Genetic algorithm
4.2.1 Method based on a spanning tree
Using a spanning tree is another alternative to finding an optimal solution for a transportation problem. To develop the spanning tree representation, Gen and Li [36] denote plants 1, 2, 3, m as the components of the set of origins S = {1,2, 3, m} and consumers 1, 2, 3, 4, n as the components of the set of destinations D = {m + 1, m + n} [36]. Suppliers S1, S2, S3, S4, S5, S6, S7, S8, S9, S10, S11, S12, S13, S14, S15 are defined as elements of the set S ={1, 2, 3, 4, 5, 6, 7, 8, 9, 10, 11, 12, 13, 14, 15}; sale or use departments D1, D2, D3, D4, D5, D6, D7, D8, D9, D10, D11, D12, D13, D14, D15 are defined as elements of the set D={15+1,15+2,15+3,15+4,15+5,15+6, 15+7, 15+8, 15+9, 15+10, 15+11, 15+12, 15+13, 15+14, 15+15}= {16,17,18,19,20, 21, 22, 23, 24, 25, 26, 27, 28, 29, 30}. The transportation problem has 15x15=225 nodes in its spanning tree. It may have 15x15=225 different edges. For a complete graph of p nodes, it may have pp - 2 trees of different node label permutations. The node that only connects on one edge is called the leaf of the tree. Any tree has at least two leaves.
With demand quantities D2, D8, D10, D15 to supply to respective countries Botswana (D2, S2), Mozambique (D8, S8), Seychelles (D10, S10), and Zimbabwe (D15, S15). Suppliers S1, S7, S9 are defined as elements of the set S ={1, 2, 3}; sale or use departments D2, D8, D10, D15 are defined as elements of the set D={3+1,3+2,3+3,3+4}={4, 5, 6, 7}. To find an initial transportation solution, Table 4 shows the North West Corner rule solution.

Figure 4 below is a graphical representation of the quantity allocation.
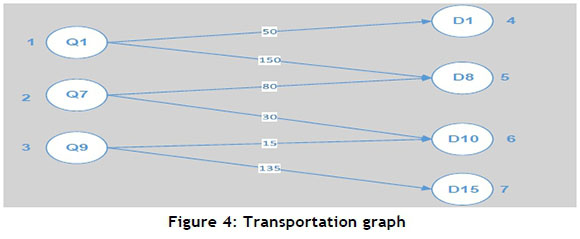
Figure 5 is a spanning tree, and its prüfer number is described in detail in the transportation graph (Figure 4):
A prüfer number could also be found using a gradual process, as shown in Figure 6 below:

4.2.2 Decoding method
The first step in the decoding method of Xiangyu et Al. [35] is to connect the minimum considering node in the set  (T) =
(T) =  to the leftmost number of P(T), and then remove the leftmost number of P(T). This process needs to be done gradually every time to construct a transportation tree. In the spanning tree below, the numbers underlined in P(T) are the nodes that have been added to the tree. When P(T) = Ø, directly connecting two considering nodes in P(T) to complete the construction of a transportation tree. The process of converting prüfer numbers into a transportation tree is shown in Figure 7:
4.3 Linear optimisation model
The EXCEL optimisation tool is a simple but effective model to determine the optimal point in terms of transportation cost and time for delivery. This Excel optimisation tool option offers users the shortest routing to the destination, and includes the lowest cost for delivery. Using a similar scenario, suppliers S1, S2, S3, S4, S5, S6, S7, S8, S9, S10, S11, S12, S13, S14, S15 are defined as elements of the set S ={1, 2, 3, 4, 5, 6, 7, 8, 9, 10, 11, 12, 13, 14, 15}; and sale or use departments D1, D2, D3, D4, D5, D6, D7, D8, D9, D10, D11, D12, D13, D14, D15 are defined as elements of the set D={15+1, 15+2, 15+3, 15+4, 15+5, 15+6, 15+7, 15+8, 15+9, 15+10, 15+11, 15+12, 15+13, 15+14, 15+15}= {16, 17, 18, 19, 20, 21, 22, 23, 24, 25, 26, 27, 28, 29, 30}. With the known supply and demand quantities, transportation costs, travelling times, and distances between countries, the goal of this model is to identify which scenario gives the research an optimal point, or the most valuable decision to make between the cost/time/country involved in the trade-off. The three scenarios are 1) dividing the cost x time by the number of countries involved (Figure 8); 2) multiplying the cost by the time (Figure 8); and 3) dividing the cost by the number of countries involved (Figure 9).
4.3.1 The variation of time for the original cost optimisation
The graph in Figure 8 gives the study a visual illustration of the results obtained in the model. It is logical that the more urgent the disaster need, the faster the relief is required, and the more expensive the transportation cost is. Figure 8 shows that the original cost method is unfavourable because the transportation time and cost increase simultaneously.
4.3.2 Cost x Time trade-off
The Cost x Time equation gives the researcher the best possible decision. Looking at the graphical representation in Graph 4.1, the yield shows the following: (1) longer times with lower costs are unfavourable; (2) higher costs with lower times are also unfavourable; and (3) a point near the optimal time can be achieved by minimising cost and maximising the given allowable time.
4.3.3 Value generated from Cost x Time divided by the number of countries involved and cost divided by the number of countries involved
This process gives this study a clear numerical view of the best possible decision to be made in the best possible time and in a cost-effective way. Figure 9 shows in this scenario that increasing the cities or countries involved simultaneously decreases the response time and cost. Under this scenario, the optimisation of time and cost is reached.
5 CONCLUSION
This research reviewed the literature, and used historical data and a survey in order to identify the current state of preparedness of the region for the inevitable eventuality of a disaster. The cited sources shed light on the role that infrastructure and the transportation system play in assisting relief organisations to distribute on-time relief to victims in pre- and post-disaster periods, especially in populated areas. The paper also acknowledges that selecting an appropriate transportation model could save time and money, and ultimately save lives. This paper has proposed three models to solve the SADC region's transportation problem, taking the infrastructural and transportation challenges into consideration. Each of these models has defined strengths and areas of particular differences.
Of the SADC real-life cases studied in this paper, the linear programming model targeted a cost-effective route from origins to supplies, while the spanning tree-based genetic algorithm solved the shortest delivery route by minimising both time and cost. Another key aspect of the spanning tree-based genetic algorithm considered the demand/supply quantity, while the linear optimisation model included the time/distance of delivery and factors such as cost/quantity and the geographical representation (inland, coastal, or island) of each of the 15 SADC countries studied.
The reviewed literature and historical data acknowledge that poor infrastructure and road conditions have an impact on the disaster response schedule, the condition of the freight received, and the recurring operations on the ground [20], [24]. The statistical data from CRED revealed that countries with more advanced infrastructure have had fewer fatalities in disaster events. Although each transportation problem had its own particularities, they all reveal that, when more countries are involved in disaster supplies in the SADC, the response time and cost decrease.
Assumptions were made on the supply/demand quantities. The study did not consider additional real-life variables such as the time and cost of border gate delays, and vehicle breakdown.
REFERENCES
[1] Tatham, P. and Houghton, L. 2011. The wicked problem of humanitarian logistics and disaster relief aid. Journal of Humanitarian Logistics and Supply Chain Management, 1(1), pp. 15-31. [ Links ]
[2] Kovács, G. and Spens, K. 2009. Identifying challenges in humanitarian logistics. International Journal of Physical Distribution & Logistics Management, 39(6), pp.506-528. [ Links ]
[3] Centre of Research on the Epidemiology of Disasters website (CRED). 2013. Southern Africa disasters database. 26/09/2013. http://www.em-dat.net. [ Links ]
[4] Lancet, T. 2010. Growth of aid and the decline of humanitarianism. The Lancet, 375. [ Links ]
[5] Thomas, A. 2004. Elevating humanitarian logistics. International Aid and Trade Review, Special edition, pp.102-106. [ Links ]
[6] Balcik, B., Beamon, B.M. and Smilowitz, K. 2008. Last mile distribution in humanitarian relief. Journal of Intelligent Transportation Systems, 12(2), pp.51-63. [ Links ]
[7] Strawderman, L. and Eksioglu, B. 2009. The role of intermodal transportation in humanitarian supply chains final report. [ Links ]
[8] Thomas, A. and Mizushima, M. 2005. Logistics training: Necessity or luxury? Forced Migration Review, 22(22), pp.60-61. [ Links ]
[9] Benson, C. and Clay, E.J. 2004. Understanding the economic and financial impacts of natural disasters. World Bank Publications. [ Links ]
[10] Samii, R. 2008. Leveraging logistics partnerships: Lessons from humanitarian organizations (No. EPS-2008-153-LIS). Erasmus Research Institute of Management (ERIM). [ Links ]
[11] Tatham, P., Spens, K. and Oloruntoba, R. 2009. Cyclones in Bangladesh: A case study of a whole country response to rapid onset disasters. In Proceedings of the 20th annual conference of the Production and Operations Management Society, Orlando, Florida, pp. 1 -4. [ Links ]
[12] Kovács, G. and Spens, K.M. 2007. Humanitarian logistics in disaster relief operations. International Journal of Physical Distribution and Logistics Management, 37(2), pp.99-114. [ Links ]
[13] Cassidy, W.B. 2003. A logistics lifeline, Traffic World, October 27, p.1. [ Links ]
[14] Murray, S. 2005. How to deliver on the promises: Supply chain logistics: Humanitarian agencies are learning lessons from business in bringing essential supplies to regions hit by the tsunami, Financial Times, January 7, p.9. [ Links ]
[15] Van Wyk, E. and Yadavalli, V.S 2011. Application of an euclidean distance algorithm for strategic inventory management for disaster relief in the SADC. In Proceedings of the 41st International Conference on Computers and Industrial Engineering, pp. 23-27. [ Links ]
[16] Long, D.C. and Wood, D.F. 1995. The logistics of famine relief. Journal of Business Logistics, 16(1), pp.213-29. [ Links ]
[17] Hills, A. 1998. Seduced by recovery: The consequences of misunderstanding disaster. Journal of Contingencies and Crisis Management, 6(3), pp.162-170. [ Links ]
[18] Altay, N. and Green, W.G. III. 2006. OR/MS research in disaster operations management. European Journal of Operational Research, 175(1), pp.475-493. [ Links ]
[19] World Bank Annual Report. 2013. http://siteresources.worldbank.org/EXTANNREP2013/Resources/9304887-1377201212378/9305896-1377544753431/1_AnnualReport2013_EN.pdf. [ Links ]
[20] Ranganathan, R. and Foster, V. 2011. The SADC's infrastructure: A regional perspective. [ Links ]
[21] Calderón, C. 2009. Infrastructure and growth in Africa. [ Links ]
[22] Jacob, K.H., Edelblum, N. and Arnold, J. 2000. Risk increase to infrastructure due to sea level rise. Climate change and a global city: An assessment of the Metropolitan East Coast Region, pp. 17-30. [ Links ]
[23] Hilling, D. 1996. Transport and developing countries. Psychology Press. [ Links ]
[24] Teravaninthorn, S. and Raballand, G. 2009. Transport prices and costs in Africa: A review of the main international corridors. World Bank Publications. [ Links ]
[25] Willumsen, L.G. and Juan de Dios Ortrizor. 2011. Modelling transport. Wiley. [ Links ]
[26] Hamedi, M., Haghani, A. and Yang, S. 2012. Reliable transportation of humanitarian supplies in disaster response: Model and heuristic. Procedia - Social and Behavioral Sciences, 54, pp. 1205-1219. [ Links ]
[27] Meredith, J. 1998, Building operations management theory through case and field research, Journal of Operations Management, 16(4), pp.441-54. [ Links ]
[28] Van Wassenhove, L.N. and Pedraza Martinez, A.J. 2012. Using OR to adapt supply chain management best practices to humanitarian logistics. International Transactions in Operational Research, 19(1-2), pp.307-322. [ Links ]
[29] Disparte, D. 2007. The postman's parallel. Car Nation, 2, pp.22-27. [ Links ]
[30] Hale, T. and Moberg, C.R. 2005. Improving supply chain disaster preparedness: A decision process for secure site location. International Journal of Physical Distribution and Logistics Management, 35(3), pp.195-207. [ Links ]
[31] Fritz Institute. 2004, Humanitarian logistics conference - Africa region 2004, Proceedings of the Nairobi, available at: www.fritzinstitute.org/prgSC-HLCaf2004-proceedings.htm (accessed September 10, 2007). [ Links ]
[32] Vignaux, G.A. and Michalewicz, Z. 1991. A genetic algorithm for the linear transportation problem. Systems, Man and Cybernetics, IEEE Transactions on, 21(2), pp.445-452. [ Links ]
[33] Bryant, K. and Benjamin, A. 2000. Genetic algorithms and the traveling salesman problem. Hervey Mudd College. [ Links ]
[34] Africa Infrastructure Country Diagnostic. 2013. World Bank website. http://data.worldbank.org/data-catalog/africa-infrastructure. [ Links ]
[35] Xiangyu, C., Yan, Z. and Chunyu, A. 2012. Application of improved genetic algorithm in solving a type of connector transportation problem based on MATLAB. In Proceedings of the International MultiConference of Engineers and Computer Scientists (2). [ Links ]
[36] Gen, M. and Li, Y. 1999. Spanning tree-based genetic algorithm for the bicriteria fixed charge transportation problem. In Proceedings of the 1999 Congress on Evolutionary Computation, 1999, CEC 99 (Vol. 3). IEEE. [ Links ]
Ellram, L.M. 1996. The use of the case study method in logistics research, Journal of Business Logistics, 17(2), pp.93-138. [ Links ]
[38] Jimenez, F. and Verdegay, J.L. 1998. Uncertain solid transportation problems. Fuzzy Sets and Systems, 100, pp.45-57. [ Links ]
[39] Render, B., Stair, R.M. Jr and Hanna, M.E. 2006. Quantitative analysis for management. 9 edition. [ Links ]
Submitted by authors 30 Jul 2015
Accepted for publication 11 Jul 2017
Available online 31 Aug 2017
* Corresponding author: jeanb@dut.ac.za

