


Services on Demand
Article
 English (pdf)
 Article in xml format
 Article references
Indicators

Related links
-
 Cited by Google
 -
 Similars in Google
Share

 Permalink
South African Journal of Industrial Engineering
On-line version ISSN 2224-7890
Print version ISSN 1012-277X
S. Afr. J. Ind. Eng. vol.28 n.2 Pretoria Aug. 2017
http://dx.doi.org/10.7166/28-2-1353
GENERAL ARTICLES
Process capability index-based control chart for variables
O.A. AdeotiI, II, *; J.O. OlaomiI
IDepartment of Statistics, University of South Africa
IIDepartment of Statistics, Federal University of Technology, Akure, Nigeria
ABSTRACT
This paper proposes a process capability index-based control chart for variables using the Downton estimator with a specified Cpvalue. The proposed chart is able to address the issue of control and capability simultaneously. We also provide a control chart constant to construct the process capability index-based control chart. A numerical example is presented to demonstrate the application of the proposed chart, and the effect of non-normality is discussed. The result shows that the proposed control chart performs better in monitoring and assessing processes, and eliminates the usual two-stage procedure reflected in the literature.
OPSOMMING
'n Prosesvermoë indeksgebaseerde beheerkaart word voorgestel vir veranderlikes met gebruik van die 'Downton' beramer met 'n gespesifiseerde Cp waarde. Die voorgestelde beheerkaart kan die kwessie rondom die beheer en vermoë gelyktydig aanspreek. 'n Beheerkaartkonstante word ook verskaf om die prosesvermoë indeksgebaseerde beheerkaart te skep. 'n Numeriese voorbeeld word voorgehou om die toepassing van die voorgestelde beheerkaart te illustreer. Die effek van nie-normaliteit word ook bespreek. Die resultaat toon dat die voorgestelde beheerkaart beter vertoon in die monitering en assessering van prosesse en dit elimineer die gewone twee stap prosedure wat in die literatuur gevind word.
1 INTRODUCTION
An organisation's desire to increase its profit margin often leads to greater competition, with the focus on reducing variability in the process, and on manufacturing products that meet the organisation's specifications and the expectation of the customers. To achieve this, the process must first be made stable; following this, a sampling inspection is sometimes instituted to ascertain the quality of the product. However, it is observed that the stability of a process does not necessarily translate into a product meeting the specifications of the organisation or the end-users.
In order to establish the stability of the process, control charts are employed to detect assignable causes of variation and, where they exist, these are identified and corrective action is taken. When the control chart establishes the stability of the process, especially retrospectively, they are then deployed for future monitoring of the process. It is worth stating that control charts can also be used to examine whether the process is capable of producing acceptable products that meet the specifications, so that the return of products is minimised. This is achieved when the control chart is used together with the process capability indices. Different process capability indices have been proposed by different researchers. A detailed review of process capability indices can be seen in Kotz & Johnson [1], and a bibliography of process capability papers is found in Spiring, Leung, Cheng & Yeung [2] and Yum and Kim [3].
The usual underlying distribution assumptions about process capability indices are that they are based on the normal distribution of process output. However, in practice, most quality characteristics violate the normality distribution assumptions, and the accuracy of capability indices such as Cp and Cpk (which are widely used) become doubtful and often lead to an erroneous interpretation of the process capability. Montgomery [4] stated: "If the underlying distribution is non-normal, then statements about expected process fallout attributed to a Cp value may be in error and one approach is to transform the data so that transformed data have a normal distribution". However, it is difficult to interpret the capability of the process in terms of the original data when using the transformed data. Many researchers have considered methods to determine the process capability of a non-normal process output. (See Chan, Cheng & Spiring [5]; Clements [6]; Rodrigues [7]; English & Taylor [8]; Castagliola [9]; and Chang, Choi & Bai [10].)
Although the process capability indices (PCIs) can be used to predict the performance of the process, they do not give information about its stability (i.e., whether it is in-control or out-of-control). They are only applicable after the process has been brought into a state of statistical control using control charts. This is usually a two-stage procedure during which the performance of the process is assessed for stability and capability.
In this paper, we develop a single control chart that can determine the stability of the process and assess its capability for variables, based on the specified process capability index Cp, using the Downton statistic as the estimate of the process standard deviation σ. The performance of the proposed chart is compared with the usual two-stage procedure of using control charts (𝑋̅ and R) and the Cpindex.
The process capability index Cpand the Downton statistic, as an unbiased estimator of σ, are given in Sections 2 and 3. The derivation of the control limits and necessary control chart constants for n < 10 are given in Section 4. Numerical examples of real-life data and simulated non-normal process data to demonstrate the proposed chart superiority are given in Sections 5 and 6. Section 7 gives the conclusion of the study.
2 THE CpINDEX
The capability index Cpis presented in the literature as forming a complementary measure of process performance; but it does not address the issue of statistical control. It is defined for a quality characteristic with upper specification limits (USL) and lower specification limits (LSL) as

where 6σ is the basic definition of process variability. In an industrial application, the process standard deviation σ is almost always unknown and is estimated from process data. To estimate the process variability σ, either  is computed when variable control charts are to be used in the capability study. A Cp>1 is often desirable [11], which means that relatively few non-conforming items will be produced by the process.
3 DOWNTON ESTIMATOR
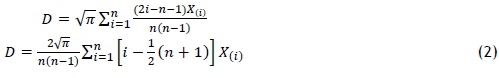
The Downton estimator was first introduced by Downton [12] as an estimator for the standard deviation of a normal population. Barnett, Mullen & Saw [13] showed that Downton's statistic is an unbiased estimator of σ . Let X1,X2,... ...Xnrepresent a random sample of size n from a normal distribution with mean μ and standard deviation σ; that is, let X~N(μ,σ2) and the corresponding order statistic be denoted by X(1),X(2),... ...X(n) where X(1)<X(2)... ... . .<X(n). The Downton's estimator is defined ([12], [14], [15], [16]) as
Abbasi and Miller ([15], [16]) developed a control chart for process variability σ, based on the Downton statistic, where the unbiased estimator for σ is given as  , which is used in this study.
 for m is a preliminary number of the subgroup, and D is defined as in (2).
4 DESIGN OF PROPOSED CONTROL CHART WITH SPECIFIED Cp
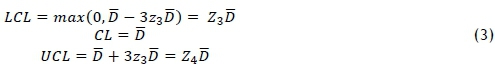
In this section we describe the control chart limits for the process mean and variability, based on the Downton estimator (following the idea of Abbasi and Miller ([15], [16]), and Adeoti, Olaomi & Adekeye [17]). The knowledge of the control chart limits is used to derive the process capability index-based control chart. The control chart limits for variability, based on the Downton statistic - known as the D chart and derived by Abbasi and Miller ([15], [16]) are given as:
The corresponding control chart limits for the mean derived by Adeoti, Olaomi & Adekeye [17] are given as
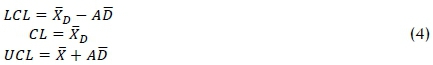
where
Recall that we defined Cpin (1) as  . So an unbiased estimator of σ , defined by Abassi and Miller [15], is used in (1). Thus, Cpbecomes

From (5) we obtain

Subtituting (6) into (3) and (4), we obtain control limits for the variability chart as
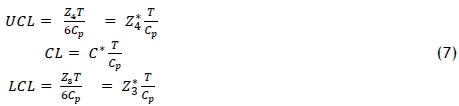
The control limits of the corresponding mean chart are given as
where 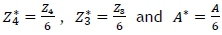
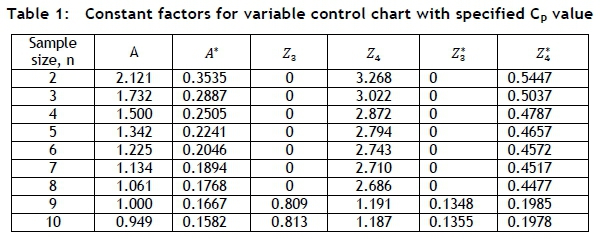
The value of  , and A* for sample size n (2 < n < 10) are presented in Table 1. The proposed control charts can be used to evaluate the stability of the process and to measure the capability of the process for a specified Cpvalue.
5 ILLUSTRATION
A real-life data set is taken from a hard-bake process, used with photolithography in a semiconductor manufacturing process described by Montgomery [4]. This data is applied to demonstrate the application of the proposed chart based on the Downton's estimator. Twenty-five samples, each of size 5, are taken to monitor the process. The summary statistics for the 25 subgroups are given in Table 2.

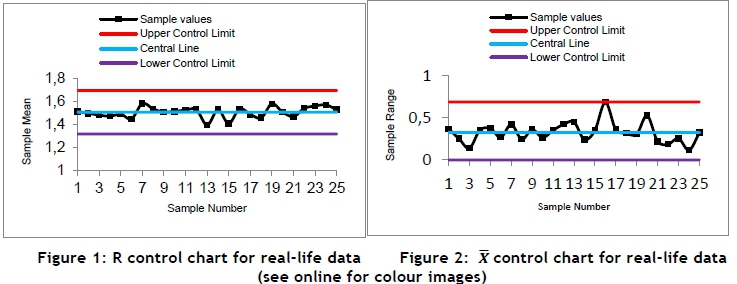
Now, to assess the capability of the process - assuming that the USL and the LSL are given as USL=2.00 and LSL=1.00 - the usual two-stage procedure is to use the control chart to assess the stability of the process. The capability index Cpis then used to assess the process capability once the process is stable. We obtained the following control limits for  and R charts and the Downton statistic-based charts
  and D as follows:

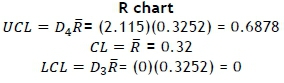
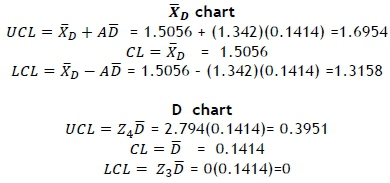
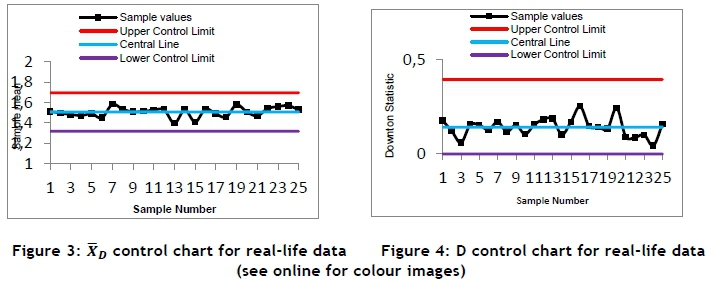
Figures 1 and 2 show that the process is in-control (stable) for  and R charts, and Figures 3 and 4 also show that the process is in-control (stable) for the
  and D control charts, as none of the sample points plot beyond the control limits; a capability study can thus be undertaken on the process.
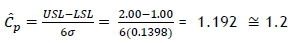
The Cpindex for  and R charts is obtained as

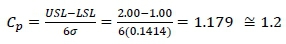
while the corresponding Cpindex for  and D control charts is obtained as

The process is capable of producing acceptable products that meet the specifications for both charts, since Cp>1 [11].
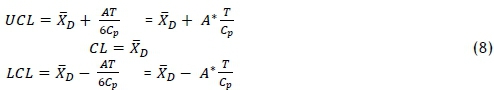
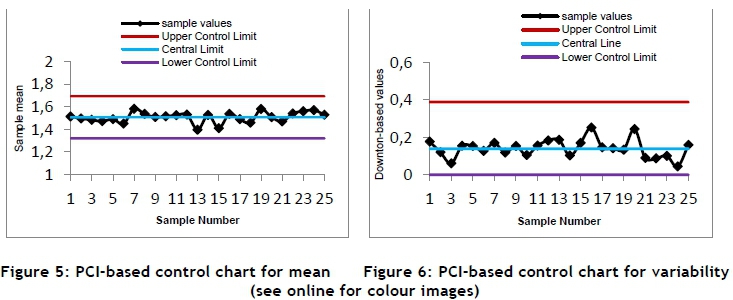
We now apply our proposed single process capability index-based control chart in (7) and (8) with a specified Cpvalue of 1.2, which would have been obtained, assuming the usual two-stage procedure, to demonstrate the application of the proposed method. The control chart limits are given as:

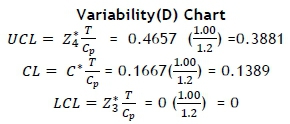
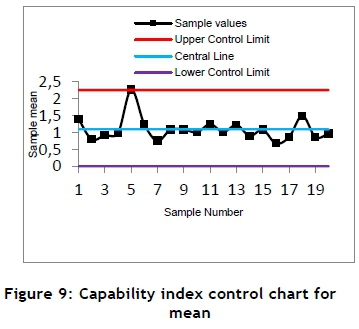
Figures 5 and 6 are control charts to monitor the mean and variability of the process using the proposed control charts. It is important to note that if any sample(s) of the process is(are) beyond the control limits, this implies that the process data is unstable and incapable of producing products to meet the organisation's specifications. In this example, none of the sample numbers exceeded the control limits, so the process is stable (in-control) and can meet the organisation's specifications.
6 EFFECT OF NON-NORMALITY
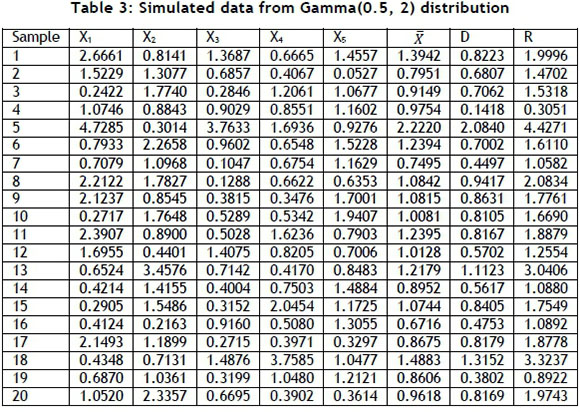
In the literature, the assumption for using the capability index is that it is normal; so we now evaluate the performance of our proposed chart when there is a deviation from the normality assumption. To achieve this, a non-normal process environment - a gamma distribution - is simulated using MATLAB 7.10, presented in Table 3.
Now, assuming that USL=6.5 and LSL=1.5, we wish to have a Cpvalue of 1 (since Cp> 1 is desirable). The control chart limits using the  and R control charts are given as follows:


It is clearly seen from Figures 7 and 8 that the process is not stable (out-of-control). Process capability studies can therefore not be undertaken, as they are affected by a deviation from normality. However, applying our proposed single control chart, the mean control chart limits are given as
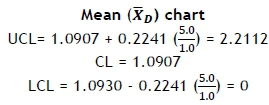
The corresponding variability control chart limits are given as
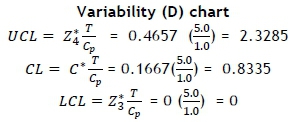
It is evident that the proposed method is not affected by a departure from normality in Figures 9 and 10. It is able to assess the capability of the process as long as the specification limits can be adjusted and the minimum Cpvalue of 1 for capability is assured. It can thus be used effectively to monitor and assess the capability of a process without the two-stage procedure of separately monitoring and then assessing the capability of a non-normal process situation. Moreover, it allows management to adjust either the given specification limits or the Cpvalue so that the process can be seen to be stable; and it has the potential to manufacture products meeting the specifications. Considerable time needed by operators (practitioners) is thus saved. A method where capability determines stability, as opposed to stability determining capability (which is available in the literature), is thus derived.

7 CONCLUSION
In this paper we have proposed a single control chart to monitor and assess the capability of the process. The method involved the use of the process capability index, based on estimating the process standard deviation using Downton's statistic. The proposed chart is effective for monitoring and assessing the capability of a process, as it eliminates the two-stage procedure of stability and capability. It also allows management to vary the specification limits to achieve stability and capability, as long as the minimum capability index value is achieved. Finally, it is effective for normal and non-normal process situations. We hope that operators will be encouraged to adopt the single process capability-based control chart using Downton's statistic for online monitoring of normal and non-normal processes and capabilities of processes.
REFERENCES
[1] Kotz, S. & Johnson, N.L. 2002. Process capability indices: A review, 1992-2000. Journal of Quality Technology, 34, pp. 2-19. [ Links ]
[2] Spiring, F.A., Leung, B., Cheng, S.W. & Yeung, A. 2003. A bibliography of process capability papers. Quality and Reliability Engineering International, 19, pp. 445-460. [ Links ]
[3] Yum, B.J. & Kim, K.W. 2011. A bibliography of the literature on process capability indices: 2000-2009. Quality and Reliability Engineering International, 27, pp. 251-268. [ Links ]
[4] Montgomery, D.C. 2009. Introduction to statistical quality control, 6th ed. John Wiley & Sons. USA. [ Links ]
[5] Chan, L.K., Cheng, S.W. & Spiring, F.A. 1988. A new measure of process capability: Cpm. Journal of Quality Technology, 20(3), pp. 162-175. [ Links ]
[6] Clements, J.A. 1989. Process capability calculations from non-normal distributions. Quality Progress, 22(9), pp. 95-100. [ Links ]
[7] Rodriguez, R.N. 1992. Recent developments in process capability analysis. Journal of Quality Technology, 24, pp. 176-187. [ Links ]
[8] English, J.R. & Taylor, G.D. 1993. Process capability: A robustness study. International Journal of Production Research, 31 , pp. 1621 -1635. [ Links ]
[9] Castagliola, P. 1996. Evaluation of non-normal process capability indices using Burr's distributions. Quality Engineering, 8, pp. 587-593. [ Links ]
[10] Chang, Y.S., Choi, I.S. & Bai, D.S. 2002. Process capability indices for skewed populations. Quality and Reliability Engineering International, 18, pp. 383-393. [ Links ]
[11] Kane, V.E. 1986. Process capability indices. Journal of Quality Technology, 18(1), pp. 41-52. [ Links ]
[12] Downton, F. 1966. Linear estimates with polynomial coefficients. Biometrika, 53, pp. 129-141. [ Links ]
[13] Barnett, F.C., Mullen, K. & Saw, J.G. 1967. Linear estimates of a population scale parameter. Biometrika, 54, pp. 551-554. [ Links ]
[14] Abu-Shawiesh, M.O. & Abdullah, M.B. 2000. Estimating the process standard deviation based on Downton estimator, Quality Engineering, 12(3), pp. 357-363. [ Links ]
[15] Abbasi, S.A. & Miller, A. 2011. D chart: An efficient alternative to monitor process dispersion. Lecture notes in Engineering and Computer Science. In: Proceedings of the World Congress on Engineering and Computer Science, Vol. II, WCECS, San Francisco, USA, 19-21 October, 2011, pp. 933-938. [ Links ]
[16] Abbasi, S.A. & Miller, A. 2013. An efficient dispersion control chart. Lecture notes in Electical Engineering. In IAENG Transactions on Engineering Technologies, H.K. Kim et al. (eds), Springer Science, pp. 61-70. [ Links ]
[17] Adeoti, O. A, Olaomi, J.O. & Adekeye, K.S. 2016. Control chart limits for monitoring process mean based on Downton estimator. Quality and Reliability Engineering International, 32(5), pp. 1731 - 1740. [ Links ]
Submitted by authors 9 Sep 2015
Accepted for publication 5 Apr 2017
Available online 31 Aug 2017
* Corresponding author oaadeoti@futa.edu.ng

