


Services on Demand
Article
 English (pdf)
 Article in xml format
 Article references
Indicators

Related links
-
 Cited by Google
 -
 Similars in Google
Share

 Permalink
South African Journal of Industrial Engineering
On-line version ISSN 2224-7890
Print version ISSN 1012-277X
S. Afr. J. Ind. Eng. vol.28 n.1 Pretoria May. 2017
http://dx.doi.org/10.7166/28-1-1507
CASE STUDIES
Application of lean tools in the supply chain of a maintenance environment
C.J. Fourie*; N.E. Umeh
Department of Industrial Engineering, Stellenbosch University, South Africa
ABSTRACT
Historically, Lean thinking has limited applications in the maintenance environment (that is, a non-manufacturing environment). This article reports on the Lean tools that can be implemented in the maintenance environment. To achieve this, a typical supply chain management of a rolling stock service organisation was used for analysis and validation. The approach was initially to map the current supply chain process through a standard method of value stream mapping so as to identify non-Lean activities. After mapping the current state, other suitable Lean tools for the current supply chain management were applied. Finally, performance Indicators were formulated for continuous review and assessment.
OPSOMMING
Tradisioneel word lenige denke nie in die instandhoudingsomgewing (nie-vervaardiging) toegepas nie. In hierdie artikel word verslag gedoen oor lenige metodes wat in instandhoudingstoepassings gebruik kan word. Om dit moontlik te maak, is die bestuur van 'n tipiese voorsieningketting in 'n rollende materiaal diensorganisasie gebruik vir analise en validasie. Aanvanklik is die bestaande voorsieningskettingproses grafies voorgestel deur gebruik te maak van 'n diagram van die waardestroom om sodoende die nie-lenige aktiwiteite te identifiseer. Hierna is ander relevante lenige metodes op die bestaande voorsieningsketting toegepas. Uiteindelik is prestasie indikatore geformuleer om deurlopende hersiening en assessering moontlik te maak.
1 INTRODUCTION
Lean thinking and methodology has had a varied impact in the manufacturing environment. However, despite its successful application in manufacturing industries, its applicability in non-manufacturing environments has been far lower [1]. In this article, lean tools that can be implemented in the maintenance environment (non-manufacturing environment) will be reported on. Rolling stock supply chain management (SCM) - a typical example of a maintenance environment - will be used for validation. Moreover, specific performance indicators will be formulated for subsequent measurement and review of supply chain activities and performance.
The research problem is to investigate the applicability of Lean tools in the rolling stock supply chain. In view of this, the following research questions arise:
-
What is the current state of the rolling stock SCM?
-
What Lean tools are suitable for this SCM?
-
What metrics can be used to evaluate the SCM performance?
The first three steps of the Lean DMAIC (Define-Measure-Analyse-Improve-Control) methodology will be used to structure the methodology. The case study used in this article will be discussed as the definition of the process. After this, the 'measure' and 'analyse' steps will be discussed through the application of appropriate Lean tools for the supply chain.
2 BACKGROUND
2.1 Supply chain management
Jonsson [2] describes supply chain management as being a process integration of upstream and downstream activities. Many large companies have found through experience that the supply chain as a whole includes more than simply moving material or products from one location to another. It also includes the movement of money and information, and the generation and use of knowledge. To expand on the description of the supply chain: it can also be called the process of a product life cycle, which consists of the flow of finance, information and knowledge with the single aim of satisfying customer requirements with physical products and services processed by several linked suppliers [3]. Daud [4] briefly describes the supply chain as an association of a network of distributors, transporters, retailers, storage facilities and participating suppliers linked to the product's production, delivery, and sale to the end-user. Many times this network consists of numerous companies that coordinate their activities to perform better than their competitors.
Lambert and Cooper [5] note that, in many corporate organisations such as 3M (formerly known as Minnesota Mining and Manufacturing), management had concluded that product flow optimisation cannot be reached without applying a process approach to the organisation.
Some of the identified key supply chain processes are given below:
• Customer service management
• Customer relationship management
• Order fulfilment
• Demand management
• Product development and commercialisation
• Procurement
• Manufacturing flow management
• Returns
2.2 Maintenance supply chain
Typical maintenance supply chains can be found in organisations that offer the service of maintenance, repair and overhaul (MRO). McLaughlin and Durazo-Cardenas [6] describe MRO as a comprehensive term that covers the necessary actions that are undertaken to ensure the smooth operation of equipment. It is particularly in the industries of aerospace and rolling stock that the nature of the MRO service is found [7].
Lee, Ma, Thimm and Verstraeten [8] state that the aviation industry does not make its money through the sale of aircraft but through the maintenance of its aircraft over a lifespan of 30 years. Aerospace MRO firms have assets that are used over a long period of time, and must therefore focus on continuous product performance.
Rolling stock is one of the most important cost components of a railway system. Thus it is important to coordinate rolling stock material to satisfy end-user requirements. Major important costs are the cost of power supply, acquisition of material, and rolling stock maintenance. A quality service to railway passengers can only be provided if decisions on the number of rolling stock in service are taken with the high cost in mind [9].
If considered in general, maintenance repair and overhaul (MRO) provides many benefits. In the aviation industry, Clegg [10] focuses on the benefits of web-based MRO, and claims that it has the potential to reduce the whole supply chain holding cost while also reducing down-time. Many other MRO benefits in the maintenance supply chain are described by Mathaisel [11], as discussed below:
-
Quality improvement: When potential problems are quickly identified and addressed early in a process, there will be minimal rework in the system and maximum improvement in the overall quality of the end product. MRO organisations can improve quality by 85 per cent and reduce defects by up to 20 per cent annually.
-
Productivity increment: With the application of Lean techniques, enterprises are allowed to produce more with available resources while eradicating non-value-added activities. MRO organisations can record an improvement in productivity of up to 30 per cent annually.
-
Customer satisfaction enhancement: MRO organisations that use Lean principles always deliver quality products to their customers earlier than demanded. Enhancing customer satisfaction can be accomplished by reducing lead times by as much as 90 per cent and increasing early delivery to close to 100 per cent.
-
Reduced operating cost: Through quality improvement, customer satisfaction, and productivity, MRO organisations that operate the Lean way can substantially reduce the cost of operations.
Many changes have taken place in the MRO industry over the years because of the challenges the industry has had to face [12]. Production goals were originally the challenges faced by MRO enterprises. First, the goals were driven by concentrating on essential skills. An industrial case study on the challenges of MRO was conducted in the Tennessee Valley Authority (TVA). Bailey and Helms [13] state that, in this MRO industry, faced with the drawbacks of the company's MRO inventory management, the maintenance unit at TVA had an in-built philosophy of excess: i.e., if one was good, two should be better. The risk in this kind of operation is that maintenance managers fail to develop a strategy for risk management, but instead avoid the risk of running out of stock.
Ayeni, Baines, Lightfoot and Ball [12] suggested that the MRO enterprise's overall challenges are presently different from what they were before. Apart from the primary goal of production, continual changes in market forces now require the MRO organisation to increase the margins between value and stock by considering every possible way to minimise effort and maximise operations efficiently - i.e., by optimisation and streamlining of business activities.
2.3 Lean principle
In searching for the most appropriate definition of 'Lean', the background of a company plays a major role. Ren [14] suggests that the use of the word 'Lean' can focus on principles, concept, or a type of ideology that can be applied to the activities and management guideline of an organisation. Daud [4] describes Lean as a way to create more value for customers using fewer resources - i.e., the process of maximising customer value while minimising waste.
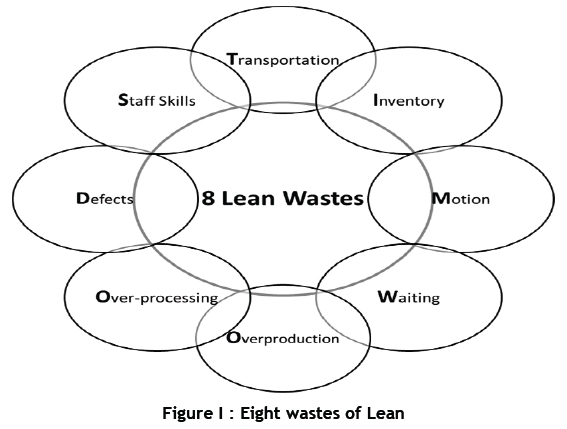
Seven kinds of waste were originally identified in the value stream, but more recently the waste caused by an employer's underuse of skills was added to the list (Figure 1).
The purpose of Lean application in a company as a whole is long-term development. Various Lean tools must be employed simultaneously to be effective, and they need to be improved continually. Bhasin and Burcher [15] suggest that it is advantageous for an organisation to use most or all of the tools rather than practising only one or two. Listed below are some of the Lean tools that organisations can use to achieve improvement:
• Value stream mapping
• Eight waste elimination
• Continuous Improvement - 'Kaizen'
• Total productive maintenance
• 5S and visual management
• Process mapping exercises
• Supplier development
In practice, most organisations improve their processes by selecting from among these tools those that are applicable to the kind of improvement that fits the process. It is very important to note that Lean is not a 'quick fix': its impact is not immediately apparent, but rather emerges gradually.
2.4 Lean in practice
The implementation of Lean practices was based on numerous ideologies that existed before the appearance of Lean, such as just-in-time (JIT) production and total quality management [16]. Hines, Holweg and Rich [1] state that the Lean concept has grown over time, and that its advancement will be constant. This has caused major confusion about what Lean is and what it is not.
Many case studies and applications of Lean in industry, ranging from manufacturing to service sectors, have been written up. Salem and Zeimer [17] suggest that the grouping of Lean construction and Lean manufacturing can be carried out by focusing on the principles of customer focus, organisation and standardisation of workplace, people and culture, elimination of waste in the process, and continuous improvement with quality assurance programs. Lean construction, for example, is defined as the continuous elimination of waste by meeting every requirement of the customer while focusing entirely on the value stream and pursuing perfection in accomplishing a construction project
Middleton [18] points to the vital concept of the Lean principle for software developers. For example, he finds that, as an alternative to producing large documents and then passing them over to the design unit for the necessary verification, the verification should be done by the design unit as each page is finished [18]. In this way the design unit can detect errors in each page and send them back to the analyst for correction. This sort of practice can offer the analyst immediate and ongoing feedback on their performance.
Through the implementation of Lean practices, the TRW Automotive Electronics Group reduced the time it took to move raw materials by 61 per cent, minimised lost man days by 81 per cent, slashed capital expenditures by 70 per cent, and increased turnoverin the production inventory by 28 per cent [19]. Outside the automotive industry, one of the most noticeable Lean manufacturing programmes is the Lean aircraft initiative that involves the Massachusetts Institute of Technology (MIT), the US Air Force, and 25 defence contractors. There are reports on the application of Lean principles to the development and manufacturing of low volume / high variety products such as aircraft: companies such as McDonnell Douglas and Lockheed have practised the application of the principles of Lean from the design stage to the manufacturing of their products [20].
3 CASE STUDY DEFINITION
To examine implementation of Lean tools in the maintenance environment (a non-traditional Lean context), a case study was chosen: the supply chain management of a rolling stock maintenance organisation. The rolling stock SCM carries out the task of service and product supply to its internal requisition departments.
In the current rolling stock SCM, three basic processes can deliver materials or services from request to receipt: demand management, acquisition management, and materials management.
3.1 Demand management
The demand management process begins with a needs assessment for every product that is to be procured at the beginning of each fiscal year. For an effective needs assessment to take place, various elements should be considered, including future and current need requirements, identification of critical delivery dates, product specifications, and expenditure analysis.
Following the needs assessment by the SCM and the line department requesting the material or service, the SCM department develops a procurement strategy based on the nature of the required material or service, the delivery conditions, and the prospective suppliers.
3.2 Acquisition management
The acquisition management process involves numerous activities. So critical attention and observation are required to bring the acquisition of material or service to timely and successful completion. The activities in supply chain acquisition management are listed below:
• Supplier database management
• Request for quotation process (RFQ)
• Supplier recommendation
• Supplier approval
• Purchase order
3.3 Materials management
In the current rolling stock SCM, the vital activities for managing material effectively are inventory management and vendor performance. The management of Inventory defines the stock/stores management, including item codification management and setting of inventory levels, purchasing, receiving, and issuing of goods. The performance of suppliers is often measured by determining their reliability.
4 LEAN TOOLS FOR MEASUREMENT AND ANALYSIS
To ensure that the research questions were addressed, the authors adopted a measurement and analysis structure for the introduction of Lean tools into the current rolling stock SCM. Value stream mapping was the first Lean tool that was used to map the system to determine its current state. After this, other applicable Lean tools for the current SCM were applied to shape the future state of the process.
4.1 Current state value stream mapping
As initially pointed out, value stream mapping (VSM) was carried out to determine the current state of the rolling stock SCM. The current state VSM was determined to show the present situation in the SC so that further Lean tools could be recommended to achieve the SC's future state. The idea of applying this tool first is to identify the key activities within each process family.
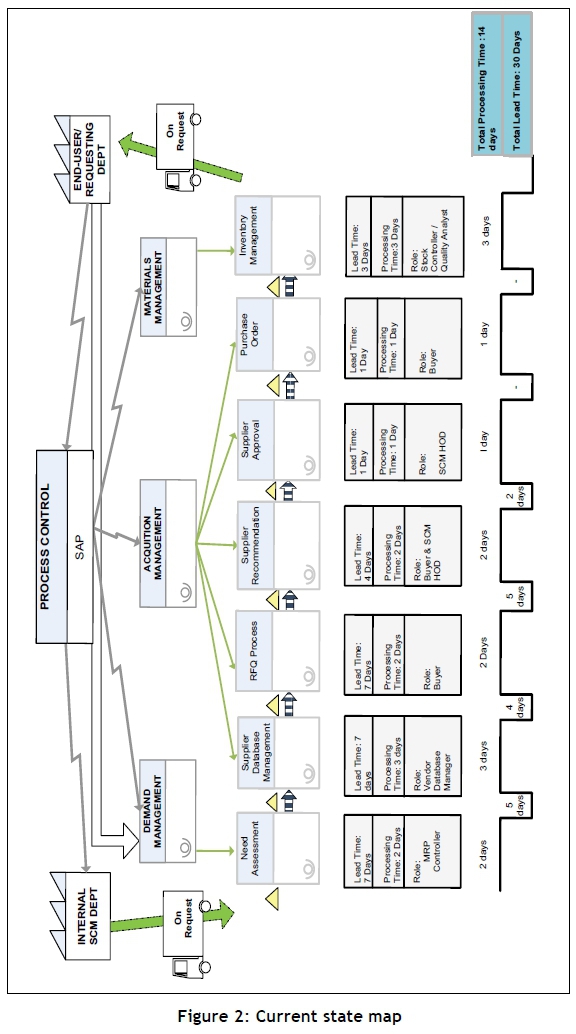
Material or service acquisition and receipt begin with a formal electronic requisition from the line department requesting the goods or services from SCM. Figure 2 shows the current state value stream map for the current rolling stock SCM. It shows that it takes about 30 days from the request for material or service to the complete management of the material or service, which is the lead time in the supply chain. Although the total lead time is 30 days, the actual busy time - the processing time - is 14 days. The remaining 16 days are seen as redundant and as waste.
4.2 Cause-and-effect analysis
For Lean waste to be effectively identified in the process, cause-and-effect relationships were formulated. A typical Lean tool for the analysis of cause-and-effect relationships is the cause-and-effect diagram. This tool is an effective way of discerning the root cause of any problem. The cause-and-effect analysis tool is used by asking questions that are based on the causes of the problems in the value stream. The questions are best grouped into categories for brainstorming purposes. The following categories were used:
• Environment
• Procedure
• Information management
• Measurement
• Material
In this case study, the cause-and-effect diagram was used to analyse the cause-and-effect relationship in the process within the selected categories as listed above.
To effectively draw the cause-and-effect diagram (refer Figure 3) for the current process, the following steps were considered:
• Problem definition
• Detection of problem cause
• Brainstorm and organise causes of problem by their various category
• Identification of sub-causes for every prime cause of problem
4.3 Failure mode and effect analysis
It is vital to perform failure mode and effect analysis (FMEA) for the current process. The FMEA goal is to organise systemised groups of activities in order to identify and evaluate the potential failure of a process. Furthermore, this type of analysis can identify actions that could reduce or eradicate the likelihood of problems within the process [21].
The FMEA for the current supply chain process contains the following steps:
• Process step definition
• Identification of potential failure
• Identification of failure effects
• Identification of failure cause
• Estimation of potential failure severity, occurrence and detection
• Calculation of risk priority number (RPN)
• Recommendation plan
The estimation of failure severity used a numerical rating scale of 1(low severity) to 10 (high severity). Similarly, the occurrence of failure was estimated by using a numerical rating scale of 1 (low probability of occurrence) to 10 (high probability of occurrence). To estimate problem detection, yet another numerical rating of 1 (easy detection of failure) to 10 (difficult detection of failure) was adopted. The RPN was calculated by multiplying the severity time, occurrence time, and detection rating. Based on the RPN values, a Pareto chart was created to determine the potential failure with the highest RPN value (Figure 4). The activity with the highest RPN value has the highest failure mode in the SCM, and will be the focus for improvement in the improvement phase.
The Pareto chart above was drawn by plotting the RPN values against the process steps in the SCM. The process step with the highest RPN values appears on the left hand side of the graph, which continues to the smallest values. The process step with the highest RPN values will be the focus for improvement, as initially stated. From the Pareto chart, the activities that require the most improvement are supplier database approval and vendor performance.
4.4 Waste analysis
Specific Lean wastes have been identified during the 'gemba' walk (interview of line managers and SCM) through the current supply chain activities. A gemba (sometimes written 'genba') walk is the Japanese term used to describe the personal observation of work where the work is happening. The original word comes from gembutsu, which means 'real thing', or sometimes 'real place'.
Various wastes were detected in each stage of the supply chain. Generally, as illustrated in Section 2 of this article, there are eight different kinds of wastes in a manufacturing value stream. Since the current process of analysis is different from the traditional Lean manufacturing background, there will be slight variations in the observed wastes.
In the demand management, poor forecasting/detailed plan and inaccurate specification of needed goods or services can cause the waste of defects, over-processing, waiting, and underutilised staff skills. In the case of material request it can result in the waste of inventory and transportation.
The waste of over-processing, waiting, and defect is predominant in the acquisition stage. The major challenge identified during the 'gemba' walk through the process was the difficulty of sourcing a suitable supplier. This can result from having few or no responses to the RFQ, leading either to repeating the RFQ procedure or to dealing with the available supplier. This can cause over-processing or the receipt of non-conforming materials. Table 1 below shows the identified wastes in each stage of the supply chain, and the applicable Lean tools for these wastes.

5 FUTURE STATE IMPROVEMENT
5.1 Future state value stream map
While drawing the current state map enables a visual understanding of the operations in the supply chain, the real utility of the tool is the ability to develop a vision of how good the value stream for the process could be [22].
In ways similar to those used in the manufacturing context, the current SCM follows specific guidelines to develop the future state value stream map for the process. The guidelines that were applied during this research project are presented in the form of questions that were answered to formulate the future state process.
• What is the total processing time?
• Where can the company use continuous flow processing?
• Where does the company need to use pull systems?
• What process in the current state map needs to be levelled?
• What activities need to undergo 5S?
• What activities in the system should involve Kaizen?
• What other supporting processes are necessary (key improvement initiatives and critical success factors for implementation of the 'future state' map)?
Figure 5 shows the future state map that was developed from the measurement and analysis section, and the future state guideline questions.
5.2 Observations derived from the future state map
This section contains the observed improvement in processing time between the current state map and the future state map. The improvement in the processing time was initially discussed in Section 2.4. The overall lead time improved drastically, being reduced from 30 days to 18 days, resulting in a value-added time of 12 days.
6 PERFORMANCE METRICS
It was discovered during the supply chain assessment that crucial performance metrics were absent. The downside effects of this can be numerous, from slowing down the progress of the process to preventing opportunities for incremental innovation. The success of Lean implementation can only be realised in the long-term. With this being the essential criterion for Lean methodology and application, specific performance indicators are important when observing the system.
The SCM of the case study used carries out the task of service and product supply to its internal requisition departments. The performance indicators that can be applied to the supply chain practices for monitoring and assessment suggested by Allain, Sommerlatte, Collins and Tien [23] fall under the following four categories:
• Quality indicator
• Response indicator
• Financial indicator
• Productivity indicator
Periodic performance assessments of the process team members, using these indicators, will assist the current SCM to reach the required future state.
6.1 Quality indicators
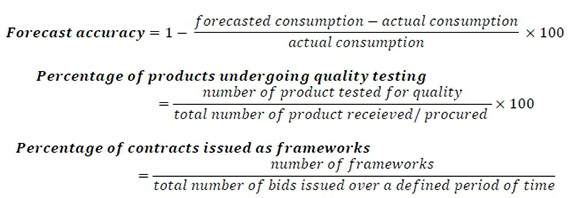
From demand management to acquisition management, quality can be measured by calculating the forecast accuracy, the percentage of materials that undergo quality testing for material requisition, and the percentage of contracts issued as frameworks. The forecast accuracy can be calculated by collecting information on forecasted and actual consumption. In terms of material supply, details of the number of products tested for quality and the total number of products received or procured can be used to estimate the percentage of products that undergo quality testing. Furthermore, the number of framework contracts and total number of contracts issued over a specific period can provide the result for the overall percentage of contracts issued as framework contracts. For a fuller explanation, see the equations below for quality measurement calculations.
6.2 Response indicators
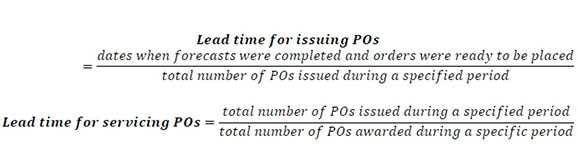
The response indicators can be used to estimate the duration of activities carried out in the process. The lead time for issuing contracts or purchase orders, and the lead time for awarding or executing this order can be the key metrics for the process response. An apt way of estimating the lead time for issuing contracts is by recording dates when forecasts were completed and orders were ready to be placed, then dividing this by the entire number of purchase orders issued during a particular period. Similarly, the lead time for awarding contracts can be calculated by dividing the number of days between each purchase order (PO) being issued and the contract being signed off by the supplier, and the sum of contracts or POs serviced during a specific period. The equations below show the response metrics calculations.
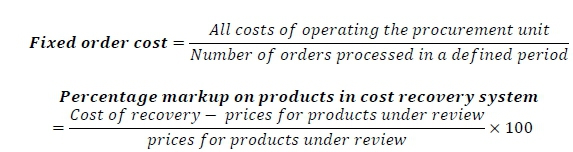
6.3 Financial indicators
To measure the financial performance of the system, various costs could be considered periodically. Some of these costs are:
• Fixed order cost
• Percentage mark-up on products that require a cost recovery process
The fixed order cost can be estimated by collating information on all costs of operating the procurement unit and the number of orders processed in a defined period. To estimate the percentage mark-up on products that require a cost recovery process, details of the cost of recovery and the unit prices of products under review are vital. The equations below provide simpler illustrations of the fixed order cost and percentage mark-up.
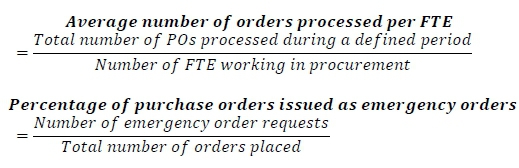
6.4 Productivity indicators
The productivity of the system can be measured by calculating the average number of POs processed in procurement and the percentage of POs issued as emergency orders. The total number of POs processed during a defined period can be divided by the number of full-time equivalent (FTE) people working in procurement to obtain the average number of POs processed per FTE in procurement. To analyse the supply chain productivity further, details of the sum of emergency requests and the sum of orders placed can be used to estimate the percentage of purchase orders/bids issued as emergency orders. The equations below provide clearer understanding of the calculations.
7 CONCLUSION
This section offers conclusions drawn from the case study, given in the form of answers to the research questions that were posed in the introduction to the article. The second part of this section provides suggestions for future areas of study.
7.1 Answer to research questions
What does the current rolling stock SCM look like?
The implementation of value stream mapping tools through current state mapping was used to determine the current state of the SCM. A diagrammatic illustration of the current state map is shown in Figure 2.
What suitable Lean tools will improve the current SCM?
The case study is a typical example of a non-manufacturing maintenance service organisation. It was found that not necessarily every tool that applies in the manufacturing environment will apply in this specific environment. Some of the important Lean tools that were applicable to this environment are listed below:
• Value stream mapping
• Cost of poor quality (COPQ)
• Failure mode and effect analysis (FMEA)
• 5S analysis
• Waste analysis
• Kaizen (continuous improvement)
What suitable performance measurement should be formulated for the process?
In order to measure the performance of the process periodically, certain metrics must be identified and formulated. Four different categories of metrics for the current process were identified in Section 6 . These metrics will aid the management in measuring how healthily the supply chain process is performing.
7.2 Recommendations for further study
Based on the findings in this article, the following recommendations are made to improve the efficiency of the current rolling stock SCM:
In the current study, the data from the acquisition management level of the supply chain was not adequately benchmarked for the challenges at this level of SCM. Value stream mapping (VSM) used for analysis in Section 4.1 has been identified as a vital tool in the Lean methodology; so VSM should be investigated in this organisation's rolling stock acquisition management to analyse and improve further to meet unforeseen challenges.
REFERENCES
[1] Hines, P., Holweg, M. and Rich, N. 2004 Learning to evolve: A review of contemporary Lean thinking, International Journal of Operations and Production Management, 24(10), pp. 994-1011, [ Links ]
[2] Jonsson, H.F.P. 2009. Obstacles to supply chain integration of the performance management process in buyer-supplier dyads: The buyers' perspective, International Journal of Operations and Production Management, 29(1), pp. 77-95. [ Links ]
[3] Ayers, J.B. 2006. Handbook of supply chain management, 2nd ed. New York: Auerbach Publications. [ Links ]
[4] Daud, A.B. 2010. A study on Lean supply chain implementation in Malaysia's electrical and electronics industry, Penang: Universiti Sains Malaysia. [ Links ]
[5] Lambert, D.M. and Cooper, M.C. 2000. Issues in supply chain management, Industrial Marketing Management, 29, pp. 65-83. [ Links ]
[6] McLaughlin, P. and Durazo-Cardenas, I. 2013. Cellular manufacturing applications in MRO operations, Cranfield. [ Links ]
[7] Zhu, H., Gao, LJ., Li, D. and Tang, D. 2012. A web-based product service system for aerospace maintenance, repair and overhaul services, Computers in Industry,63, pp. 338-348. [ Links ]
[8] Lee, S.G., Ma, Y.-S., Thimm, G.L. and Verstraeten, J. 2008. Product lifecycle management in aviation maintenance, repair and overhaul, Computers in Industry, 59, pp. 296-303. [ Links ]
[9] Alfieri, A., Kroon, L., Groot, R. and Schrijver, A. 2006. Efficient circulation of railway rolling stock, Transportation Science, 40(3),pp. 378-391. [ Links ]
[10] Clegg, M.M.B. 2007. Designing a support system for aerospace maintenance supply chains, Journal of Manufacturing Technology Management, 18(2), pp. 139-152. [ Links ]
[11] Mathaisel, D.F. 2005. A Lean architecture for transforming the aerospace maintenance, repair and overhaul (MRO) enterprise, International Journal of Productivity and Performance Management, 54(8), pp. 623-644. [ Links ]
[12] Ayeni, P., Baines, T., Lightfoot, H. and Ball, P. 2011. State-of-the-art of 'Lean' in the aviation maintenance repair, and overhaul industry, Proceedings of the Institution of Mechanical Engineers, Part B: Journal of Engineering Manufacture, 225(11), pp. 2108-2123 [ Links ]
[13] Bailey, G.J. and Helms, M.M. 2007. MRO inventory reduction-challenges and management: A case study of the Tennessee Valley Authority, Production Planning and Control: The Management of Operations, 18(3), pp. 261-270. [ Links ]
[14] Ren, J. 2012. Lean construction supply chain, Real Estate Development and Financial Services. [ Links ]
[15] Bhasin, S. and Burcher, P. 2006. Lean viewed as a philosophy, Journal of Manufacturing Technology, 17(1), pp. 56-72. [ Links ]
[16] Taylor, R.D. 2010. Exploring the impact of Lean design and Lean supply chain management on an organization's innovation capability, Minneapolis: University of Minnesota. [ Links ]
[17] Salem, O. and Zeimer, E. 2005. Application of Lean manufacturing principles in construction, Lean Construction Journal, 2(2), pp. 1369-1555. [ Links ]
[18] Middleton, P. 2001. Lean software development: Two case studies, Software Quality Journal, 2, pp. 241252. [ Links ]
[19] Motwani, J. 2003. A business process change framework for examining Lean manufacturing: A case study, Industrial Management and Data Systems, 103(5), pp. 339-346. [ Links ]
[20] Arindam, J.J., Bhattacharya, K. and Walton, A.D. 1997. Applying Lean principles for high product variety and low volumes: Some issues and propositions, Logistics Information Management, 10(1), pp. 5-13. [ Links ]
[21] Cudney, E.A., Furterer, S.L. and Dietrich, D.M. 2014. Lean systems: Application and case studies in manufacturing, service and healthcare, 1st ed., Boca Raton: CRC Press. [ Links ]
[22] Brunt, D. 2000. From current state to future state: Mapping the steel to component supply chain, International Journal of Logistics Research and Applications, 3(3), pp. 259-271. [ Links ]
[23] Allain, L., Sommerlatte, A., Collins, E. and Tien, M .2010. Measuring supply chain performance: Guide to key performance indicators for public health managers, Arlington: USAID. [ Links ]
[24] Lamming, R. 1996. Squaring Lean supply with supply chain management, International Journal of Operations and Production Management, 16(2), pp. 183-196. [ Links ]
[25] Towill, P.C. 2000. Engineering supply chains to match customer requirements, Logistics Information Management, 13(6), pp. 337-346. [ Links ]
Submitted by authors 25 Feb 2016
Accepted for publication 24 Mar 2017
Available online 26 May 2017
* Corresponding author cjf@sun.ac.za

