


Services on Demand
Article
 English (pdf)
 Article in xml format
 Article references
Indicators

Related links
-
 Cited by Google
 -
 Similars in Google
Share

 Permalink
South African Journal of Industrial Engineering
On-line version ISSN 2224-7890
Print version ISSN 1012-277X
S. Afr. J. Ind. Eng. vol.28 n.1 Pretoria May. 2017
http://dx.doi.org/10.7166/28-1-1538
GENERAL ARTICLES
A decision support system for strategic, tactical and operational visit planning for on-the-road personnel
A.L. RademeyerI, *; D.J. LubinskyII
IUniversity of the Witwatersrand, Johannesburg, South Africa
IIOPSI Systems, South Africa
ABSTRACT
The use of a decision support system (DSS) for efficiently optimising and managing field workers' visits is discussed. This tool was designed after years of consulting experience and algorithmic research. It includes not only an innovative memetic algorithm to solve very large problems with realistic features and constraints, but also analytic tools and mapping capabilities to compare scenarios. As practitioners, we include some insights from case studies done at strategic, tactical, and operational decision levels. The system solves scenarios at all three decision levels simultaneously, not sequentially. The empirical studies highlight some misconceptions that are present in industry in planning visits for on-the-road personnel activities.
OPSOMMING
Die gebruik van 'n besluitnemingsondersteuningstelsel om veldwerkers te bestuur en optimeer word beskou. Die stelsel is ontwikkel na jare se ondervinding as konsultante en navorsing oor algoritmes. Dit sluit nie net 'n innoverende memetiese algoritme in om baie groot probleme op te los nie, maar bevat ook analitiese funksies en 'n vermoë om scenario's met mekaar te vergelyk. As praktisyns sluit ons insigte in van gevallestudies wat ons gedoen het op strategiese, taktiese, en operasionele vlakke. Die stelsel los scenario's op al drie besluitnemingsvlakke gelyktydig, nie sekwensieel nie, op. Die empiriese studies lig 'n aantal wanopvattings uit wat in die praktyk oor die beplanning van reisende personeelaktiwiteite bestaan.
1 INTRODUCTION
One of the most prolific areas of academic research in analytics and operations research is routing and scheduling, as seen in the exponential rise in published works [1]. However, in industry, planning the activities of staff who spend much of their time travelling has traditionally been fairly unscientific. Among the reasons that the uptake of such decision-making methods has been so slow (uptake figures of between five and 23 per cent have been reported [2, 3]) is the perceived lack of benefit versus effort. It is true that, until recently, the gap between the needs of industry and the techniques available in the academic literature was quite large, as there was little collaboration between these parties. With the increased affordability of computing power and the resulting availability of data, more companies are embracing the use of mathematical algorithms to solve business problems with tangible economic benefits.
It is still surprising how many multi-national companies invest in technology to plan their fleets of delivery vehicles, but ignore the inefficiencies in planning their sales force and other mobile resources. In the same vein, perhaps because academia refers to the simplest routing problem as the 'travelling salesman problem' (TSP), companies with staff on the road who are not salespersons but provide regular maintenance, hygiene, or medical care services, do not realise how they could also apply routing algorithms to make the most of their 'people' assets. Consultants and software providers also often have difficulty convincing and proving to potential clients that the costs incurred in making such decisions through modelling are usually recouped very quickly.
Kalcsis, Nickel and Schroder [4] comment that "for sales territories, well-planned decisions enable an efficient market penetration and lead to decreased costs and improved customer service". Drexl and Haase [5] add that "in many selling organisations, sales force deployment is a key instrument in allowing sales management to improve profit. In general, sales force deployment is complicated and has attracted much analytical study". Although this paper will discuss sales representatives (reps) and stores, the concepts extend to the other types of on-the-road personnel and clientele listed below:
• Reps, merchandisers, and van salespersons:
The focus is on building customer relationships and developing brand awareness by spending as much time as possible at the store and exploring unserviced areas. These visits are sometimes referred to as 'desired', as opposed to the two visit types that are referred to as 'entitled' (see below).
• Field service technicians and hygiene workers:
These industries are quite competitive, and issues of accurate contract costing, the impact of customer turnover, and driver familiarity with customers are critical. Unlike sales reps who can skip or delay visits, these personnel cannot miss visits.
• Home care providers:
In medical home care, it is critical that treatment schedules and medical delivery (e.g., oxygen tanks) are adhered to stringently. Schedules must be workable and adhere to patients' needs; and the addition of a patient to or removal from an existing schedule must be simple.
Usually a contract is in place with a service provider/supplier and their client, particularly for the entitled visits. These agreements may stipulate a visit frequency, set of visit days, or other requirements against which service levels can be measured. When such regular and repeatable tasks need to be executed, the use of master routes over the period of their order/delivery/service cycle is recommended in order to make their operations more transparent, easier to manage, and more competitive. Common problems with which companies need help to overcome include overtime, excessive travel claims, failure to meet appointments, under-serviced stores, and unbalanced workload between staff. In some cases, the issue is simply the inability to change operations because no-one is capable of testing different plans without the help of analytic tools. There is often a reluctance to use software or to employ a consultant, since many companies see their situation as unique, or as too complex for any existing tool to handle.
The types of problems that decision-makers face can be grouped into three categories:
1. Strategic:
How do I define my territories? How many reps do I need? Where should they be located? For a given service level, what will a change in service cost?
2. Tactical:
Based on several possible visit patterns (profiles), what is the best set of days (profile) to visit each store? Which rep should visit each store?
3. Operational:
How should I combine the allocated store visit days into well planned routes for each day? How should I replan the routes when some visits are missed or carried over, or ad hoc visits are added?
The boundary between strategic and tactical categories may be blurred. According to Balakrishnan, Ward and Wong [6], sequentially solving the location and then the routing aspect has been found to be the most successful hierarchical approach to large-scale problems, although separating the decisions is suboptimal. Howick and Pidd [7], in their comprehensive review of sales force deployment models, mention that analysing the interrelated sub-problems separately can lead to sub-optimisation; but they also note that not much work has been done on multi-stage frameworks. (To date, this area of research has still not received a lot of attention in the literature.) The pitfall here is that high-level strategic and/or tactical decisions are made without any guarantee that the outcome will give implementable routes for daily operations. For example, when assigning stores to reps without considering the available visit days for the stores, it may happen that a rep gets a store assignment with no stores being able to be visited on a Monday, and so the rep has an empty day.
Similarly, when profiles are assigned to stores, consideration must be given to visit windows for each day, or it could happen that a rep is assigned to stores that can only be visited in the morning.
To address these issues, we created a DSS that responds to this problem in a unique way, in that it deals with all three decision levels simultaneously: it is a 'one-shot' optimisation approach. Any decision made at the tactical level, for example, is evaluated right down to the operational level to check for feasibility, cost implications, etc. if a store has been re-assigned from rep A to rep B, then all the routes of rep A and rep B that are affected by this move are updated. The best profile for the store when it was assigned to rep A may be different now that it has been assigned to rep B. The decision about which profile to choose depends on the constraint violation and objective function values that are calculated by running a TSP heuristic for each affected route. These detailed routes that are used for the evaluation are the same routes that are returned in the final solution. If a user of the DSS is only interested in answering the strategic and tactical questions, for budgeting purposes perhaps, they can ignore the detailed routes - but they can be confident that these results are not just high-level estimates.
The remainder of the paper is structured as follows: the literature review contains a section on terminology to clarify the relationship of the problem being solved to the terms used in the literature. Also included is a brief discussion of sales territory design, followed by a review of papers covering practical cases of solutions to on-the-road personnel visit planning problems. The methodology section covers the unique integrated features of the DSS, along with details of the required input data, the memetic algorithm, and the diagnostic and execution features. Four real-world case studies are given in the subsequent section before concluding.
2 LITERATURE REVIEW
2.1 Terminology
The multi-day routing problems being discussed are specific extended cases of the general period travelling salesman problem (PTSP) in which routes are created over an m-day period. The PTSP is to design a set of routes of minimum distance for each day of a given period. Each store may require a number of visits during the period (between one and the number of days in the period) that may only occur in one of a given number of allowable combinations (profiles). Usually, stores have a fixed visit frequency, and not all stores require a visit on every day of the period. For each day of the planning period, a non-empty tour must be generated by connecting the salesperson's home location and the store sites that must be visited on that day according to their assigned visit combination. Problems of interest in industry usually involve multiple salespeople who are not all located at the same central home location.
Additional variants of these periodic problems result when (i) the home site locations of the salespeople are not all known and must be provided as output (in the case when new reps are to be hired); and (ii) the number of salespeople required to service the stores is unknown. These strategic decisions are heavily influenced by the variable routes that will be served from the home sites. When the number of homes increases, the radial distances decrease; but this may also lead to extra routes and more under-used vehicles [8]. The shape of the sales territories can be quite different if the home locations are not used for the route start and end points. This can occur when a company requires their salespeople to attend meetings at the office before beginning a day's call schedule, and to end with some administrative work. The daily leg of the route between the home and the office is then not considered. Technicians and hygiene workers also typically go to a central depot each day and then use a company vehicle. Another feature that has recently been added to these routing problems (see [9] and [10]) is the ability to allow for sleep-outs (nights away from home), which tends to reduce the number of required salespeople and affect the shape of the sales territories.
The problems of interest differ from traditional vehicle routing problems in the following ways:
• Routes begin and end at each rep's house (i.e., there are multiple depots).
• Not all reps need to be used in the solution (i.e., the problem is to size the field force).
• These home locations can change often, and sometimes need to be determined as part of the solution (i.e., location routing).
• The problem is uncapacitated, as no product is delivered (only time is a restriction on workload), so multiple trips per rep per day have no relevance.
• Sleep-outs are more common.
• Where a store is visited multiple times in a period, each visit must be made by the same rep. The set of stores visited by the same rep in a period will be referred to as a 'cluster'. Not all stores in the same cluster necessarily have identical visit frequencies.
The vehicle routing problem (VRP) had been generalised for tactical or strategic decision levels, but not for both - until the interdependent location-routing problem (LRP) and periodic VRP (PVRP) were combined for the first time by Prodhon [11] to form the periodic location-routing problem (PLRP). The three main decisions that must be made are: deciding which depots to open; assigning service day combinations to stores; and creating routes. The use of continuous approximations within discrete algorithms for routing vehicles is discussed by Hall, Du and Lin [12]. Heuristic and exact algorithms usually rely on discrete mathematical programming formulations, whereas approximation models for predicting the optimal shape of routing districts and route length, for example, use continuous variables. "For strategic and tactical analyses, continuous models highlight key decisions and illustrate trade-offs, which allow multiple strategies to be rapidly examined. At the operational level, discrete methods can automate the routing process" [12]. A thorough literature review of the PVRP is given by Campbell and Wilson [13].
2.2 Sales territory design
Sales territory design, also known as 'districting' or 'turfing', refers to the "grouping of small geographic units or areas into larger geographic clusters according to some criteria" [14]. It is generally treated as a separate area of research from the investigation of the TSP and its variants. The former is more concerned with the formation of cluster boundaries, while the latter is concerned with optimal route sequencing. For the problems being discussed here, much emphasis is placed on store group/cluster compactness (size and shape). The issues of compactness and balance refer to minimising dispersion and evenly distributing the workload respectively. It is quite common in this field of research to work with groups of stores rather than with individual outlets, to contain the problem size and to ensure a city is not split between sales reps. Typically, territory "compactness is measured by the physical closeness of accounts to the centre of a territory weighted by a measure of activity" (see Cloonan [15]). Compact territories are typically more efficient - meaning less travel time, more selling time, and hopefully higher sales.
There is often a requirement that the boundaries of these territories align with political (e.g., provincial) and topographical boundaries as well. Howick and Pidd [7] comment that it is not easy to prevent disconnected territories or to include geographic considerations unless maps and a manual evaluation of alternatives is employed; and these are not practical alternatives for large problems. Districting problems usually fall into one of the categories below [16]:
• Sales territories: maximise profit, less attention to travel cost.
• Political districting: compact and connected districts.
• Refuse (and other) vehicle routing: orientate districts, of varying shapes, to a fixed point (disposal area).
• Telephone (and other) turfing: small geographic scale and detailed road network modelling.
Kalcsis et al. [4], in their review of territory design models, describe applications in many areas including: (i) territories for facilities at a fixed location (hospitals, schools, etc.); (ii) on-site service territories (waste collection routes); and (iii) emergency service territories (police patrol, ambulances, etc.).
2.3 Application areas
Problems with different rep home locations and/or periods have not received the same degree of attention as other routing problems, although this has changed in the last few years. Most methodological developments target a particular problem variant rather than the broader problems that have relevance to many real-world applications, as pointed out in[17]. A full exercise covering all of the decision levels defined earlier has both a partitioning (assigning stores to clusters/reps and days/profiles) component and a permutation (sequencing stops to stores within a cluster on a day) component. This section briefly summarises some of the papers dealing with real-life examples of successful implementations of results from projects that have had a significant beneficial impact on the daily operations of a company and on their bottom-line. Papers on well-defined scheduling and rostering problems that assign tasks to the field workforce are not included here, since these do not take the travel times and routing constraints into account [18].
2.3.1 Sales reps
Jang, Lim, Raskin and Perkins [19] report on the Missouri Lottery, which employs 39 lottery sales representatives (LSRs) to service 5000 outlets in the state. Most outlets are visited once every two weeks; some are visited weekly. Outlets were assigned to LSRs upfront by county in rural areas and by major streets or highways in urban areas. Greater savings could have been made if retailers had been re-assigned to LSRs, but management did not sanction such a drastic change as it would have jeopardised longstanding relationships. The objectives of the study included reducing vehicle costs (and possibly the number of LSRs) and freeing up LSR work time. "Many LSRs work up to twelve hours on some days because they would rather cover a certain geographical area in one trip" [19]. The managers believe that longer working hours result in a lower quality of service, but this behaviour does not increase the lottery's costs because all LSRs are salaried.
The original LSR routes were used as starting solutions to the problem to preserve as many current activities as possible and to reduce inconvenience. A cluster-first route-second approach with improvement procedures was applied. Mapping software was used to calculate street-based travel distances, times for input into the problem, graphical routes, and time-specific schedules at the end. Factors that could not be captured by the model but had to be taken into account with manual route adjustments were: traffic congestion on Friday afternoons in some areas; dangerous highway exits; unsafe neighbourhoods; and the difficulty of making turns at some intersections. With the reduction in work time, the LSRs were able to fit more marketing and administrative tasks into their schedules. Non-economic benefits of the study include increased morale and the possibility of taking account of more factors than manual routing can. The LSRs in this exercise were permitted to modify the suggested optimised routes; many removed some efficiency, but created routes with fewer overlaps and crossovers.
The paper by Lodish [20] proposes a mathematical programming model to maximise profit generated by salespeople, and a heuristic that allows the problem to be broken into steps for subjective analysis and input. The decisions to be made in the primary model are: which salespeople should cover which areas; how many trips should be made to a sub-area; and how much time should be spent calling on stores in a sub-area. The sub-problem considers how many visits to make to each store in the time available for a sub-area. A sub-area is never split between salespeople, and a collection of sub-areas is referred to as a 'territory'. The number of calls to a store is assumed to affect its sales. The salespeople, usually with the help of their managers, estimate the store sales response-to-call frequency functions, since the optimal time to spend is related to the districting problem.
Designing or re-aligning territories according to managerially-relevant alignment criteria does not only occur when territories are designed from scratch, but also when new products are introduced or markets shift. Foster and Ryan [21] created a model that insists that at least one vehicle visits an expanding business area every day of the period so that the resulting schedule plan can incorporate new business without serious disruption. Managerial heuristics, according to Zoltners and Sinha [22], "provide sales management with data and an objective function for sales territory alignment, but do not provide a methodology for actually designing sales territories". Mathematical methods are far more adept at producing good solutions that incorporate territory design attributes either as constraints or in the objective function.
2.3.2 Servicemen and security guards
Schindler Elevator Corporation in the USA has thousands of technicians on the road each day doing preventative maintenance work as described in [23]. Schindler embarked on a project to create a system to streamline their service areas and operations. Their system allows for up-to-date visibility, planning and adjustment of technician routes, and integration with the ERP system to keep master data current. Whenever a new piece of equipment is added to or removed from a building, the service superintendent must adjust the routes. Each technician works different days of the week during different hours, and some time is left on the routes for emergency repairs and customer callbacks. Each regional office now uses the system to replan routes for its customers every two weeks; this process takes about two hours.
Hadjiconstantinou and Baldacci [24] describe another application of the routing and scheduling of service personnel for a utility company with multiple depots. The authors created a base case, and then used the model to try different what-if scenarios - for example, closing down or opening new depots. The solution algorithm was also used to construct cost-service trade-off curves by plotting different customer service levels against the least-known cost of providing the level of service.
DSS systems not only allow different strategies to be tested and compared, using different indicators, but since they are usually stochastic, they also provide alternative and almost equivalent solutions to workforce scheduling problems. Wolfler Calvo and Cordone [25] examine an overnight security service problem in Milan, Italy. Private security patrols are a common feature of modern night life. Careful planning is needed to be effective and profitable. One of the main focuses of the study was to return multiple results sets since, if the guards' movements are predictable, the service fails.
2.3.3 Medical service providers
Begur, Miller and Weaver [26] describe the creation of an integrated spatial decision support system for scheduling and routing of home-health-care nurses. This staff deployment system incorporates a GIS component that allows for interactive what-if analysis by the user. The authors divide the planning into three levels: (i) a long-range master schedule to assign visits to weekly time buckets during a 16-or-so week horizon; (ii) the visits within a given week must be assigned to a single day; and (iii) all visits within a day are assigned to a nurse and then optimally sequenced. Exceptional cases that require multiple visits to the same patient per day are handled manually. This method is very practical and powerful for developing routes for small-sized problems. Unfortunately, much of the problem-solving relies on a skilled user, not on the mathematical model.
Maya, Sorensen and Goos [27] discuss another interesting study for the teaching assistants' assignment routing problem. The problem was motivated by a case study in Belgium where disabled children received ambulant help from an assigned teaching assistant (TA). TAs travel from home (not all TAs work every day) to see pupils at their respective schools. If a pupil receives more than one visit per week, all visits must be done by the same TA, and this TA must have the correct qualifications for that student.
3 METHODOLOGY
After ten years of using various tools to perform planning and costing exercises for companies that have on-the-road personnel, we decided to create our own DSS: ORBIT (optimal route building and information tool). We found alternative tools to be inadequate because they could not solve a wide variety of problems; large real-world problems had to be broken up into smaller instances; and the graphics and analytic capabilities were weak. Also, as mentioned in the introduction, the three levels of decisions are normally dealt with sequentially, and we often had to use different tools for each level of modelling. ORBIT has a highly configurable memetic algorithm (MA) (described in Section 3.2 and by Rademeyer [10]) with strong seeding heuristics and memetic operators. The MA solves the three interrelated sub-problems simultaneously while taking into account a number of hard and soft constraints and multiple objectives. Another benefit is that we are able to consider additional scenarios and strategies for our clients because the time taken to complete projects has been reduced substantially. One of the main reasons for this is that decision-making is no longer myopic; we do not find ourselves battling at the operational decision level with infeasible decisions that were made higher in the hierarchy, and needing to go back to adjust results from the strategic level.
ORBIT not only allows big datasets (in terms of number of stores, reps, and the length of the planning period) to be handled, but has a number of other practical and novel features:
• Lunch breaks and meetings. Like store visits, these can have windows attached to them, and they can also be modelled using a concept known as 'on-route sites'. Consider a one hour on-route lunch break that should take place between 12h00 and 14h00. This means that these lunch visits do not have a physical location, but rather block out an hour of time on the rep's route at a convenient time between store visits while respecting the two-hour window.
• Anchor and chain stores. Stores can be marked as one of these types, and then limits can be set to prevent more than a certain number of chains stores being assigned to any one rep, or ensuring that every route has at least one anchor store.
• Store-store exclusions. Large companies often request that visits to all of their outlets should not be done by the same rep who visits a competitor's stores.
• Same rep constraint. Any store seen more than once in the period is consistently seen by the same rep.
• Preferred reps and visit days. Each store can be supplied with a list of preferred reps and/or visit days to allow for minimal interruption to existing operations.
Additional features of our DSS - store-rep exclusions, different working hours per rep per day, sleep-outs, solving for home locations, elaborate visit profiles, and resourcing - are addressed in the Case studies section below.
Route managers are often reluctant to implement the findings of detailed routing analyses because they find them too rigid. Other complaints have to do with parameters that are hard to quantify and thus difficult to model. Some users of ORBIT implement the assigned reps and profiles for their store universe, but leave the daily stop sequencing to the individual reps rather than using that suggested by ORBIT. This still gives the reps freedom to fit in personal calls such as dropping children at school during their working day. Also, the task of setting parameters is less daunting because scenarios are quick and easy to setup, run, and compare. Users can thus run a few base case scenarios just to ensure that the objectives, variables, etc. are correct.
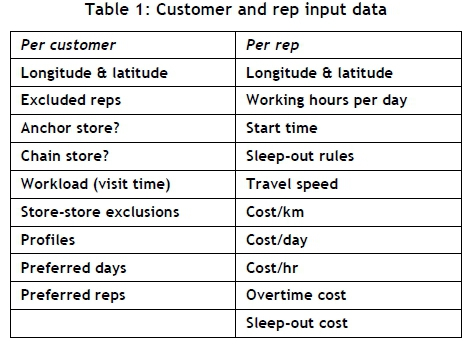
3.1 Input data
Implementations of model solutions are best done in phases, starting with a small sample that can be compared with hand-generated solutions, and then tweaking the model with input from the reps. Preparing data for model building can take almost 80 per cent of the effort in an optimisation exercise; but, more often than not, it gives a profound understanding of the logistical dimension of a company [28]. Gathering, cleaning and updating staff and store master data has many secondary benefits; for example, it is not unheard of that large companies do not have an accurate customer master list. In addition, various statistics to assess the quality of the output should be gathered and compiled: the effectiveness of an operation can be measured by the total time in-store vs total work time (time in-store plus drive time).
Table 1 lists the data required at a customer and rep level. (Rep lunch breaks and meetings are treated as a special type of customer visit.)
3.2 Memetic algorithm
"If specialised and proven algorithms are not available to solve complex and highly constrained (optimization) problems, or if a problem cannot be transformed into a highly abstracted formulation that allows the application of these methods, simulated evolution approaches have proven their applicability for a large number of applications in single or multi-objective optimization problems"
[30]. The memetic algorithm (MA) used by the DSS is described next; some knowledge of genetic algorithms (GAs) is assumed. An MA is a GA hybridised with problem specic heuristics.
Since we are emphasising the practical uses of the visit planning DSS, we give only a high-level desciption of the algorithm. A complete description is given by Rademeyer [10].
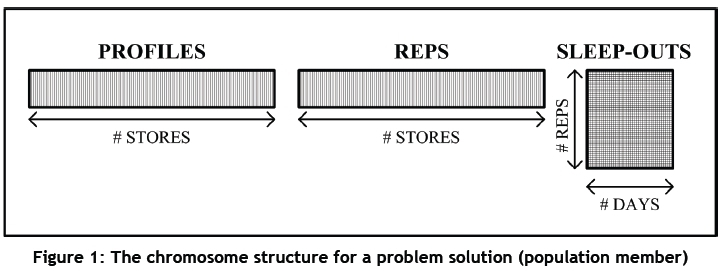
GAs and MAs are known as 'evolutionary algorithms' because a population of candidate solutions (individuals) is evolved toward better solutions through functions that alter each individual's properties. Each individual member in the population evolved by the MA is represented by a chromosome that is a vector encoding of a solution. The chromosome structure used in our algorithm is in fact a multi-part structure with two vectors and a matrix, as shown in Figure 1. Each vector/matrix element (a chromosome gene) is an integer value. In the first two parts, the vector length is equal to the number of stores, with the gene values being the profile and the rep to whom the store has been assigned respectively. In the matrix section, for each rep on each day, the binary gene value records whether or not a sleep-out has been inserted.
Each of the three parts of the chromosome corresponds with one of the decision variable types:
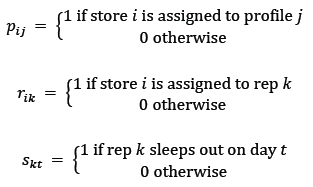
For each rep on each day, the stores to be visited are known for each chromosome. The daily routebuilding (stop-sequencing) per rep is done implicitly via an embedded route-building mechanism, and is not stored explicitly in the chromosome encoding. The MA's functions (described below) do not directly manipulate the stop sequence of a route. This is done using an incremental best insertion algorithm that updates the statistics in the route structure. The objective function value (fitness value) for each chromosome can thus be evaluated.
Simple additive weighting is used to calculate the fitness of each chromosome, with user-defined weights to indicate preferences for the features of the solution. The terms can be of three types: minimisation (total route distance and cost); maximisation (preferred days and reps); and balance (total time across the period, time between reps, number of stops between routes), to even out disparities between reps and days. Each term in the objective function is divided by a constant specific to that term to normalise the values, since each is measured in a different unit. The constants are determined from average values for each measure in the initial population, and are kept fixed for the duration of the run of the model. The objective is thus:

where each attribute xihas a weight aiand a scaling term - A penalty term is added to the objective if there are any broken constraints. Two constraint penalty violation weights are used: one for hard constraints (anchors, store-store exclusions, sleep-out rules, etc.), and one for soft constraints (time violation per day). The total hard constraint violation is multiplied by 1010. This value was chosen, as it was large enough to ensure that the worst feasible solution was always better than any infeasible solution, but not large enough to cause overflow problems. The soft time constraint violation was evaluated as the product of the soft penalty weight, hourly rep cost, and the square of the amount of time in excess of the stipulated overtime. A solution is marked as feasible if it does not break any hard constraints. A substantial gain in the objective function may mean that the violation of soft constraints is acceptable.
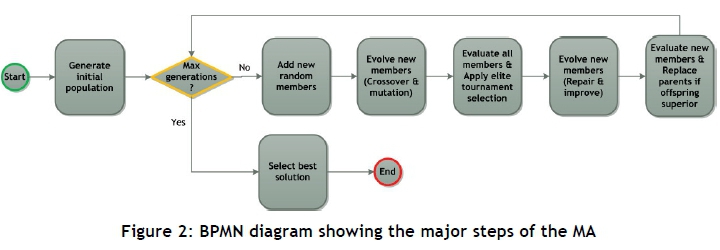
The main components of the MA are illustrated in Figure 2. The population management elements - generation of the initial population, evaluation of chromosome fitness (including constraint handling to determine if a solution is feasible), and the elite tournament selection operator (for choosing which chromosomes survive to the next generation) - are covered in detail by Rademeyer [10], along with details of the algorithm parameter tuning. GAs have two main types of functions that operate on, or alter, a chromosome's gene values: mutation and crossover. The algorithm featured here has some sleep-out-specific operators, such as a mutation for sleep-outs. MAs extend GAs with problem-specific repair and improve operators. Mutation, improve, and repair operators typically operate on a single chromosome at a time, whereas crossover blends parent chromosomes to generate children/offspring.
The 'repair' and 'improve' operators were designed after careful analysis of the properties of the solutions being generated by the algorithm. For example, the repair operator tries to correct a chromosome where a constraint has been, broken such as a 'daily working hours' time violation. The improve operators are functions that target particular aspects of the solution (such as workload balance), that are not controlled via constraints, and that try to improve them. These functions are used to 'polish' feasible chromosomes, since some desirable solution properties are insensitive to crossover and mutation operators, and need more problem-specific operators to improve them. In addition to these improvement techniques, various other heuristics are also employed in order to (i) remove outlying stores on routes and in rep areas, (ii) eliminate entire routes and/or reps, and (iii) minimise route and rep area overlap. Use was made of tools from the area of computational geometry in these operators. (More details are given by Rademeyer [10].)
3.3 Route maintenance
Sales force routes and territories typically need to be re-examined more often than vehicle routes, since depots and fleets do not change as often as the members of a team of sales people. When stores open and close in a particular geographic region, this may exceed the local rep's capacity to handle the extra work (on specific days) and require someone to be brought in who has to travel an extra distance to reach those stores. New stores may also then be assigned visit days based on the rep's free time, rather than on optimal visit days. On the other hand, the rep may be left with too little work if many stores close or reduce their visit frequency. Reps may also relocate or leave the company, causing coverage problems if new reps cannot be hired in the same area. On the topographical side, reps' territories are often designed to take into account natural barriers such as bays, mountains, etc. Should a new road be built, this could affect the design of optimal territories.
Sales force modelling is thus not a once-off exercise. Software like ORBIT can and should be used to support territory and route maintenance that is often avoided by sales managers. Typical reactions from managers to exercises of this type are well described by Hess and Samuels [29]: "the managers were pleased with the computer-prepared territories, felt the solutions were imaginative but realistic and usable, found them to incorporate some changes they had been considering and relieved them of a major clerical burden". They go on to say that "as with all management science applications, the development of a good model and the subsequent generation of a problem solution in no sense guarantee a successful application. Too many technically correct solutions never get beyond the analyst's office" [29]. Over forty years later, our experience with clients in various industries has been much the same. Easingwood [31] suggests that models should include all factors considered important to the client who is seeking a solution, even if it has to be in the form of a subjective estimate of one of the parameters or the rejection of a particular configuration. He also believes that if a potential user can evaluate and understand the model, it is far more likely to be implemented.
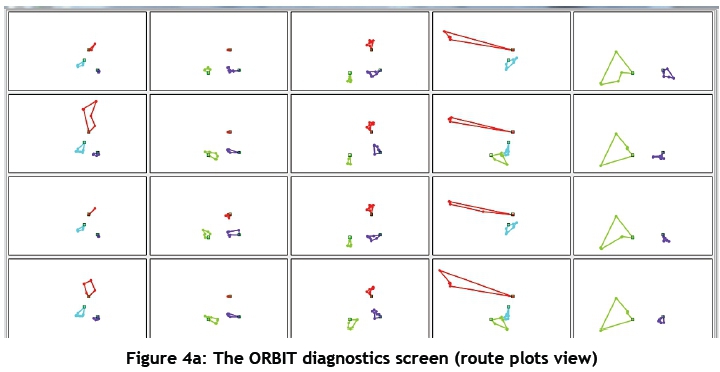
To this end, ORBIT was designed with a diagnostics screen. While the algorithm is running, the user can see summaries of the current best solution and stop the solver to make any data/parameter adjustments, rather than waiting for the solver to finish. The effects of any changes can be seen very quickly, giving the user a more hands-on controlled approach to problem-solving. The various windows can be seen in Figures 3 and 4 below. They display data either by day or by rep both as charts and as plots.
The diagnostic screen in Figure 3 summarises the solution statistics to indicate the following metrics for all reps:
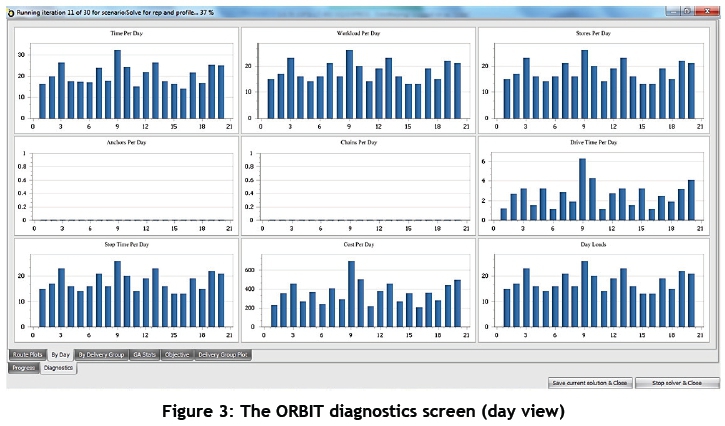
• Time per day (total work time in hours, comprised of drive time and stop time).
• Workload per day (hrs).
• Stores per day.
• Anchor1 stores visited per day.
• Chain2 stores visited per day.
• Drive time per day (hrs).
• Stop time per day (hrs).
• Cost per day (Rands).
• Day loads (only relevant if the rep goes home during the day or sleeps out; otherwise same as the number of stores per day).
Any imbalances or overtime can be quickly detected.
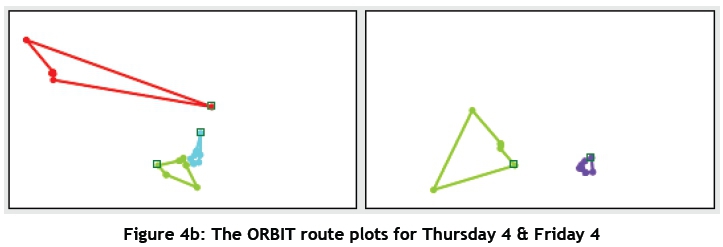
The screen in Figure 4a shows the routes for each rep (different colours) on each day of the planning period. In this example, there are four reps and 20 days (the rows represent weeks 1-4 and the columns Mon-Fri). It can be seen that not every rep works every day; on Fridays only two reps are busy. On Thursdays, one of the reps tackles all the stores in the west of the region, which have all been assigned to the same weekday, even though they have different frequencies. Figure 4b shows the rep activity for the fourth Thursday and Friday. The rep routes shown in red, blue and purple are for the reps who are busy on just one of the two days. The green rep works both days. The small squares indicate the home location. If all the routes for the 20 days were overlaid, the regions for each rep would be made visible.
The diagnostics screen also gives information about how the memetic algorithm is progressing - i.e., how the best solution found so far is improving on the objective value over the iterations. Combining this with statistics about all the candidate solutions being managed by the algorithm is extremely useful for debugging purposes and evaluating the performance of any new features added to the DSS when the need arises.
3.4 Execution mode
ORBIT can also be used daily in execution mode to handle visit priorities such as missed visits from the previous day or pursuing promising new leads before they go cold. These ad hoc visits can be folded into any regular visit schedules for existing stores. The daily route plans can also be sent to a customer relationship management application or be loaded on to hand-held devices on which various pieces of information at each stop can be captured, including placing an order for new stock. Such devices can also be used to provide turn-by-turn directions, to track the location of staff and to capture stop times. In this way, the planned route can be compared with the actual activities performed, and any discrepancies can be identified and/or master data updated accordingly.
4 CASE STUDIES
ORBIT's capabilities provide a rich set of tools, from calendar management to reporting, to aid visit day planning. Below are the details of a sales force planning exercise for a paint manufacturer, highlighting some misconceptions in this practice area of optimisation. This is followed by some high-level discussions of other case studies that highlight particular features of ORBIT: (i) accurate territory and resource planning for budgeting purposes; (ii) stratification of stores and reps to evaluate customer service plans; and (iii) complex visit profile modelling.
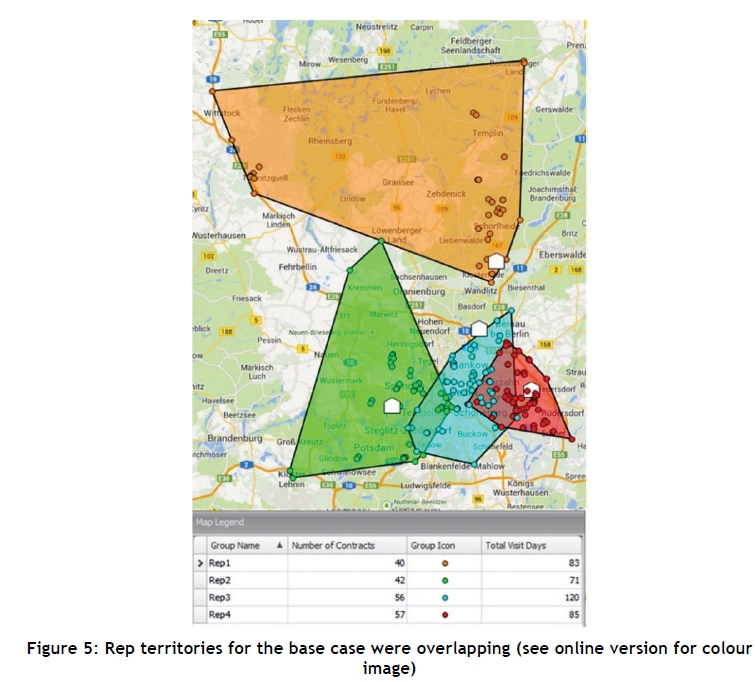
One of the biggest misconceptions we have come across in industry is that advanced tools and techniques are only useful for large sales forces that are difficult and time-consuming to plan. A recent consulting project involving ORBIT comprised just four reps over a four-week planning period, and resulted in savings of over 55 per cent after the re-assignment of stores to reps and visit days. If such an exercise had been as easy as the client first indicated, then why could they not achieve those results manually after so many years of practice? The first issue was that they were trying to balance the number of stores between reps and across days. Since each store has a different service duration and frequency, and the travel distance to each store is different, the correct metric to balance is workload - the total time worked, and not the number of stores visited. Using a tool also ensures that bias does not creep in when determining the reps' welfare. Secondly, the company did not have a record of where all their customers were located, and had thus never been able to plot them on a map. In fact, the map in Figure 5 clearly illustrated that there were a number of underdeveloped sales areas.
It was decided to run eight scenarios, starting with a base case, for the 196 store contracts and 359 visits. Stores were visited weekly, fortnightly, or monthly; visit times varied between 30 and 60 minutes; and reps worked eight hours a day, Monday to Friday. The original territories in use before the exercise, with a total travel distance of 5351 kms, can be seen in Figure 5. The remaining optimised scenarios, with their corresponding total distances, were as follows:
1. Kept the store-rep and store-profile assignments fixed and just re-sequenced the stops on each daily route. [4270 kms]
2. Loosened the pre-assignments by allowing for the stores to be assigned to a different rep with the same visit days. [4149 kms]
3. Loosened the pre-assignments by allowing for the visit days to remain unchanged under a new rep assignment. [3514 kms]
4. Both types of pre-assignments could be changed. The greatest savings were achieved with both relaxations in place, and the resulting territories are shown in Figure 6 (left). In all three of scenarios 2-4, optimal stop sequences were also determined as the daily routes changed. [2966 kms]
5. ORBIT determined the optimal home locations for the four reps, should the field force be replaced. This scenario had the lowest total distance. [2469 kms]
6. Reps were permitted to sleep out for a maximum of four nights per month and for no more than two consecutive nights. [2787 kms]
7. It was found that the work could in fact be done by one less rep (see Figure 6 (right)) without incurring any overtime or requiring reps to work a half-day Saturday, for example. [3217 kms]
The combination of optimisation and visualisation tools in ORBIT allowed for quick and detailed what-if analysis of these scenarios.
The territories in Figure 5 were determined by hand by simply assigning stores to the closest distribution depot under the incorrect assumption that this results in the minimum total travel distance. Reps then moved home, and there were changes in the store universe and the territories needed to be adjusted.
The total distance is higher in Figure 6 (right) because there is one less rep; but this scenario gives the largest cost savings.
4.1 Territory planning
In our experience, clients have always preferred that service territories be compact and never overlap because reps do not like seeing other reps working in their territory. However, the convex hulls of territories may overlap in an optimal solution, particularly in the case where the staff homes are not evenly dispersed across a region, or if the stores close to one home are all serviced more frequently than those nearer to a neighbouring one. In order to balance the workload, territory crossing must occur, and even moderately overlapping territories can save a lot of drive time. Kalcsis et al. [4] mention that, if waste must be collected with different frequencies, overlapping territories may have to be permitted.
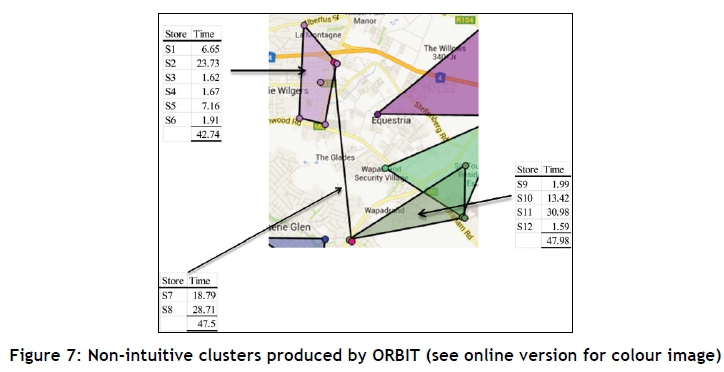
As an example of this, a global merchandising company was tendering for new work in South Africa, and needed to calculate the number of reps required. In Figure 7, six territories are shown, with the list of stores and their required service times per week for three of these territories. The maximum work time for any rep is 48 hours per week, including overtime. A grouping of the stores similar to that produced by ORBIT is unlikely to have been found by a human designer - particularly the cluster with just two stores. No exchange of either of these two stores with any others in this neighbourhood is possible without breaking the maximum work time limit.
The three complete clusters (one being made up of just two stores) have high time utilisation, and the stores are all located in a dense urban area. Once users are convinced of the ingenuity of these results, they can begin to rely on specialised tools such as ORBIT.
Prior to using ORBIT, this company was using simple spreadsheets to find the correct number of reps required. Each rep had 40 hours of work time per week, and 25 per cent of that time was assumed to be used for driving - irrespective of where the rep lived, the number of calls made, etc. They then simply ignored all constraints and divided the total work time available (30 hours multiplied by the number of reps) by the total visit time (visit time per store multiplied by the visit frequency summed over all stores) to get the number of reps required. If the tender was won, someone then manually assigned stores to reps using suburb data for each rep and store, again only looking at time and not visit day combinations, etc. Finally, each rep was presented with a list of stores and told to build daily routes, taking into account store profiles where possible. If any other constraints could not be met, they were resolved on an ad hoc basis. Not only was this a laborious process, but for highly-constrained problems it often resulted in an underestimate of the required number of reps for the tender. The solution time using ORBIT was obviously higher than that for the spreadsheet. However, such costing exercises are performed irregularly, and the results from ORBIT were not only complete but also far more accurate and scientific because they included driving distances, proposed visit times, sequences, etc.
4.2 Stratifying stores and reps
A large alcoholic beverage bottler, with over 60 000 customers and 500 reps, wanted to find out how sensitive their sales force size was to changes in the way they serviced their customers. They ran scenarios in ORBIT with different visit times for different store types or additional visits for marketing campaigns, but also with different store-rep exclusions. Each rep was placed in a rep class and each store in a store class. Stores in the high-end class could only be visited by top tier reps. Reps could call down to lower-end stores, but a bottom tier rep could not call up to high-end stores. The cost of such stratification could thus be evaluated accurately by running scenarios with and without the constraint. Many input data errors were picked up in the results; and, due to the speed at which ORBIT produced results, these could be amended and the algorithm re-run. This would not have been possible, given the time available, if the exercise had been done using other software.
4.3 Visit profiles and frequencies
A multi-national cigarette company was trying to determine how often their 400 sales reps should visit their 25 000 customers to take orders, usually a day or two prior to order delivery. They did not want to adjust their sales force size, only the visit frequency. If they saw all stores twice a week, the reps would be under-used; whereas if they went to all of them three times a week, the reps would work substantial amounts of overtime. Some low-end and high-end stores were pre-set to two and three visit days respectively, but the majority of stores needed their visit frequency to be determined by ORBIT. These stores were thus assigned different frequency-2 and frequency-3 profiles from which the algorithm could select. On examining the results, it was decided not to preset any stores to frequency-2 since, if they were in the neighbourhood of a pre-set frequency-3 store, they could get an additional visit (i.e., improved customer service) with a very small increase in cost.
ORBIT also handles the concept of multiple service contracts with the same client. Consider, for example, an industrial hygiene company performing multiple services at each client, such as servicing the bathrooms in an office block. The air freshener may need to be replaced once every six weeks, the hand soap every four weeks, and the hand towels on a fortnightly basis. During the 12-week planning period, the resulting schedule of services for the client, if working time per day allows, should be conducted on six visit days at most to minimise travel costs. Each visit is allocated the appropriate time to achieve the services for that visit.
Both of these examples with different frequency profiles would be extremely difficult to handle using manual techniques. In all likelihood, they would involve strong and limiting assumptions, and either the pre-assignment of profiles or limiting the number of profiles for a store. ORBIT can easily deal with such scenarios, and handles planning periods of any length.
5 CONCLUSIONS
Software providers are increasingly responding to industry requirements to make decision-support tools and optimisation solvers accessible to a wider audience. More graduates are also entering this market as consultants and logisticians. The more companies that are willing to work with experts in this field, the narrower will be the gap between theory and practice when solving large-scale problems with complex combinations of constraints.
In the current global economy, managers have never been under more pressure to deliver excellent service levels at the lowest possible cost while minimising and dealing with staff turnover. Planning and managing regular and cyclic visits for teams of people is both time-consuming and sub-optimal when done by hand or via spread sheets. To stay competitive, it is essential that managers employ powerful analytics to help them make such decisions to ensure an effective on-the-road team. With the continual growth in the variety of optimisation techniques, there is undoubtedly going to continue to be a rise in the number of different problems that need solving.
REFERENCES
[1] Eksioglu, B., Vural, A.V. and Reisman, A. 2009. The vehicle routing problem: A taxonomic review, Computers & Industrial Engineering, 57, pp 1472-1483. [ Links ]
[2] Schrijver, P.R. and Sol, H.G. 1992. Planning support for real-time fleet management of road transportation, Decision support systems: Experiences and expectations: Proceedings of the IFIP TC8/WG 8.3 Working Conference on Decision Support Systems, Elsevier. [ Links ]
[3] Freight Best Practice. 2007. Computerised vehicle routing and scheduling (CVRS) for efficient logistics, UK: Department for Transport. [ Links ]
[4] Kalcsis, J., Nickel, S. and Schroder, M. 2005. Towards a unified territorial design approach - Applications, algorithms and GIS integration, Socieded de Estadistica e Investigacion Operativa,13(1), pp 1-74. [ Links ]
[5] Drexl, A. and Haase, K. 1999. Fast approximation methods for sales force deployment, Management Science 45(10), pp 1307-1323. [ Links ]
[6] Balakrishnan, A., Ward, J.E. and Wong, R.T. 1987. Integrated facility location and vehicle routing models: Recent work and future prospects, American Journal of Mathematical and Management Sciences, 7(1/2), pp 35-61. [ Links ]
[7] Howick, R. and Pidd, M. 1990. Sales force deployment models, European Journal of Operational Research, 48, pp 295-310. [ Links ]
[8] Salhi, S. and Rand, G. 1989. The effect of ignoring routes when locating depots, European Journal of Operational Research, 39(2), pp 150-156. [ Links ]
[9] Vansteenwegen, P., Souffriau, W. and Sorensen, K. 2012.The traveling salesperson problem with hotel selection, Journal of the Operational Research Society, 63, pp 207-217. [ Links ]
[10] Rademeyer, A. 2013. Algorithmic approaches to solving multi-period sales force and delivery vehicle master routing problems, PhD thesis, University of the Witwatersrand, Johannesburg, South Africa. [ Links ]
[11] Prodhon, C. 2008. A metaheuristic for the periodic location-routing problem, in: Operations Research Proceedings, Vol. 2007, Springer-Verlag, pp 159-164. [ Links ]
[12] Hall, R., Du, Y. and Lin, J. 1994. Use of continuous approximations within discrete algorithms for routing vehicles: Experimental results and interpretation, Networks, 24, pp 43-56. [ Links ]
[13] Campbell, A.M. and Wilson, J.H. 2014. Forty years of periodic vehicle routing, Networks, 63, pp 2-15. [ Links ]
[14] Fleischmann, B. and Paraschis, J. 1988. Solving a large scale districting problem: A case report, Computers and Operations Research, 15(6), pp 521-533. [ Links ]
[15] Cloonan, J. 1972. A note on the compactness of sales territories, Management Science, 19(4), pp 469-470. [ Links ]
[16] Marlin, P. 1981. Application of the transportation model to a large-scale 'districting' problem, Computers and Operations Research, 8, pp 83-96. [ Links ]
[17] Vidal, T., Crainic, T., Gendreau, M., Lahrichi, N. and Rei, W. 2010. A hybrid genetic algorithm for multi- depot and periodic vehicle routing problems, Tech. Rep. CIRRELT-2010-34, Interuniversity Research Centre on Enterprise Networks, Logistics and Transportation. [ Links ]
[18] Petrakis, I., Hass, C. and Bichler, M. 2012. On the impact of real-time information on field service scheduling, Decision Support Systems, 53(2), pp 282-293. [ Links ]
[19] Jang, W., Lim, H., Raskin, G. and Perkins, T. 2006. Scheduling and routing sales representatives at the Missouri Lottery, in: 2006 IIE Annual Conference and Exhibition, Houston, Texas. [ Links ]
[20] Lodish, L. 1975. Sales territory alignment to maximize profit, Journal of Marketing Research, 12(1), pp 30-36. [ Links ]
[21] Foster, B. and Ryan, D. 1976. An integer programming approach to the vehicle scheduling problem, Operational Research Quarterly, 27(2), pp 367-384. [ Links ]
[22] Zoltners, A. and Sinha, P. 1983. Sales territory alignment: A review and model, Management Science, 29(11), pp 1237-1256. [ Links ]
[23] Blakeley, F., Bozkaya, B., Coa, B., Hall, W. and Knolmajer, J. 2003. Optimizing periodic maintenance operations for Schindler Elevator Corporation, Interfaces, 33(2), pp 67-79. [ Links ]
[24] Hadjiconstantinou, E. and Baldacci, R. 1998. A multi-depot vehicle routing problem arising in the utilities sector, Journal of the Operational Research Society, 49, pp 1239-1248. [ Links ]
[25] Wolfler Calvo, R. and Cordone, R. 2003. A heuristic approach to the overnight security service problem, Computers and Operations Research, 30(9), pp 1269-1287. [ Links ]
[26] Begur, S., Miller, D. and Weaver, J. 1997. An integrated spatial DSS for scheduling and routing home- health-care nurses, Interfaces, 27(4), pp 35-48. [ Links ]
[27] Maya, P., Sorensen, K. and Goos, P. 2012. A metaheuristic for a teaching assistant assignment-routing problem, Computers and Operations Research, 39, pp 249-258. [ Links ]
[28] Geoffrion, A. and Powers, R. 1995. Twenty years of strategic distribution system design: An evolutionary perspective, Interfaces, 25(5), pp 105-127. [ Links ]
[29] Hess, S. and Samuels, S. 1971. Experiences with a sales districting model: Criteria and implementation, Management Science, 18(4), pp 41-54. [ Links ]
[30] Schonberger, J. 2005. Operational freight carrier planning: Basic concepts, optimization models and advanced memetic algorithms. GOR Publications, Springer-Verlag. [ Links ]
[31] Easingwood, C. 1973. A heuristic approach to selecting sales regions and territories, Operational Research Quarterly, 24(4), pp 527-534. [ Links ]
Submitted by authors 3 May 2016
Accepted for publication 23 Mar 2017
Available online 26 May 2017
* angela.rademeyer@gmail.com
1 If stores are marked as anchor stores in the input data, then each route must contain at least one anchor store.
2 If stores are marked as chain stores in the input data, then the number of chain stores per route can be limited.

