


Servicios Personalizados
Articulo
 Inglés (pdf)
 Articulo en XML
 Referencias del artículo
Indicadores

Links relacionados
-
 Citado por Google
 -
 Similares en Google
Compartir

 Permalink
South African Journal of Industrial Engineering
versión On-line ISSN 2224-7890
versión impresa ISSN 1012-277X
S. Afr. J. Ind. Eng. vol.28 no.1 Pretoria may. 2017
http://dx.doi.org/10.7166/28-1-1607
GENERAL ARTICLES
Analysis of policy options for projects in the electricity sector in sub-Saharan Africa: a system dynamics approach
Graduate School of Technology Management, University of Pretoria
ABSTRACT
Many projects in the electricity energy sector in Africa's sub-Saharan region experience delays and challenges to quality, leading to frequent power outages that slow overall economic activity and frustrate investor confidence in the region. This paper presents the systemic methods employed to evaluate the dynamic consequences of policies in electricity energy sector projects in the region. The model uses the Vensim software to carry out the simulations. A range of illustrative scenarios are provided and analysed, and the paper compares and contrasts these different scenarios. The results show that there is merit in improving project management competence in the region. A shortage of commissioning engineers also emerged as a major problem in the projects, leading to multitasking as the few existing commissioning engineers move from one project to another. To address this weakness, the study proposes that contracting firms be compelled to employ a higher proportion of commissioning engineers.
OPSOMMING
Baie projekte in die elektrisiteit energiesektor in die sub-Sahara-Afrika streek ervaar kwaliteit uitdagings en vertragings, wat lei tot gereelde kragonderbrekings. Dit verlangsaam die algehele ekonomiese aktiwiteit en frustreer beleggersvertroue in die streek. Hierdie artikel bied die sistemiese metodes wat gebruik is om die dinamiese gevolge van beleid in die elektrisiteit energiesektor projekte in die streek te evalueer. Die model maak gebruik van die Vensim sagteware om die simulasies uit te voer. 'n Verskeidenheid van illustratiewe scenario's word aangebied en ontleed, en die verskillende scenario's word vergelyk en kontrasteer. Die resultate wys dat daar meriete is in die verbetering van projekbestuur kundigheid in die streek. Die tekort aan ingenieurs wat die projekte kan uitvoer, is ook uitgewys as 'n groot problem, waar die van die ingenieurs verwag word om met 'n multi-taak benadering tussen die projekte te beweeg. Om dit te adresseer, word daar voorgestel dat die kontrakteurs 'n groter hoeveelheid van die ingenieurs moet indiens neem.
1 INTRODUCTION
The electricity power industry is undergoing a period of rapid expansion in sub-Saharan Africa, and there are many current large-scale projects covering power supply generation scale-up, new transmission and distribution network construction, and upgrades to power distribution networks and substations. However, many of these projects have faced unforeseen risks and uncertainties, and end up running into lengthy schedule delays and substantial cost overruns. This has the combined effect of slowing development in the region and frustrating investors who have to cope with irregular and unreliable power supply, power rationing, and high power tariffs caused by the use of expensive short-term thermal power that has to be brought in to fill the gap. Key Issues in sub-Saharan Africa's energy sector include low access, insufficient capacity, poor reliability, and high costs. The shortage of essential electricity infrastructure undermines efforts to achieve more rapid social and economic development across sub-Saharan Africa. Therefore, dealing with uncertainties and risks that cause project delays and cost overruns is important to ensuring that future projects in the energy sector in the sub-Saharan region deliver value.
The primary motivation of this research is to expand the understanding of the interaction of risks and uncertainties affecting projects in the electricity power industry in Kenya and, by extension, in sub-Saharan Africa more generally. During this research, a system dynamics model that was representative of project dynamics in the region's electricity energy sector was developed with the aim of generating new insights into the dynamics at play in projects of this nature, and to explore policies that could be implemented by the Kenyan government and by the electricity utility companies to minimise project delays and quality challenges in the sector. The results of this study should benefit all of the stakeholders involved in the sector, including investors in the Kenyan energy sector and in sub-Saharan Africa. The key objectives of the research are twofold: (1) using a system dynamics approach, to develop a suitable experimental model for project variables that offer the greatest leverage on expected outcomes; and (2) to devise policies that could guide key stakeholders and government bodies such as the Kenyan Ministry of Energy to find better ways to manage projects in the sector in future.
Policy analysis is an interdisciplinary field of knowledge and a specialized applied science research method that uses systematic forms of inquiry, evaluation, and methods to support decision-makers in exercising their judgement [17]. The policy process involves six distinct phases: agenda setting, policy formulation, decision-making, implementation, evaluation, and termination [20]. According to Walker [18], public policy analysis is a rational and systematic approach to making policy choices in the public sector. Once confidence in the model is attained, the generation of policy solutions or options is based on experimentation, while policy solutions can also be generated based on scenario analysis [7]. The approach relies on trial-and-error simulation, whereby parameter values are changed to discover important system elements that can be used to influence policy and to derive policy recommendations [10]. This research will limit itself to policy formulation and decision-making areas arising from the analysis of the basic system dynamics model that has been developed, tested, and verified.
According to Sterman [15], policy design includes the creation of entirely new strategies, structures, or decision rules; and the robustness of policies and their sensitivity to uncertainties in the model parameters and structure must be assessed. This includes their performance under a wide range of alternative scenarios, as well as the interactions of different policies. This is because the impact of combined policies is usually not the sum of their individual impacts alone. Pruyt [11] notes that when designing policies to improve system behaviour, changes made to the model should only be those that could also be changed in the real world.
In this research, projects in the Kenyan electricity energy sector and, by extension, in the region at large, are designed to be completed in about 36 months; yet projects often experience delays, and might be completed in as much as 60 months, while in many instances the quality of the completed projects is below expectations. These findings are mirrored in the results of the basic model developed in this research. The agenda in policy design and analysis is therefore to explore various policy scenarios, and eventually to adjust and design the model to achieve on-time delivery of projects with the expected quality levels.
Under 'research method' below, the system dynamics modeling approach employed in developing the basic model in this research is described; then the basic model is presented and discussed. In the section headed 'scenario planning and modelling', different scenarios developed in the research are presented, analysed, compared, and contrasted, to determine which scenario can best deliver projects in sub-Saharan Africa on time and to the acceptable quality levels.
2 RESEARCH METHOD
The research method used to develop the basic model employs a system dynamics simulation approach to enhance the understanding of the research problem under investigation. Problem articulation deals with discovering any problems and the key variables. The system dynamics modelling process proposed by Sterman [15] and Warren [18] was used in developing the basic system dynamics model in this research. The process of Sterman [15] involves an iterative cycle starting with problem articulation, then formulation of a dynamic hypothesis, model formulation and development, testing, and finally policy formulation and evaluation (as shown in Figure 1).
![]()
Warren [18] offers a variation of the process of Sterman [15]: the agile model development process, which uses standard structures to complement the other processes. This involves re-using known, rigorous structures such as project management or supply-chain as the backbone for a new model. In developing the basic model, this research used the agile method to complement the process of Sterman [15] by extending a model previously developed by Richardson [14]. This research paper focuses on the policy formulation and evaluation phase of the modelling process. The causal loop diagram in the basic model in Figure 2 captures the risks and variables that were obtained and identified through discussions, interviews with practitioners in the power sector in Kenya, and focus group meetings that included representatives from the government, clients in the Kenyan power industry, and representatives from contracting firms active in that industry, and took into account reflections from the literature review (Brent et al. [1], Forrester [5], Musango et al. [9], Sterman [15], Sterman [16], Pruyt [11], Moyano and Richardson [8]).
3 OVERVIEW OF THE BASIC SIMULATION MODEL
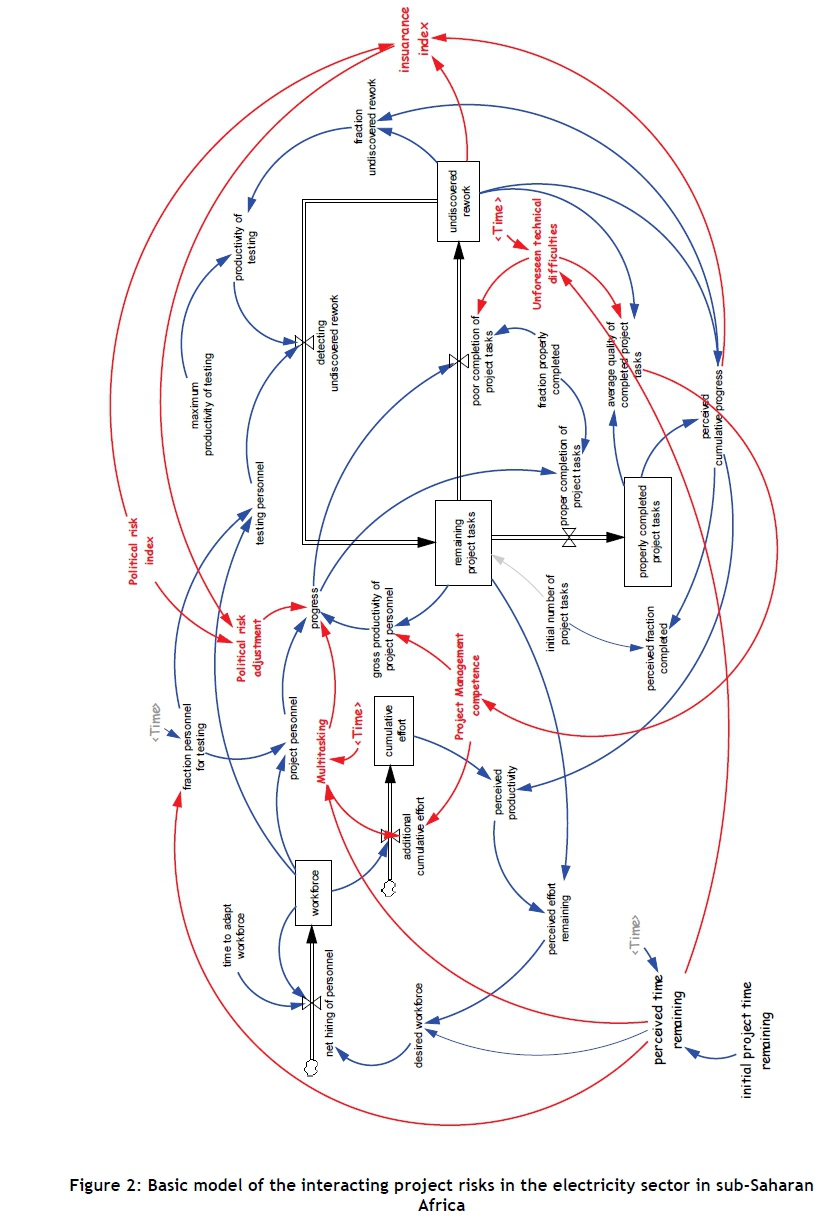
A dynamic hypothesis is a theory of why a system behaves in a certain way [13]. It is an important stage that is useful in collecting information about the problem through brainstorming with groups and through examining data, the literature, and personal experience. The dynamic hypotheses thus generated are also used to determine what will be kept in the model, and what will be excluded [15]. Over the years, dynamic causes identified in project environments through the system dynamics approach include rework [3], while the dynamic structure would also include the amplification of impacts due to delays in discovering rework that allow problems to be passed on to other phases without being dealt with [4]. In this research project, the dynamic hypothesis used to explain the persistent project delays and quality challenges, which was arrived at by undertaking an exploratory study that involved experts and stakeholders in the electricity industry, was that rework was a common problem. Additionally, engaging contractors who handle multiple projects often resulted into multitasking by key project personnel - especially the testing and commissioning engineers. And the element of political risk in the region and the low competence in project management in the industry and region - especially in contract administration - also emerged as serious impediments to on-time project delivery at acceptable quality levels. Figure 2 shows the basic model of interacting project risks that was developed in this research. The variables and arrows marked in red in Figure 2 are all new, based on feedback obtained from participants during the exploratory study in this research.
The model developed in this research incorporates the rework cycle. The rework cycle is the single most important feature of system dynamics project models, in which rework generates more rework that further generates even more rework [8]. It is the source of many project management challenges, and was first identified by Pugh Roberts Associates [12]. While most of the original work in projects is usually finished early in the project, delays are usually caused by the need to rework that original work. The model developed in this research uses the rework cycle, essentially because many projects in the power industry in sub-Saharan Africa suffer from rework that results in project delays. The rework cycle structure can be seen in Figure 2 as the portion containing the variables 'remaining project tasks', 'properly completed project tasks', 'undiscovered rework', and 'detecting undiscovered rework'. As indicated in Figure 2, poorly-completed project tasks lead to undiscovered rework, which is later discovered through testing and the tasks that have to be redone, which re-enter the 'tasks to be done' stock. The focus group discussions revealed that work progress is influenced by the productivity of project personnel, while undiscovered rework directly and negatively influences the quality of completed project tasks.
The workforce portion of the model captures how multitasking, project personnel, and gross productivity of project personnel influence progress, which is also influenced by political risk; while project management competence levels influence the productivity of project personnel and the cumulative effort employed in the project. The model structure also shows that the proportion of personnel available for testing, together with the productivity of the testing personnel, directly influences the detection of undiscovered rework; while progress influences the poor completion of project tasks as well as the proper completion of project tasks. Particularly noteworthy in the model in Figure 2 are parameters such as political risk, multitasking, level of project management competence, and unforeseen technical difficulties, which were found to present significant challenges in projects in the Kenyan electricity industry sector.
4 SCENARIO PLANNING AND MODELLING
Five scenarios are presented in this research: business as usual (Scenario 1); project management competence improvement through hiring staff with knowledge in project management skills (Scenario 2); equitable spread of workforce (Scenario 3); increased role for testing and commissioning personnel by increasing the overall percentage of technical staff (Scenario 4); and combinations of the above policies (Scenario 5). A similar scenario analysis was successfully used by Cavana and Tobias [2] in a dynamic analysis of policy options for tobacco control in New Zealand.
4.1 Scenario 1 - Business as usual
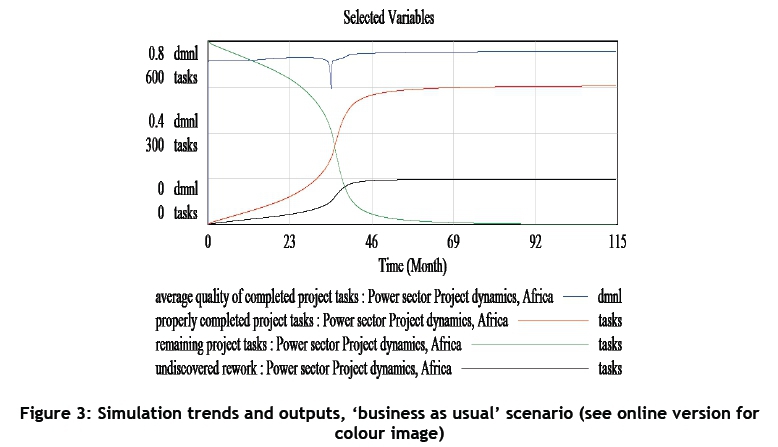
The 'business as usual' scenario assumes that the present trends and policies related to projects in the electricity energy sector in Kenya and in the region will remain the same into the future, as represented by the basic model developed in this research (Figure 2). The simulation outputs for the 'business as usual' scenario, given in Figure 3, were obtained after model verification and validation. The 'business as usual' scenario is the benchmark for all the other proposed intervention scenarios. In summary, it presents the prevailing situation where projects targeted at 36 months' completion time may take up to 60 months to complete, with 450 properly-completed project tasks by the end of the project against an initial goal of 600 tasks, and the average quality of completed project tasks at 0.75 (75 per cent) by the end of the project.
4.2 Scenario 2 - Project management competence improvement
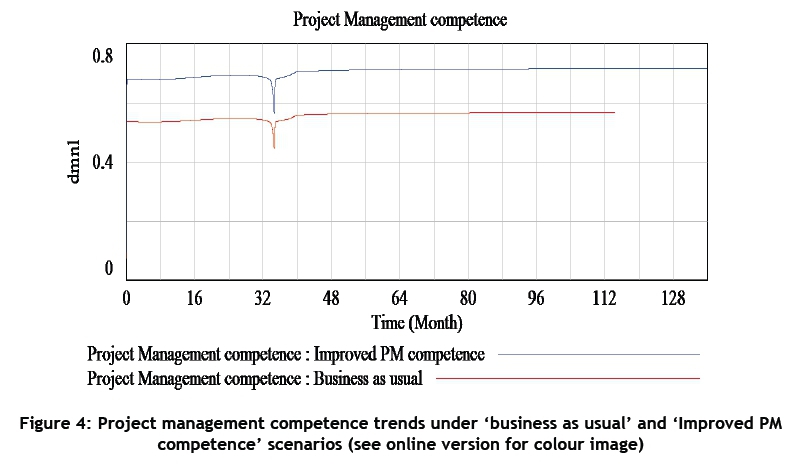
In the basic model, project management competence is modelled as a function of the average quality of completed project tasks, and was found to vary from a level of about 54 per cent at the beginning of the project to about 57 per cent at the end of the project. The increase in project management competence as the project progresses was found to hold true as a result of knowledge gained during the course of the project.
Through hiring project technical staff with project management skills, project management competence can be improved significantly. Assuming a target increase of project management competence by about 25 per cent, this can be achieved in the basic model by increasing the factor of 0.75 in the equation for project management competence in the basic model to 0.95 so that the equation becomes:
Project management competence = 0.95*MAX (average quality of completed project tasks, 0.1) ~ dmnl
The result on simulation is that the level of project management competence would then vary from about 68 per cent at the beginning of the project to about 72 per cent at the end of the project, as shown in Figure 4.
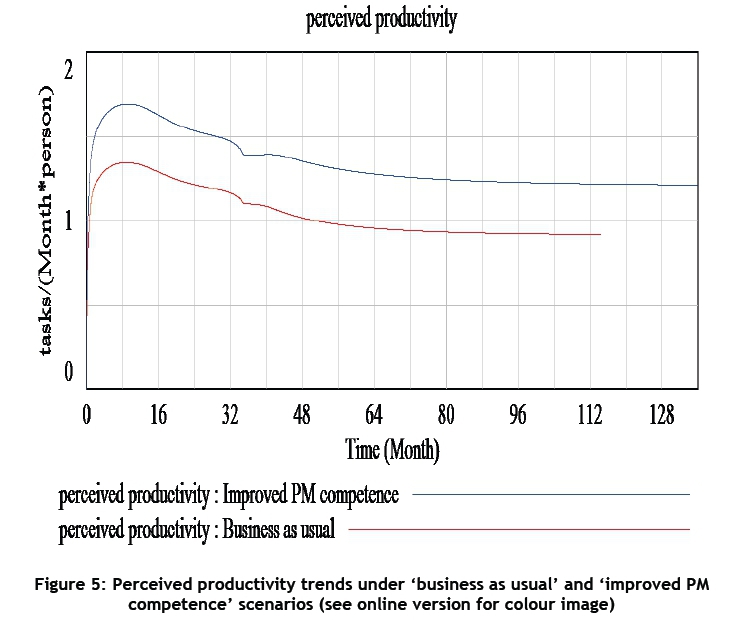
The immediate effect of this change in project management competence will be improved productivity. This is witnessed through the perceived productivity variable, which in the basic model rises to about 1.3 tasks/person/month before levelling off at about 0.8 tasks/person/month by the end of the project 60 months later, as shown in Figure 5, but which now improves and rises to about 1.7 tasks/person/month before dropping and levelling off at about 1.2 tasks/person/month at month 60, as indicated in the same figure.
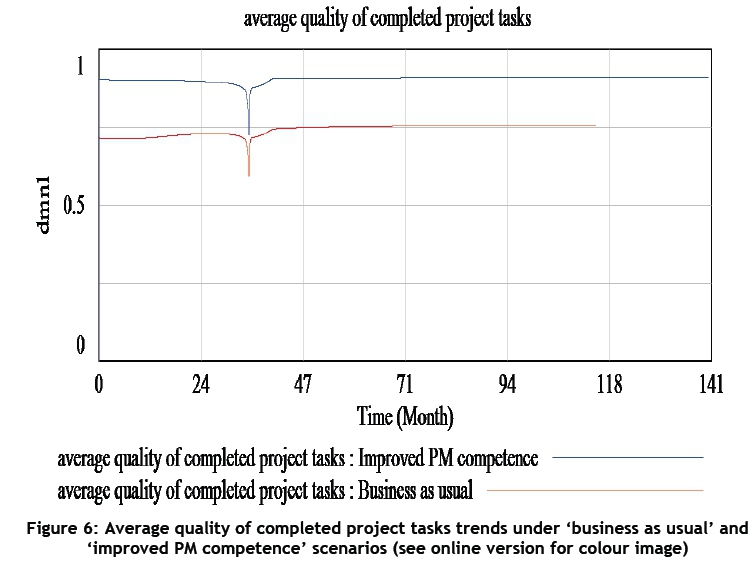
The increased competence of project personnel through hiring competent technical staff with project management skills is expected to result in the proportion of properly-completed project tasks (0.7 in the basic model) to rise considerably.
Assuming that the proportion properly completed increases from 0.7 to 0.9 due to the increased competence of project personnel when the model is simulated, the results shown in Figure 6 indicate that the average quality of completed project tasks would rise from an initial value of approximately 0.75 to a new value of 0.9.
4.3 Scenario 3 - Equitable spread of workforce
In the basic model, the desired workforce is modelled as:
Desired workforce = (perceived effort remaining/perceived time remaining)/8 ~ person
The factor of 8 in the equation for 'desired workforce' was used to achieve the peaking of workforce between the 34 and the 38 months of project time in the basic model, as is the practice in projects in the electricity sector in Kenya; and it was used in the equation following the results from the workshop with experts in the electricity sector. On simulation, this has the effect that workforce, project personnel, and testing personnel all peak at between 34 months and 38 months of project time when the project is supposed to be completed (Figure 7), and this often leads to project delays.
However, progress on the project would improve by having better-trained and more competent workers spread throughout the project's lifetime, thus reducing the effects of steep peaking of workers towards the end of the project's life, which results in project delays.
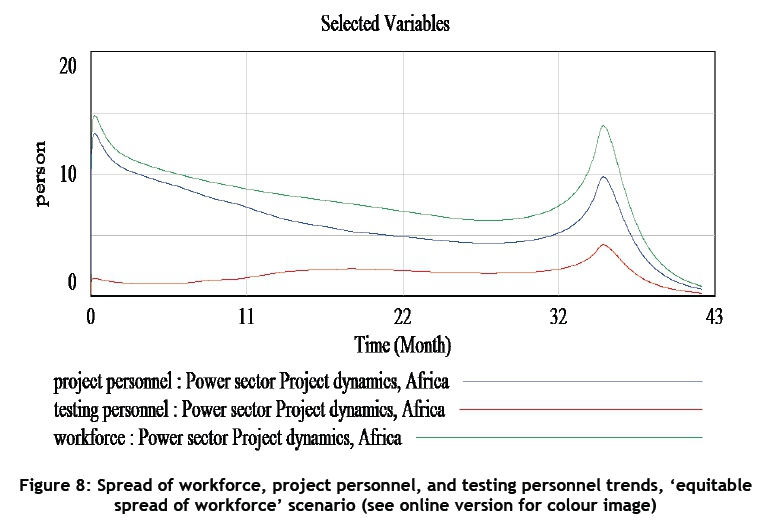
The effect of spreading the workforce can be achieved in the model by changing the equation for desired workforce to:
Desired workforce = perceived effort remaining / perceived time remaining
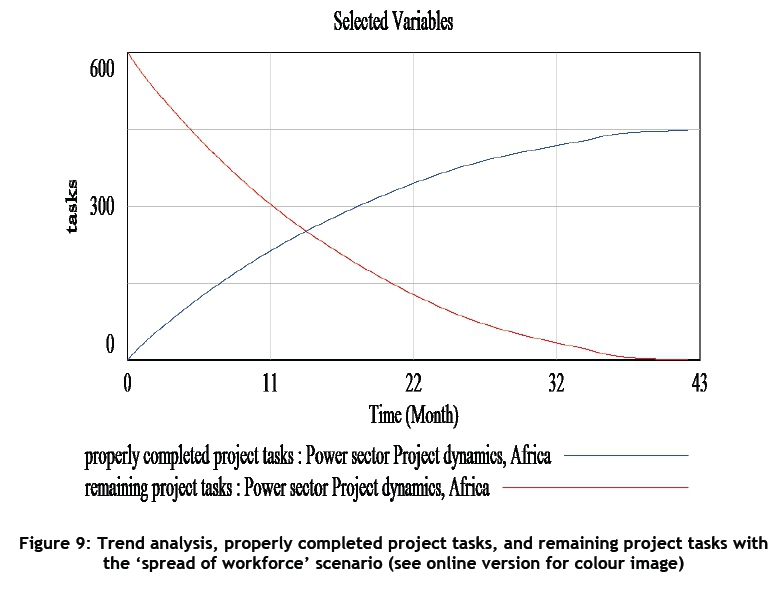
Figure 8 shows the results of the spread of workforce, project personnel and testing personnel on simulating the model after this change. The effect of this spread of workforce can also be seen in the changes in the time taken to project completion through properly-completed project tasks and the remaining project tasks of about 60 months in the 'business as usual' scenario in Figure 3 to the simulation results in Figure 9, which show that the project will now likely be completed in about 38 months.
4.4 Scenario 4 - Increased role for testing and commissioning personnel
During the workshop meetings with the stakeholders in Kenya, a persistent shortage of competent commissioning engineers was noted as contributing to delays and quality challenges experienced by projects in the Kenyan electricity energy sector, especially during the second half of projects. This was seen to contribute significantly to unforeseen technical difficulties that emerged towards the end of each project. Therefore, apart from spreading the workforce, hiring competent and qualified engineers and technicians was found to be critical for commissioning and testing functions -especially one year into a project, when equipment assembly and testing sub-system functions and operations is in progress. It is therefore desirable that the testing / commissioning personnel should form the larger proportion of the workforce one year into the project.
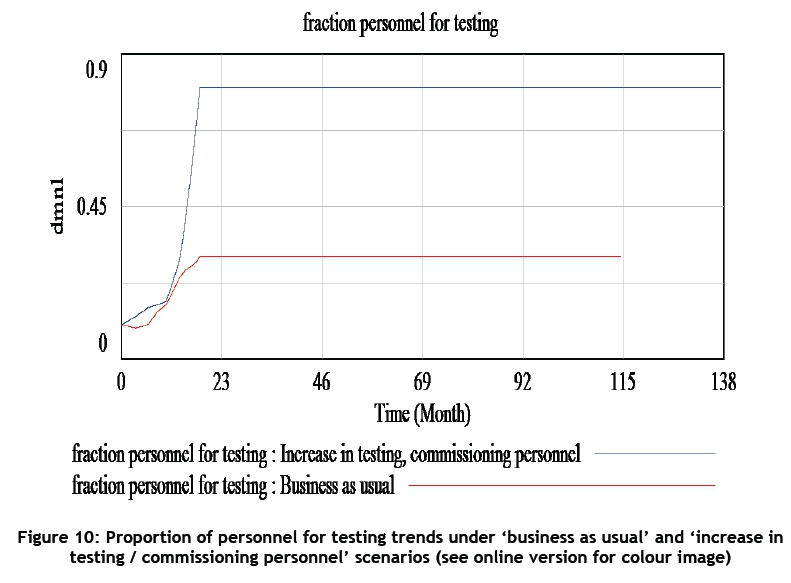
This effect can be achieved in the basic model by adjusting the equation for fraction personnel for testing to:
fraction personnel for testing = WITH LOOKUP (Time / perceived time remaining, ([(0,0)-(1,1)],(0,0.1),(0.2,0.15),(0.4,0.17),(0.6,0.3),(0.8,0.55),(1,0.8) )) ~ dmnl
On simulation, this has the effect of changing the trend of the proportion of personnel for testing, which originally peaked at about 30 per cent in the basic model, to the trend in Figure 10, where the proportion of personnel for testing rises to peak at about 75 per cent within 18 months of project time.
This new equation for the proportion of personnel for testing was developed following the views presented at a workshop with experts active in the electricity energy sector in Kenya.
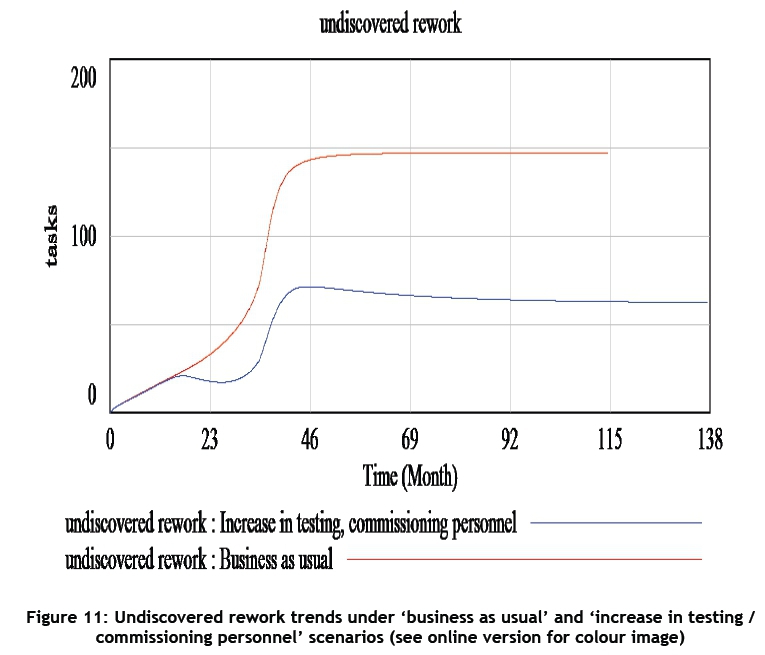
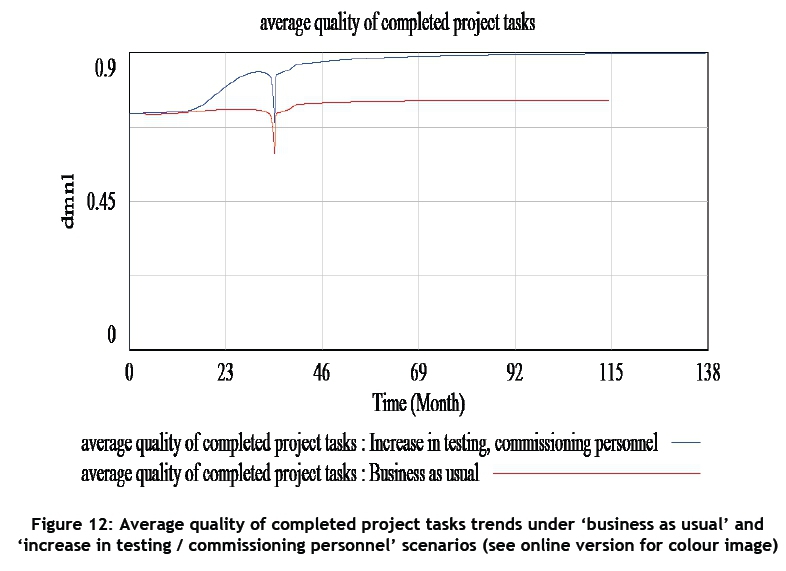
This has the effect of reducing the peaking of undiscovered rework from 150 tasks in the basic model to 70 tasks (as shown in Figure 11), and raising the average quality of completed project tasks from 0.75 in the basic model to about 0.89 (as shown in Figure 12).
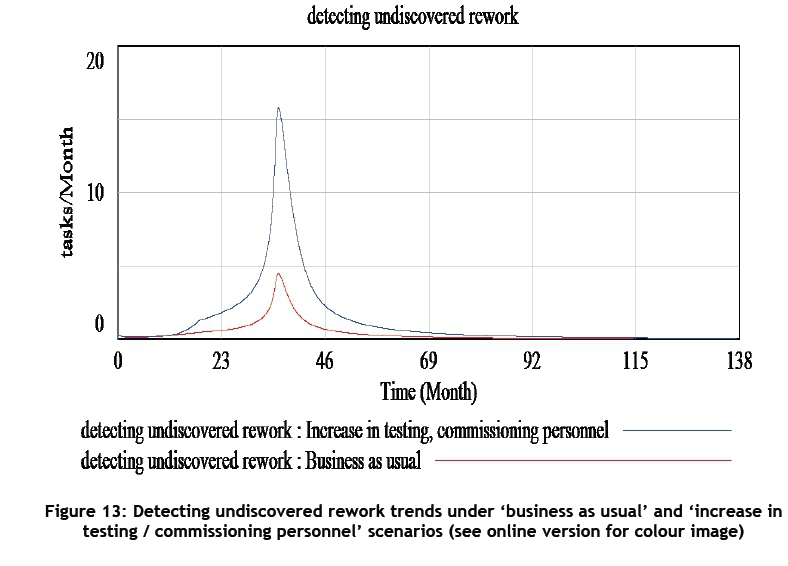
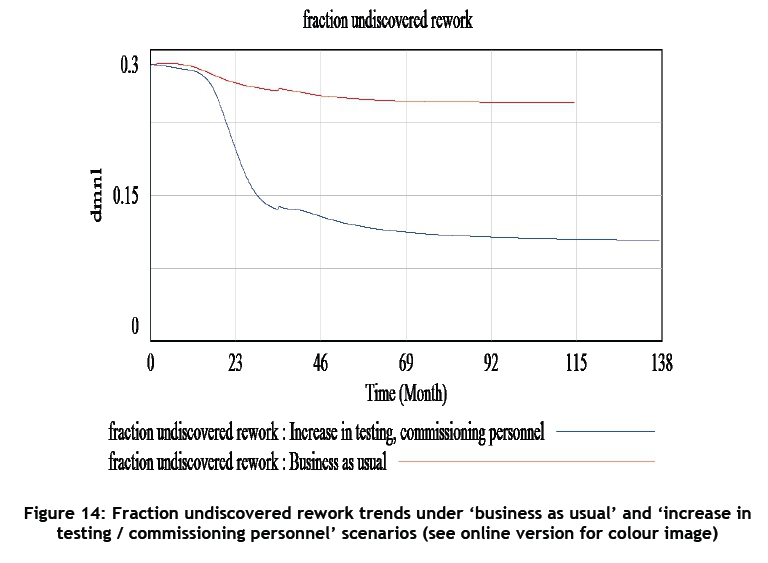
Increasing the role and overall proportion of testing and commissioning technical staff will also result in the projects having more engineers and technicians who play a major role during commissioning of the various items of equipment assembled in the projects, leading to improved efficiency in testing. Assuming that this results in the maximum productivity of testing increasing to six tasks/person/month, and then the model is simulated, the results shown in Figure 13 indicate that the rate of detecting undiscovered rework would increase and peak at about 18 tasks per month, while the proportion of undiscovered rework reduces to 0.075 by month 36 of project time (Figure 14).
4.5 Scenario 5 - Combined policies
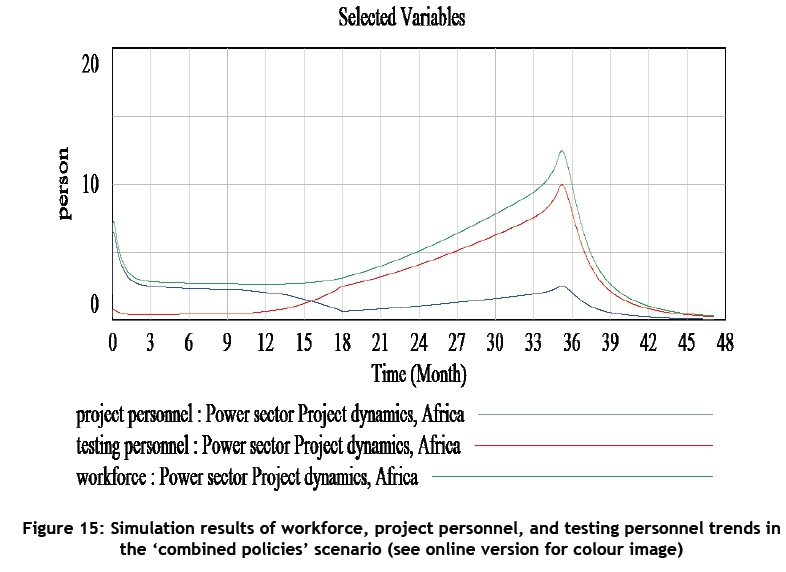
By combining all of the effects of the four policies, the results in Figure 15 indicate that the workforce, project personnel, and testing personnel are more spread out during the duration of the project - unlike before, when more staff were hired towards the end of the project. It also shows that testing and commissioning personnel form the larger proportion of the workforce after the initial 18 months.
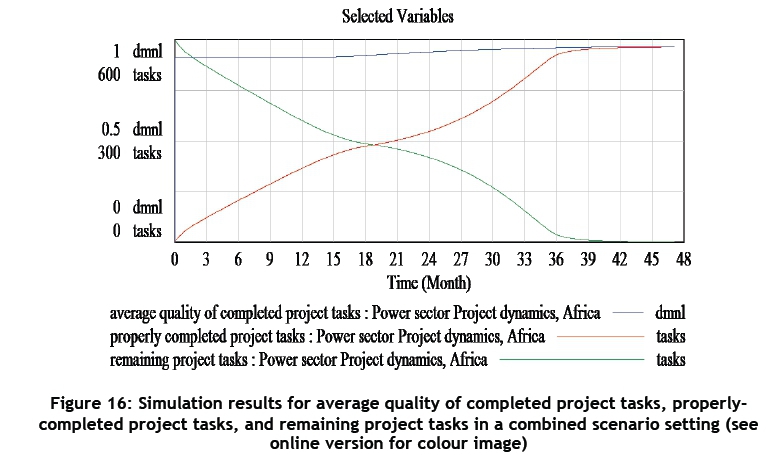
Figure 16 below also indicates that the remaining project tasks reduce from a high of 600 tasks at the beginning of the project to zero at about 37 months of project time, while properly-completed project tasks rise to a high of about 570 tasks in 37 months of project time. The average quality of completed project tasks rises from about 0.85 at the beginning of the project to about 0.95 by the end of the project, in 37 months. Similarly, the undiscovered rework of 140 tasks in the 'business as usual' scenario reduces to around 25 tasks in the 'combined policies' scenario.
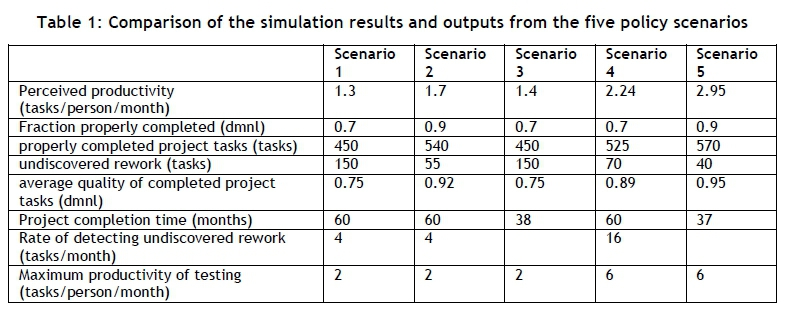
Table 1 compares and contrasts the simulation results from the five policy options. From the table, we can deduce that Scenario 5 (which combines the effects of the other scenarios) gives the best results, and is therefore recommended as the best policy option.
5 CONCLUSION
Five different policy scenarios were analyzed in this paper, using the system dynamics model developed for projects in the electricity energy sector in Kenya. From the results outlined, there is merit in improving project management competence among the contracting firms in Kenya and in the sub-Saharan region. This could be achieved by setting a higher threshold when sourcing the contracting firms. This will likely result in increased productivity in the projects and a higher quality of completed project tasks, as has been demonstrated by the simulation results. Spreading out the workforce, as opposed to hiring fewer personnel at the beginning of the project and only beefing up project personnel towards the end of the project, is also recommended, as it would lead to the on-time delivery of the projects.
Sessions with stakeholders in the sector indicated a clear shortage of commissioning engineers as a major problem in projects in the electricity sector in Kenya, leading to multitasking as the few commissioning engineers move from one project to another. However, the simulation results also show that increasing the proportion of personnel for testing, especially after eighteen months of project time, will reduce the effects of undiscovered rework by increasing the rate of detection of undiscovered rework while at the same time raising the quality of completed project tasks. This can be done by requiring bidding contracting firms to employ a higher proportion of commissioning engineers, and will likely lead to a reduction of the multitasking that is presently experienced in projects in the sector.
REFERENCES
[1] Brent, A.C., Musango, J.K., Smit, S., Pillay, N.S., Botha, A., Louw, R., Roper, S., Simelani, T., Clifford-Holmes, J.K. and Pretorius, L. 2016. Utilisation of system dynamics in Southern Africa: A systemic review. Syst. Res. http://onlinelibrary.wiley.com/doi/10.1002/sres.2401.Web 24 February 2017. [ Links ]
[2] Cavana, R.Y. and Tobias, M. 2008. Integrative system dynamics: Analysis of policy options for tobacco control in New Zealand. Systems Research and Behavioral Science, Vol. 25, 675-694. [ Links ]
[3] Cooper, K.G. 1993. The rework cycle: Benchmarks for the project manager. Project Management Journal, 24(1): 17-21. [ Links ]
[4] Ford, D. and Sterman, J. 2003. The liar's club: Impacts of concealment in concurrent development projects. Concurrent Engineering Research and Applications, 111(3): 211-219. [ Links ]
[5] Forrester, J.W. 1991. System dynamics and the lessons of 35 years, http://sysdyn.clexchange.org/sdep/papers/D-4224-4.pdf (Accessed 09/01/2015). [ Links ]
[6] Lyneis, J.M. and Ford, D.N. 2007. System dynamics applied to project management: A survey, assessment, and directions for future research. System Dynamics Review, 23(2/3): 157-189. [ Links ]
[7] Morecroft, J. 1988. System dynamics and microworlds for policy makers. European Journal of Operational Research, 35: 301-320. [ Links ]
[8] Moyano, I.J.M. and Richardson, G.P. 2013. Best practices in system dynamics modeling, System Dynamics Review, 29: 102-123. [ Links ]
[9] Musango, J.K., Brent, A.C., Amigun, B., Pretorius, L. and Muller, H. 2012. A system dynamics approach to technology sustainability assessment: The case of biodiesel developments in South Africa, Technovation 32: 639-651. [ Links ]
[10] Oliva, R., Saleh, M., Kampmann, C.E. and Davidsen, P.I. 2010. A comprehensive analytical approach for policy analysis of system dynamics models. European Journal of Operational Research,Vol. 203, No. 3, 673683. [ Links ]
[11] Pruyt, E. 2013. Small system dynamics models for big issues: Triple jump towards real-world complexity. Delft: TU Delft Library. [ Links ]
[12] Pugh Roberts Associates - PA Consulting Group. 1993. PMMS - Program Management Modeling System. PA Consulting, Cambridge, MA. [ Links ]
[13] Radzicki, M.J. and Taylor R.A. 1997. U.S. Department of Energy's introduction to system dynamics: A systems approach to understanding complex policy issues. System Dynamics Home Page.1997. http://www.systemdynamics.org/DL-IntroSysDyn/index.html. Web 22 May 2015. [ Links ]
[14] Richardson, G.P. 2013. System dynamics applications with impact. Rockefeller College of Public Affairs and Policy, University at Albany. First Global Conference on Research Integration and Implementation. https://www.pinterest.com/pin/352195633340888774/. Web 5 December 2016. [ Links ]
[15] Sterman, J.D. 2000. Business dynamics: Systems thinking and modeling for the complex world. Boston: McGraw-Hill. [ Links ]
[16] Sterman, J. 2001. System dynamics modeling: Tools for learning in a complex world. California Management Review, 43 (4), 8-25. [ Links ]
[17] Thissen, W.A.H. and Walker, W.E. 2013. Public policy analysis: New developments. Springer. http://link.springer.com/book/10.1007%2F978-1-4614-4602-6, Web 30 November 2015. [ Links ]
[18] Walker, W.E. 2000. Policy analysis: A systematic approach to supporting policy making in the public sector. Journal of Multi-Criteria Decision Analysis, 9, 11-27. [ Links ]
[19] Warren, K. 2013. Agile SD: Fast, effective, reliable. Risborough, UK: Strategy Dynamics Ltd. [ Links ]
[20] www.schoolofpublicpolicy.sk.ca, Web 14 September 2015. [ Links ]
Submitted by authors 1 Aug 2016
Accepted for publication 14 Mar 2017
Available online 26 May 2017
# The author was enrolled for a PhD degree at the Graduate School of Technology Management, University of Pretoria.
* leon.pretorius@up.ac.za

