


Services on Demand
Article
 English (pdf)
 Article in xml format
 Article references
Indicators

Related links
-
 Cited by Google
 -
 Similars in Google
Share

 Permalink
South African Journal of Industrial Engineering
On-line version ISSN 2224-7890
Print version ISSN 1012-277X
S. Afr. J. Ind. Eng. vol.27 n.4 Pretoria Dec. 2016
http://dx.doi.org/10.7166/27-4-1522
GENERAL ARTICLES
Investigating a green economy transition of the electricity sector in the Western Cape Province of South Africa: a system dynamics approach
J. OosthuizenI; A.C. BrentI, II, *; J.K. MusangoII, III; I. de KockI
IDepartment of Industrial Engineering, Stellenbosch University
IICentre for Renewable and Sustainable Energy Studies, Stellenbosch University
IIISchool of Public Leadership, Stellenbosch University
ABSTRACT
The Western Cape Government in South Africa has identified the concept of a green economy as a way to transform the Province's economy to one that is more sustainable from an economic, social, and environmental perspective. System dynamics modelling was used to develop a better understanding of the implications of different green economy policies and investments in the electricity sector of the Western Cape Province. The results suggest that continuing on the current policy path would increase the gap between demand and supply, increase the carbon footprint of the electricity sector, and not provide growth in employment in the sector. Strategic green economy investments are therefore expected to impact positively on a number of indicators across a number of sectors.
OPSOMMING
Die Wes-Kaapse Regering van Suid-Afrika het die konsep van die groen ekonomie geïdentifiseer as 'n werktuig om die provinsie se ekonomie te omskep in een wat meer volhoubaar is van 'n ekonomiese, sosiale, en omgewings perspektief af. Stelseldinamika modellering was gebruik om 'n beter begrip te ontwikkel van die moontlike voordele en impakte wat verskillende groen ekonomie beleide en beleggings in die elektrisiteits-sektor van die Wes-Kaap kan bewerkstellig. Die resultate van die modellering stel voor dat die voortsetting van die huidige beginsels en beleid sal lei tot 'n groter gaping tussen die aanvraag en die verskaffing van elektriese krag, 'n groter koolstofvoetspoor van die elektrisiteits-sektor, en geen groei in die werkverskaffing van die sektor nie. Daar word verwag dat strategiese groen ekonomie beleggings 'n positiewe impak sal bewerkstellig in menigte aanwysers.
1 INTRODUCTION
The green economy promotes the importance of decoupling economic growth and environmental degradation through improving efficiency in the use of resources and production processes, and the reduction of resource degradation, pollution, and waste [1]. Currently, the country's electricity supply is confronted with many challenges, and it is apparent that the need exists for the next energy transition. Such a shift should result in an electricity supply system that is more sustainable and inclusive in the economic, social, and environmental spheres. This shift would allow South Africa to transition to greener electricity production in a greater green economy.
Such a transition would require a trans-disciplinary and integrated approach to design and manage these key sectors. Maia et al. [2] point to the important role that local governments need to adopt in the implementation, coordination, and support of green projects. In 2013, the Western Cape Provincial Government developed the Western Cape Green Economy Strategy Framework, also known as the 'Green is Smart' document [3]. 'Green is Smart' is the Western Cape's roadmap to becoming the leader on the African continent in establishing a green economy. The Province's 'Green Economy Report' states that the role of the green economy is to reconfigure the relationship between the economy and the natural systems and resources on which it depends [4]. It further states that the green economy should create an environment that would simultaneously facilitate economic growth and social development, and protect environmental resources and systems. The Provincial government has identified three 'high level priorities for green growth' in the Province [3]: the pursuit of green jobs; the establishment of effective financial infrastructure; and the critical role of natural gas and renewable energy technologies. Transitioning to a green economy is not an easy process, and should be properly understood and managed. Managing technology transitions will be crucial to ensuring that the electricity sector in the Western Cape Province transitions to a more sustainable one.
The main objective of this paper is to investigate the investment requirements to transform the electricity sector in the Western Cape Province. The paper also:
• Explores the potential for a green economy transition in the Western Cape;
• Demonstrates the appropriateness of system dynamics modelling as a tool to analyse green economy policies;
• Demonstrates the key linkages between the different elements making up the electricity sector in the Western Cape;
• Explores the effectiveness of different policy interventions aimed at improving the sustainability of the electricity sector in the Western Cape; and
• Improves the analysis of green economy policies in the Western Cape electricity sector.
1.1 The electricity sector in the Western Cape Province of South Africa
The electricity sector plays a significant role in serving as a critical input for all other sectors of the economy. An important factor to keep in mind is that primary electricity supply in South Africa is a mandate of the National Government (under the National Energy Act, Act 34 of 2008). Not all the electricity generated in the Western Cape Province is used within its borders, and not all electricity consumed in the Province originates from within its borders. Furthermore, the role played by Eskom in electricity generation is expected to change in the future. The parastatal is expected to have a declining role, as independent power producers (IPPs) are set to develop a growing share of the national electricity generation capacity [9]. The Western Cape Provincial Government is then expected to play a critical role in assisting these IPPs to develop projects within the region. The Western Cape infrastructure framework (WCIF) [9] is intended to align the planning, delivery, and management of infrastructure to the strategic agenda and vision for the Province. It states that the current deficits in the electricity sector lie in the capacity to generate and source electricity to meet the growing demand of consumers. A focus is also placed on lowering the carbon footprint by implementing renewable energy technologies and facilitating locally-generated electricity. Three key electricity sector transitions were identified [9]: using gas as a transition away from coal-based electricity towards renewable energy technologies; facilitating the expansion of renewable energy capacity in the Province; and developing the associated manufacturing opportunities to support the expansion of renewable energy in the Province.
1.2 Sustainable technology transitions and transition management
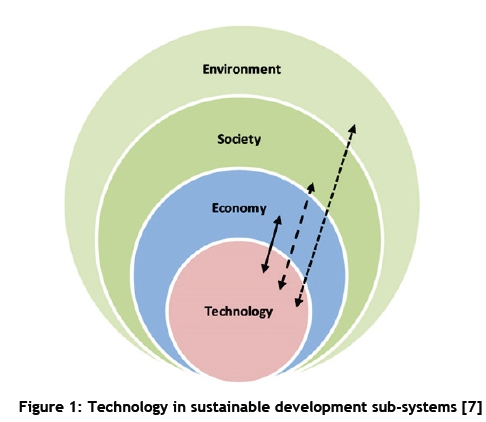
Transitions generally involve a broad range of actors, occur over several decades, and involve significant changes across different dimensions: technological, organisational, political, institutional, material, economic, and social [6]. Socio-technical systems refer to the conceptualisation of sectors, such as energy supply, water supply, and transportation [6]. The dynamics of these systems are heavily influenced by the fact that the constituents are significantly interrelated and interdependent [6]. Socio-technical systems have been understood to display complex, multi-scale, and adaptive properties [5]. The shift of established socio-technical systems towards more sustainable modes of consumption and production can be referred to as 'sustainability transitions' [6]. These shifts are characterised as being long-term, multidimensional, and fundamental in nature. Sustainable technology development is not an autonomous process; so its management is critical [7]. Markard et al. [6] state that transitions management is a discipline that combines the work on technical transitions with insights from complex systems theory and governance approaches. Musango and Brent [7] state that technology systems - throughout their entire life cycle - have an impact on the three dimensions of sustainable development: economic, ecological, and social. According to Musango and Brent [7], technology is embedded in the subsystem of the economic, societal, and environmental spheres, as related to sustainable development (see Figure 1).
1.3 Complex systems
Hofkes [10] states that the interactions between economic activities and the environment have to be modelled in order to investigate the correct conditions for sustainable development to take place successfully. Meadows [11] states that complex systems are characterised by non-linear relationships - between elements in the system - that cause feedback loops to vary in strength, subject to the state of the system. UNEP [12] defines a complex system as one that is dominated by dynamics that are often beyond control, resulting from the multiple interactions between variables that do not follow a regular pattern. Norman [13] states that a complex system is one that is "open to the outside world and is continuously exchanging energy with its surroundings", and one that affects its environment, and is affected by its environment. Complex systems consist of indefinable variables interacting in indefinable ways such that no combination of linear equations can represent the reality [13].
The causes of complexity, according to Chan [14], include the inter-relationship, interaction, and inter-connectivity of the elements making up a system, and between the system and its environment. Complexity theory is used to describe how unpredictability can be caused if these relationships are non-linear [13]. Chan [14] describes complex adaptive systems (CAS) as "dynamic systems that are able to adapt in and evolve with a changing environment", and are closely linked with, and co-evolve with, all other systems making up their ecosystem. According to Bassi [8], a clearer interpretation and understanding of the context of analysis is created when considering non-linearity in a system. Rotmans and Loorbach [15] argue that a greater insight into the dynamics of CAS could lead to improved insight into the feasibility of managing these systems in a more sustainable direction. Gaining insight into the behaviour of complex systems can greatly improve the effectiveness of transition management. Mei et al. [16] state that studying complex systems is essential to understanding and predicting the behaviour of these systems, and can have a significant impact on understanding the complex world around us. Constanza et al. [17] state that the analysis of complex systems could potentially offer significant insight into the behaviour of linked ecological-economic systems. Linear models are often unable to provide insights into the potential medium- to long-term impacts of policies [8]; thus dynamic models are ideal for this purpose. According to Bassi [18], an important criterion for such models is their ability to carry out investment and policy analyses.
1.4 System dynamics (SD) modelling
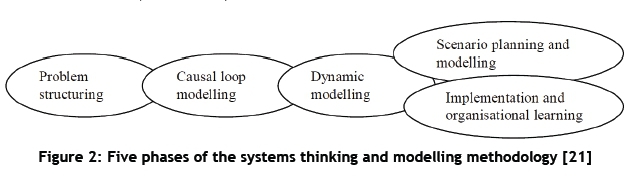
A complex system cannot be described by a linear equation or a combination of linear equations [13]. According to Bassi [8], conventional modelling tools are able to represent the details of the linear processes active in a real system, but lack the ability to investigate the dynamic relationships contributing to the behaviour of the system itself. Sterman [19] states that system dynamics (SD) should be seen as a perspective and a set of conceptual tools enabling us to understand better the structure and dynamics of complex systems. Bassi [8] states that the creation of a consistent and coherent framework to analyse the properties and structures of complex systems can be achieved through the act of combining feedback loops, non-linearity, and delays. SD models aim to understand the main drivers behind a system's behaviour by identifying the properties of real systems, such as feedback loops, nonlinearities, and delays [12]. Bassi [18] describes Sd as a methodology focused on creating descriptive models aimed at identifying causal relations within a system. SD models analyse causal relationships and formalise them into different equations, and then simulate and analyse them using computer software [20]. According to Sterman [19], these formal computer simulations of complex systems can be used to design more effective organisations and policies. The SD method represents systems using stocks and flows, and is ideally suited to represent the economic, social, and environmental aspects of development processes. Linking the energy sector to other dimensions of society, environment, and the economy contributes to the representation of the context in which different energy issues are analysed [8]. According to Cavana and Maani [21], there are five major phases in the development of a systems thinking and modelling intervention: problem structuring, causal loop modelling, dynamic modelling, scenario planning, and implementation and organisational learning (see Figure 2).
2 RESEARCH METHODOLOGY
The Western Cape Green Economy Model (WeCaGEM) was developed using the system dynamics approach, with the purpose of examining the complexities and implications of a green economy transition in the Western Cape Province of South Africa [22]. Integrating the concept of the green economy into a formal model calls for the amalgamation of the social, economic, and environmental systems being analysed. Such an analysis must occur across the different sectors of the Province, due to the dynamic nature of the green economy concept. WeCaGEM specifically focused on five green economy investment areas: biofuels, water infrastructure, agriculture, transport infrastructure, and renewable energy generation. The development of WeCaGEM followed the same conceptual framework used for the South African Green Economy Model (SAGEM) [23], with WeCaGEM being implemented on a provincial rather than a national level [22]. SAGEM analysed green economy investment interventions undertaken at a national level, but, in reality, the majority of these interventions are required to take place at a provincial or local government level. Policymakers at these levels need insight into what level of investment is needed to achieve their planned targets, or whether planned investments would be able to achieve their planned targets. WeCaGEM was developed, constructed, and simulated using VENSIM DSS, developed by Ventana Systems. A simulation time frame of 40 years was chosen, from 2001 to 2040.
2.1 The electricity sector in WeCaGEM
The WeCaGEM model consists of a number of sector models, but this paper only focuses on the electricity sector. In reality, the electricity grids of the different South African provinces cannot be separated, as they are all part of one large national grid. Nevertheless, for the purpose of analysing the Western Cape Province in isolation, the Province was assumed to have its own electricity grid. This was done to look at the Province's electricity sector as a single system separate from the electricity sector of the other eight provinces. The assumption then dictates that all the electricity that is generated by power stations in the Western Cape Province is used to supply only the electricity demand of the Province; all electricity generated in the Province stays within its borders and is used within its borders. When the Province's electricity demand exceeds the supply, the needed electricity is imported from outside the Province, and surplus electricity is exported when supply exceeds demand. Although the assumption states that the Province has its own independent electricity sector, the fact that the electricity price is regulated on a national level still applies.
Assuming that the Province's electricity sector is based in a free market, where prices are determined by market forces, would remove it too far from its position in reality. The assumption is made that price regulation takes place on a national level to maintain the fact that the Province's electricity sector is still part of a larger national network.
Electricity is generated by the installed electricity generation capacity that is present in the Province. When demand exceeds the electricity supply generated by the installed capacity, the gap must be covered by electricity imports from other provinces. Importing electricity is a necessary short-term option; but it can often be expensive, and compromises the Province's electricity security, making it dependent on the policies and agendas of other levels of governments and policymakers. Increasing the local electricity generation capacity can also cover the gap between electricity demand and supply. This requires investments in electricity generation infrastructure to fund the capacity expansion. Investments in capacity do not immediately yield increases in capacity. Due to the lengthy planning and building processes of power stations, there are time delays between the investment being made and the expanded capacity supplying electricity to the grid. The links between these components of the electricity sector form the main feedback loop of the model. Figure 3 illustrates the causal relationships between the electricity sector components that have been discussed, forming the causal loop, named B1, for electricity generation capacity expansion.
Installed electricity generation capacity does not have an infinite life; thus there is a process that decreases the capacity over time. The causal loop B2 is a negative feedback, or balancing, loop. An increase in capacity will, after a time delay, increase the capacity retirement rate, increasing the amount of capacity that is decommissioned. This retirement rate is subject to the installed capacity and the length of the operational life of the installed capacity. The length of the operational life is what determines the length of the delay.
The three main drivers behind electricity demand in South Africa are population, gross domestic product (GDP), and electricity price [24, 25]. Population and GDP are sub-models in WeCaGEM, while electricity price is an exogenous variable. This assumption arises from the fact that the Province has no control over the price of electricity, which is currently determined by the National Energy Regulator of South Africa (NERSA). These causal relationships affecting electricity demand can be seen in Figure 3.
Population is affected by the fertility rate of the population. The fertility rate, in turn, is affected by the size of the population and the value of GDP. Loop R1 is a positive feedback, or reinforcing, loop involving population and the fertility rate of the population. It is a reinforcing loop because an increasing population will have an increasing effect on the fertility rate, which then has an increasing effect on the population, causing a reinforcing effect. Increases in GDP will increase the fertility rate.
Combining the above-mentioned causal relationships for electricity generation expansion, electricity capacity decommissioning, and electricity demand, creates the conceptual model describing the electricity sector of the Western Cape Province. This model is then capable of conceptually describing the dynamic interactions and feedbacks between the different components of the provincial electricity sector.
From Figure 3, one can see the effects of the capacity expansion loop (B1) on employment, water consumption, and air (or carbon) emissions. Investments in electricity capacity increase employment in the electricity sector, because jobs are created in construction, manufacturing, and installation activities related to the electricity sector during the construction phases of power plants. An increase in installed electricity capacity will increase employment in the electricity sector as more jobs are created in the operation and maintenance activities involving power plants.
Including water demand and air (or carbon) emissions for the electricity generation technologies is essential in order to assess the environmental impact of investments in electricity generation technologies, and the impact of the entire electricity sector. An increasing water demand from the electricity sector could potentially place constraints on water supply, affecting industries that occupy a lower priority position for water supply than the electricity sector, especially in times of drought. The Province must account for all the emissions resulting from its electricity consumption, not only from its electricity generation. A region that consumes electricity and produces none is still responsible for greenhouse gas emissions; they are still responsible for greenhouse gases originating from their use of electricity.
The causal link between GDP and investment in electricity capacity can be seen in Figure 3. Capital cannot be designated for electricity capacity expansion if the capital does not exist. The GDP is a limiting factor affecting the investment in new capacity, and determines to what extent required investments in electricity capacity could be met by available capital. Figure 3 does not cover all the relationships present in the sector, nor does it include all the parts and feedback loops that make up the sector. Rather, it illustrates the most important relationships and feedback loops defining the dynamic behaviour of the electricity sector. These are the dominant relationships that define how the system responds to changes in its environment.
2.2 Data collection
The data used to develop the electricity sector of WeCaGEM were collected from various sources. An effort was made to collect data that are nationally available, or to use expert-based documents in South Africa. Where this approach was not possible, the best-available international data were used, in the form of data from global organisations - International Energy Agency, World Energy Agency, World Bank, and so forth - or in the form of peer-reviewed journal articles. In cases where data were unavailable for South Africa, assumptions were made using data for developing countries.
2.3 Model verification and validation
System dynamics models need to be subjected to two types of tests [26]: structural validity tests, and behaviour validity tests. Structural validity tests aim to determine whether the structure of the model is an acceptable representation of the actual system structure. Behaviour validity tests aim to determine whether the model is able to produce an output behaviour that is close enough to the behaviour of the actual system.
Five tests were conducted to validate the structure of the model [19]: structure verification test; parameter verification test; extreme conditions test; boundary adequacy test; and dimensional consistency test. Based on these tests, the structure of the model was deemed appropriate [27]. Three tests were used to investigate the validity of the model's behaviour [19, 26]: behaviour reproduction test; behaviour anomaly test; and behaviour sensitivity test.
In terms of behaviour reproduction, an assumption was made that there is no gap between supply and demand and that supply equals demand. The electricity demand produced by the model corresponds very well with the historical data for electricity demand. Another indicator that was used is the prediction for growth in electricity demand for the Province. An annual increase in electricity demand of 1.4 per cent for the Province between 2012 and 2040 is predicted [24]. The model's output for electricity demand also corresponded very well with this prediction.
Another assumption involves the total annual investment in new capacity. This variable requires the use of a MIN function to limit it to the total required investment in new capacity. The use of MIN, MAX, and IF THEN ELSE functions should be limited and properly motivated. This MIN function is required to ensure that over-investment in new capacity does not occur (24). An example is used where this MIN function is omitted and the investment in new capacity is equated to the portion of GDP that is made available for investment in new capacity. In the case where ten times the GDP is made available for investment in new capacity, the total operating capacity within the Province will greatly exceed the required capacity and supply will significantly exceed supply. This is abnormal behaviour, and warrants the use of the MIN function connected to the required investment in new capacity.
The elasticities of the drivers of demand - price, GDP, GDP per capita, and population - are the parameters for the model drawing the most interest when it comes to sensitivity. The elasticity values play a significant role in determining the electricity demand, which then determines how much electricity capacity is needed. The elasticity values of the drivers of electricity demand are also sensitive in the real system, determining how demand develops over time for a certain electricity sector. A sensitivity analysis was carried out separately on each driver of electricity to investigate the effects of changes in these parameters. Electricity demand was the most sensitive to variations in the price elasticity, mostly due to the fact that all drivers of electricity are affected by the price. The sensitivity of electricity demand to variations in the elasticity of GDP and population was also significant. This behaviour is to be expected from the real system, as changes in elasticities will have a significant effect on the electricity demand.
2.4 Scenarios
The purpose of developing the WeCaGEM electricity sector model was to investigate how different investment policies would affect the sustainability of the Province's electricity sector. This meant investigating the impact that investments have on the electricity-generating capacity, and the broader impacts on the social and environmental sectors. Three scenarios were developed to investigate different investment policies: business-as-usual (BAU), renewable energy (RE), and renewable energy with gas transition (RE+GT).
For the RE and RE+GT scenarios, strategic investments are only made from 2015 onwards. All three scenarios follow the same initial development from 2001 to 2014, which reflects the historical development of the sector during this time. This initial period involved no expansion of nuclear power or pumped storage capacity. This period included the development of two gas power stations between 2006 and 2009, with a total installed capacity of 2084 MW. The wind and solar projects that were approved before the end of 2015, during the first four Renewable Energy Independent Power Producer Programme (REIPPPP) bid windows, were also included in this initial period.
The two strategic investment scenarios - RE and RE+GT - were investigated for two investment cases. The first investment case - low investment case (LIC) - allocates 0.4 per cent of the Western Cape GDP towards investments in new capacity. Thus the GDP investment fraction (GDPIF) is equal to 0.004 for these two scenarios. The second investment case - high investment case (HIC) - allocates 0.7 per cent of GDP towards investments in new capacity, translating into a GDPIF of 0.007 for the two scenarios. These respective values of 0.4 per cent and 0.7 per cent were used in the SAGEM analysis' green economy investment scenario [28]. The SAGEM analysis took place at a national level, and it was decided to investigate what these investment allocations would lead to at a provincial level. For the two strategic investment scenarios, the policy decision is not made on what fraction of investments should go towards each technology, but rather on what fraction of the demand supply gap should be filled by which technology. Table 1 gives a summary of the net electricity supply factor for each scenario over the simulation period. The BAU scenario does not change for the two investment cases, thus giving a total of five scenarios. The BAU scenario was developed to investigate the case where the current investment policies would continue until 2040.
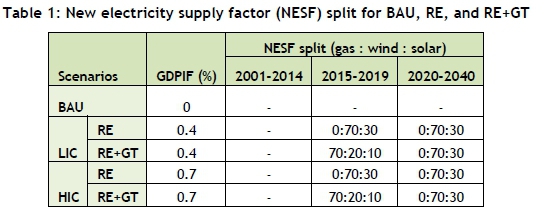
The RE scenario investigated the effects of a policy that aims to fill the demand supply gap using only wind and solar power, thus focusing all strategic investments on wind and solar technologies. For this scenario, all investments in new capacity are shared between wind and solar power technologies from 2015 to 2040. There is greater potential for wind power in the Province than there is for solar power, and wind power capital costs are slightly lower. Taking this into account, wind is preferred over solar and the new electricity supply fractions (NESF) are split 70:30 between wind and solar, with 70 per cent of the demand supply gap allocated to wind power projects, and 30 per cent going to solar power projects.
The renewable energy with gas transition (RE+GT) scenario investigated the case where natural gas power plants are used as a transition technology. Initially, gas power is targeted to fill a portion of the demand supply gap; thereafter, only wind and solar technologies are targeted to fill the demand supply gap. The new electricity supply factor split from 2015 to 2019 is 70:20:10 for gas, wind, and solar respectively. From 2020 to 2040, the split is 70:30 for wind and solar respectively. This policy is intended to close the gap between demand and supply rapidly by adding natural gas power capacity, before diversifying the energy mix and introducing significant renewable energy capacity.
In order to investigate the effects that these scenarios would have on employment, three sub-scenarios (low localisation, medium localisation, and high localisation) were investigated for each of the five main scenarios. Low localisation would imply that the majority of the parts and components for renewable energy technologies are imported from other countries, while high localisation would imply that the majority of these parts and components are manufactured locally.
3 RESULTS
The main focus of the results was to investigate the extent to which the key transitions of the Western Cape infrastructure framework (WCIF) [9] were achieved during the three scenarios. This translates into developing electricity-generating capacity in the Province, of which a significant portion must consist of renewable energy technologies. Apart from this main focus, the five scenarios were also investigated for their consequent effects on the carbon emissions and the water requirements of the electricity sector, and their impact on employment creation in the sector. This allows for the simulations to investigate the overall sustainability of the investment policy scenarios that were considered. These results should be viewed as possible projections of future developments of the Western Cape Province's electricity sector, given the implementation of certain investment policies.
3.1 The electricity supply
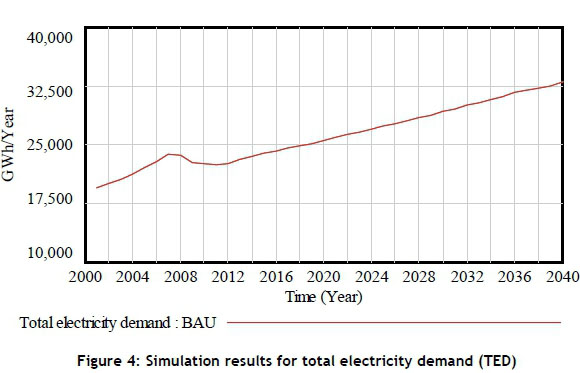
An important output of the electricity sector model is the total electricity demand (TED). This demand is expected to experience an increase of 70 per cent between 2001 and 2040, increasing from 19 420 GWh/year in 2001 to 32 990 GWh/year in 2040. The period between 2015 and 2040, when the policy implementations are active, is expected to see an increase of 38 per cent. This growth will be driven by growth in the Western Cape GDP and the Western Cape population. Figure 4 shows the expected growth in total electricity demand.
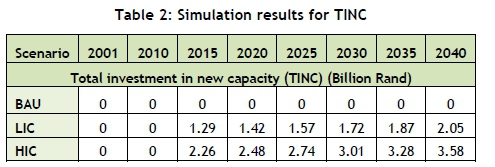
As the total electricity demand increases, there is an increasing demand for additional operating capacity in the Province. Thus total electricity demand acts as a driver of the total operating capacity by creating the need for investments in new capacity. Table 2 presents the results for total investment in new capacity (TINC), which is an annual investment in new electricity generating capacity. The strategic investment policies start in 2015; thus the value of total investment in new capacity is equal to zero between 2001 and 2014. The total investment in new capacity for both cases sees an increase of 58 per cent from 2015 to 2040, which is equal to the projected growth in Western Cape GDP over this period.
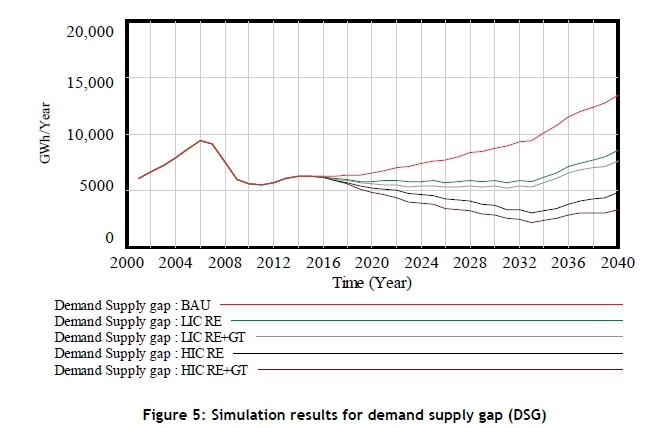
The five scenarios display similar patterns for the demand supply gap after 2015, with a sudden increase in the demand supply gap occurring after 2032. The total electricity demand does not show significant increases during this period; thus the total net electricity generated must affect the occurrence. The reason for this increase in the demand supply gap is the fact that the wind and solar plants that were commissioned in and after 2012 will start to be decommissioned. These projects have an operational life of twenty years, and their decommissioning reduces the net capacity added annually to the total operating capacity after 2032. Figure 5 presents the results for the demand supply gap.
The BAU scenario shows the least capability of reaching the WCIF's main goal of transitioning the Province's electricity sector to one that can fully supply the Province's growing electricity demand. As expected, the HlC scenarios are the most effective in decreasing the Province's demand supply gap.
3.2 The expansion of renewable energy capacity
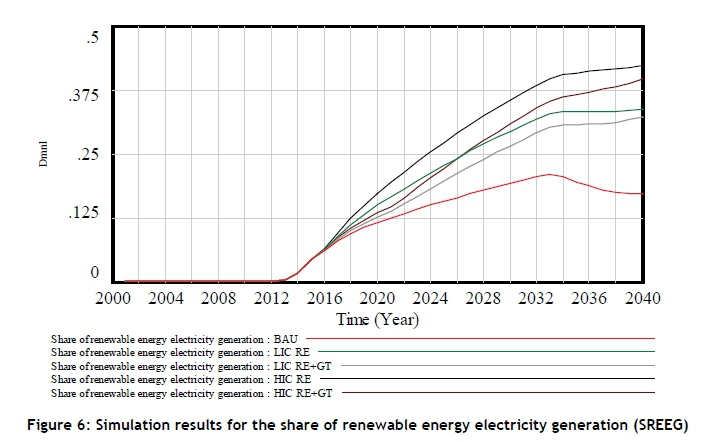
The share of renewable energy operating capacity (SREOC) represents the proportion of the total operating capacity that consists of renewable energy capacity, with the share of renewable energy electricity generation (SREEG) representing the proportion of locally-supplied electricity that originates from renewable energy technologies. From Table 3, one can see that the share of renewable energy operating capacity was less than one per cent before 2012, with no significant installed renewable energy capacity in the Province.
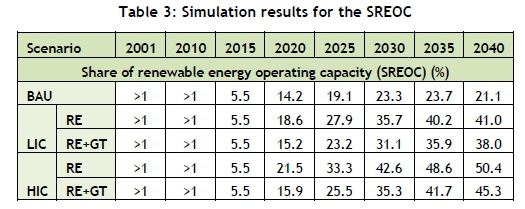
The BAU scenario fails to increase the share of renewable energy operating capacity and the share of renewable energy electricity generation after 2032, with both indicators decreasing between 2032 and 2040. The two RE+GT policies only show a small increase over the BAU case by 2020 due to the initial investment focus on gas technologies, but manage to outperform the BAU scenario significantly after 2020. The two RE policies, with their exclusive focus on renewable energy technologies, manage a higher share of renewable energy operating capacity than their RE+GT scenario counterparts. The HIC RE policy performs the best, managing to transform the electricity sector to a point where half of the total operating capacity consists of renewable energy technologies by 2040, translating to a share of renewable energy electricity generation of 42 per cent. The reason for the share of renewable energy operating capacity values being smaller than the share of renewable energy electricity generation values is due to the renewable and gas technologies having a smaller capacity factor than the two nuclear power reactors. Thus, with nuclear power as base supply, an increase in share of renewable energy operating capacity will not translate into an equal increase in share of renewable energy electricity supply.
The trend of decreasing growth after 2032 is due to the decommissioning of wind and solar capacity after 2032. The trade-off between the RE and RE+GT policies is evident from the simulation results so far. The two RE+GT policies manage a greater increase in the electricity supply than do their RE policy counterparts, but the RE policies offer a greater benefit in terms of diversifying the electricity generating capacity. The question is which policy contributes more to the overall sustainability of the electricity sector. A number of other indicators - including environmental and socio-economic indicators - have to be taken into account when investigating the overall sustainability of the electricity sector.
3.3 The environ mental impacts
The simulation results for the total annual air emissions (TAAE) produced during the five scenarios, are given in Table 4. In 2001, the power stations in the Province had a low carbon footprint, with the existing combination of nuclear reactors, pumped storage schemes, and back-up gas power turbines being responsible for only a small share of total annual air emissions. The majority of the 6.6 billion kg of CO2 emissions originated from imported electricity.
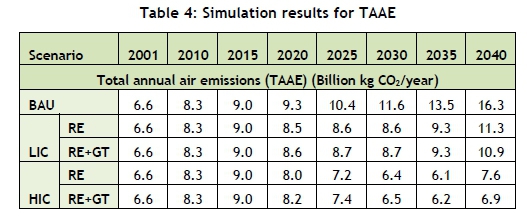
From 2015 to 2040, the results for total annual air emissions follow a similar trend to that of the demand supply gap (see Figure 5). This is due to the very low carbon emissions from the wind and solar capacity that is added during this period, leading to the changes in total annual air emissions being largely determined by the annual rate of electricity imports. The BAU scenario sees a continuous rise in total annual air emissions from 2001 to 2040, with an 81 per cent increase between 2015 and 2040. The two LIC policies show a decrease in total annual air emissions between 2015 and 2033, with the total annual air emissions increasing after 2033 due to increased electricity imports. The same pattern is evident for the two HIC policies. The two HIC policies are the only ones that manage to reduce the total annual air emissions in 2040 below their 2015 levels. The HIC RE and HIC RE+GT policies reduce total annual air emissions levels by 16 per cent and 23 per cent respectively between 2015 and 2040. The LIC RE and LIC RE+GT policies increase total annual air emissions levels by 26 per cent and 21 per cent respectively between 2015 and 2040.
An important observation from Table 4 is that the two RE+GT policies obtain lower total annual air emission values by 2040 than do their RE policy counterparts. This happens despite the higher CO2 emissions from the additional gas capacity added by the RE+GT policies. The additional total net electricity generated from the RE+GT policies offers a larger decrease in long-term total annual air emissions than do the RE policies, mainly due to the fact that they decrease the need for carbon intensive electricity imports.
The two nuclear reactors in the Province make use of seawater in an open-loop cooling system, thus significantly reducing the fresh water requirements of the reactors, compared with reactors using other cooling systems. Table 5 presents the simulation results of the total annual water requirements (TAWR) for the Province's electricity sector. The 11 per cent increase in total annual water requirement between 2001 and 2010 is mostly due to the additional gas power capacity that was developed.
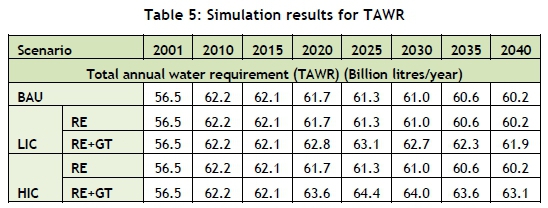
Overall, the five scenarios have very little impact on the total annual water requirement of the electricity sector. Solar and wind technologies have water requirements that are negligible compared with the nuclear, pumped storage, and gas power technologies. Thus the projections for the total annual water requirement of the two RE policies are identical to those of the BAU scenario. The gas power capacity added by the LIC RE+GT and HIC RE+GT policies only causes three per cent and five per cent increases respectively in total annual water requirement, compared with the other three scenarios.
3.4 The socio-economic impacts
The development of electricity sector employment was simulated to investigate the socio-economic impacts of the five policies. These five policies were simulated for three localisation scenarios - low, medium, and high localisation - to assess the effect of the localisation of manufacturing activities on the employment sector.
The BAU policy fails to increase employment after 2015, regardless of the level of localisation. The strategic investment policies significantly outperform the BAU policy across all three localisation scenarios. The RE+GT policies add more jobs to the sector than do the RE policy counterparts, with the difference between these two policies increasing as the localisation factor increases. This suggests that gas power plants create more employment in supporting the fuel supply sector than renewable energy plants do in supporting the manufacturing sector.
The results emphasise the effect that localisation can have on employment in the electricity sector. For the four strategic investment scenarios, the medium localisation policy created, on average, 25 per cent more jobs than the low localisation policy. The high localisation policy created, on average, 52 per cent more jobs than the low localisation policy. These increases are for total electricity sector employment, and not only for manufacturing employment. This can fuel the argument that renewable energy and gas power development can make a larger contribution to the employment sector if the manufacturing of components (for renewable technologies) and the development of fuel supply infrastructure (for gas technologies) are localised. The low localisation scenario is closely related to the Province's current position in terms of manufacturing capability. The medium localisation scenario is a more realistic view of the direction in which the sector can move, as the 100 per cent localisation used in the high localisation scenario is highly unlikely to materialise.
4 CONCLUSION
The Western Cape Government has stated its intention to facilitate a green economy transition in the Province. Transforming the Province's electricity sector will be critical in achieving such a transition. The current electricity sector is heavily reliant on nuclear and gas power technologies, and on imported electricity predominantly from coal-fired power stations situated in other provinces. Developing renewable energy capacity, such as wind and solar power plants, has the potential to transform the Province's electricity sector into one that is more sustainable from economic, environmental, and social perspectives.
Five policy scenarios were simulated and their results compared. The BAU scenario serves as the baseline scenario, giving an indication of what the development of the electricity sector will look like if it continues on its current path. The goal of the low investment case (LIC) and high investment case (HIC) policies was not to compare the two scenario results directly with one another. The expectation is that the two HIC policies will outperform the two LIC policies and the BAU policy because of the larger share of GDP that is invested through the two HIC scenarios. The focus should be placed on the impacts that these larger investments have on the electricity sector, and how much of an improvement is offered by a larger investment. The HIC and LIC policies should be compared with the BAU policy scenario, to investigate what different levels of investment will have on the electricity sector compared with the baseline scenario.
It is important to view the results from the simulation correctly and to understand what to focus on. System dynamics models are not intended to produce results that are numerically indisputable and display perfect numerical accuracy. The absolute values of the results can be challenged and disputed, but the area of interest is the development of trends and changes over time. The focus should be placed on changes in variables that occur and why these changes occur. Thus the point values are discussed, but the focus of discussion is predominantly on the changes in these variables over time.
The Western Cape Government has not set out specific goals for the electricity sector, but has identified certain priorities in terms of electricity sector infrastructure development. The Green economy report [4] and the Western Cape infrastructure framework [9] state the importance of developing natural gas infrastructure and renewable energy capacity, together with their fuel processing and component manufacturing capabilities.
The results for the BAU scenario clearly show the inadequate development of the electricity sector without the additional green economy investments. The share of renewable energy technologies increases during the BAU scenario, while at the same time the supply gap and electricity sector carbon emissions also increase. The four strategic investment policies show significant improvements for all indicators.
5 LIMITATIONS AND RECOMMENDATIONS
5.1 Model limitations and recommendations for future research
One of the challenges of SAGEM is that it addresses the green economy issues at a national level and not at a disaggregated provincial or city level. WeCaGEM and its electricity sub-model address these issues at a provincial level, but only with the Western Cape Province in isolation. For the sake of investigating the Province's electricity sector as an independent entity, the assumption was made that the Province's electricity sector will be regarded as being independent and isolated from the national electricity sector. This is, however, not the case in reality; the Western Cape Province is interlinked with and interdependent on the other eight provinces in South Africa. The development of sub-models for the other eight provinces would greatly benefit the understanding of how the provinces interact and interlink with one another, especially with regard to the national electricity sector.
The model investigates the allocation of investments in electricity generation infrastructure in the Province, but it does not address the source of these funds. The model simply addresses the impacts that these funds can have on the sector if they are invested in a certain manner. Such investments would come from a number of sources including national government, local government, private investors, and institutional investors. On a national level, in the past such funds have come from national government, either directly or through government-guaranteed loans. With the introduction of the REIPPPP [29], the funding of renewable energy projects has increasingly come from private and institutional investors. The Provincial Government is unlikely to fund any significant part of these investments, but it plays a critical role in developing policies and regulations to ensure that these funds are invested in a way that promotes its infrastructure goals. The electricity sector model can only benefit from additional structure to investigate the full cycle of funding comprehensively, from the source to the final destination.
Due to the long-term horizon of the electricity sector model, the issue of base-load power generation is not considered. The daily cycles of electricity supply and demand determine the need for base-load power. Thus the one-year time unit used in the model limits its ability to address the issue of base-load power, which does need to be taken into consideration, as wind and solar technologies are not well suited to provide base-load power, but rather to supplement the existing base-load power-generating capacity. The ability of a long-term model to address this is very limited. Thus it is an issue that should be considered and taken into account by decision-makers.
The electricity sector model investigates the sector's employment potential under certain conditions. This includes employment originating from the manufacturing sector supporting the electricity sector. Employment from manufacturing is determined using employment factors for wind and solar technologies. The model could greatly benefit from additional structures that investigate this manufacturing sector in supporting the development of renewable energy capacity. This could be used to investigate comprehensively the employment originating from these manufacturing activities. Such a sub-model investigating the supporting manufacturing sector can also give greater insight into how the electricity sector affects the broader economy.
The model uses the Western Cape GDP as an exogenous variable and provides no feedback to the Western Cape GDP. The effect that electricity sector employment has on the GDP is negligible, and the effect that electricity supply has on the economy is difficult to determine, and was not included in the model. An oversupply of electricity has no effect on the economy, but an undersupply negatively impacts the economy. The assumption is made that electricity is imported when there is an undersupply, and that total supply always meets demand. It would be beneficial to incorporate additional structures to address the issue of how the electricity sector affects the economy. Incorporating supporting industries, such as manufacturing and their outputs, to determine their contribution to the Western Cape GDP, could do this.
5.2 Recommendations for policymakers
Models of complex system behaviour, particularly system dynamics models, are increasingly being used to support governments and institutions in making decisions on green economy investments. Such models offer the ability to help build consensus on how systems work and which management options are the most effective. The electricity sector of the Western Cape Province forms a critical part of the Province's economy, and will be a critical component of any transition towards a green economy. It is a complex system that should be managed properly in order for it to contribute to a green economy transition. Provincial policymakers play an important role in managing such transitions of the electricity sector and of the broader economy. Decisions about and policies for the electricity sector cannot be effectively formulated unless the full extent of the impacts of such decisions and policies on the broader economic, environmental, and social sectors are taken into account. Thus this electricity sector model aims to provide some insight to policymakers into the possible scenarios that can develop, given the implementation of certain policies.
The long-term nature and impacts of investments in the electricity sector need to be thoroughly understood. The model results show the effect that increasing electricity demand and the short operational life of wind and solar power technologies have on the electricity sector. Future electricity demand is a very important factor that needs to be taken into account when decisions are made on where and how investments are made in the sector. Renewable energy technologies can significantly diversify the energy mix, offering a greener option of expanding electricity-generating capacity. However, the lack of proper planning when investing in these technologies could lead to supply problems in twenty years' time when these power plants need to be decommissioned. These plants do not enjoy the extended operating lives that more conventional power technologies - nuclear, coal, and hydro - are known for. When wind and solar plants are commissioned, plans should already be in place to replace their capacity when the plants need to be decommissioned.
Another aspect of renewable energy technologies that needs to be considered is the low capacity factor to which many of these technologies - wind and solar in particular - are subject. These technologies are not well-suited to base-load power supply, and are often more effective in supplementing the power supply from base-load sources. The role that these technologies are intended to play in the Province's electricity sector should be determined, and consequent planning should follow. This is an issue that can be aided by the use of natural gas power technologies. The open cycle gas turbines (OCGT) currently used in the Province offer low start-up delays, and can be synchronised to the grid far quicker than can nuclear reactors or coal-fired steam turbines. This could allow them to function in a way that would supplement the electricity supply from renewable energy sources. Short-term forecasts can predict the output from solar and wind sources, allowing the operators to plan when the gas turbines should be used to supply electricity. The results suggest that the use of gas power technologies, in addition to renewable energy technologies, could possibly offer greater environmental benefits than simply focusing on renewable energy capacity expansion.
The results strongly suggest the employment benefit in localising manufacturing and fuel supply jobs. This would entail developing a manufacturing industry that supports the renewable energy capacity expansion, and gas fuel processing and supply infrastructure that supports the natural gas power plants. The majority of the renewable energy technologies used in the country are imported from other countries. This means that only the minimum number of jobs is currently created by the electricity sector. Significant employment potential lies in localising these jobs by establishing these industries locally. The renewable energy industry is set to grow over the coming decades, not only in the Western Cape and South Africa, but globally. A large proportion of this growth is expected to come from the African continent. This creates a further incentive to establish these industries locally, which would allow the Province to benefit from the growth of these technologies by exporting the outputs from these industries.
REFERENCES
[1] UNDESA. 2012. Green economy, green growth, and low-carbon development: History, definitions and a guide to recent publications. Paris: United Nations. [ Links ]
[2] Maia, J., Giordino, T., Kelder, N., Bardien, G., Bodibe, M., Du Plooy, P., Jafta, X., Jarvis, D., Kruger-Cloete, E., Kuhn, G., Lepelle, R., Makaulule, L., Mosoma, K., Neoh, S., Netshitomboni, N., Ngozo, T. & Swanepoel, J. 2011. Green jobs: An estimate of the direct employment potential of a greening South African economy. Johannesburg: Industrial Development Corporation, Development Bank of Southern Africa, Trade and Industrial Policy Strategies. [ Links ]
[3] Western Cape Government. 2013. Green is smart: Western Cape Green Economy Strategy Framework. Cape Town. [ Links ]
[4] Western Cape Government. 2014. Green economy report. Cape Town. [ Links ]
[5] Smith, A. & Stirling, A. 2008. Socio-ecological resilience and socio-technical transitions: Critical issues for sustainability governance. Brighton: STEPS Centre. [ Links ]
[6] Markard, J., Raven, R. & Truffer, B. 2012. Sustainability transitions: An emerging field of research and its prospects. Research Policy, 41, pp. 955-967. [ Links ]
[7] Musango, J.K. & Brent, A.C. 2011. A conceptual framework for energy technology sustainability assessment. Energy for Sustainable Development, 15, pp. 84-91. [ Links ]
[8] Bassi, A.M. 2009. An integrated approach to support energy policy modelling. Doctoral dissertation, Bergen: University of Bergen. [ Links ]
[9] Palmer, I. & Graham, N. 2013. Western Cape infrastructure framework. Cape Town: Western Cape Government. [ Links ]
[10] Hofkes, M.W. 1996. Modelling sustainable development: An economy-ecology integrated model. Economic Modelling, 13, pp. 333-353. [ Links ]
[11] Meadows, D. 1976. The unavoidable a priori. Proceedings of the System Dynamics Society, pp. 161-240, available from: http://www.systemdynamics.org/conferences/1976/proceed/meado161.pdf. [ Links ]
[12] UNEP. 2014. Using models for green economy policymaking. Paris. [ Links ]
[13] Norman, G. 2011. Chaos, complexity and complicatedness: Lessons from rocket science. Medical Education in Review, 45, pp. 549-559. [ Links ]
[14] Chan, S. 2001. Complex adaptive systems. ESD.83 Research Seminar in Engineering Systems, Massachusetts Institute of Technology, available from: http://web.mit.edu/esd.83/www/notebook/Complex%20Adaptive%20Systems.pdf. [ Links ]
[15] Rotmans, J. & Loorbach, D. 2009. Complexity and transition management. Journal of Industrial Ecology, 13, pp. 184-196. [ Links ]
[16] Mei, S., Zarrabi, N., Lees, M. & Sloot, P.M.A. 2015. Complex agent networks: An emerging approach for modeling complex systems. Applied Soft Computing, 37, pp. 311 -321. [ Links ]
[17] Constanza, R., Wainger, L., Folke, C. & Maler, K.-G. 2009. Modeling complex ecological economic systems. Bioscience, 43, pp. 545-555. [ Links ]
[18] Bassi, A.M. 2014. Using simulation models for green economy policy making: A comparative assessment. Review of Business and Economics Studies, 2, pp. 88-99. [ Links ]
[19] Sterman, J.D. 2000. Business dynamics: Systems thinking and modeling for a complex world. Boston: McGraw-Hill. [ Links ]
[20] UNEP. 2011. Modeling global green investment scenarios: Supporting the transition to a global green economy. Paris. [ Links ]
[21] Cavana, R.Y. & Maani, K.E. 2000. Systems thinking and modelling: Understanding change and complexity. Auckland: Prentice Hill. [ Links ]
[22] Musango, J.K., Brent, A.C., van Niekerk, J.B.S., Jonker, W.D., Pienaar, A.P., York, T.A., Oosthuizen, J., Duminy, L. & de Kock, I.H. 2015. A system dynamics approach to understand the implications of a green economy transition in the Western Cape Province of South Africa. International Conference of the System Dynamics Society, Boston, USA. [ Links ]
[23] Department of Environmental Affairs (DEA) & United Nations Environmental Programme (UNEP). 2013. Green economy modelling report for South Africa: Focus on the sectors of natural resource management, agriculture, transport and energy. Pretoria, Available online: http://www.sustainabilityinstitute.net/newsdocs/document-downloads/cat_view/23-research-project-outputs?start=10 (accessed 1 March 2016). [ Links ]
[24] Inglesi, R. 2010. Aggregate electricity demand in South Africa: Conditional forecasts to 2030. Applied Energy, 87, pp. 197-204. [ Links ]
[25] Musango, J.K., Brent, A.C. & Tshangela, M. 2014. Green economy transitioning of the South African power sector: A system dynamics approach. Development South Africa, 31(5), pp. 744-758. [ Links ]
[26] Barlas, Y. 1989. Multiple tests for validation of system dynamics type of simulation models. European Journal of Operational Research, 42, pp. 59-87. [ Links ]
[27] Oosthuizen, J. 2016. Investigating the effects of a green economy transition on the electricity sector in the Western Cape Province of South Africa: A system dynamics modelling approach. Masters thesis, Stellenbosch University. [ Links ]
[28] Musango, J.K., Brent, A.C. & Bassi, A.M. 2014. Modelling the transition towards a green economy in South Africa. Technological Forecasting & Social Change, 87, pp. 257-273. [ Links ]
[29] Pieters, I.J., Lotz, M. & Brent, A.C. 2014. Investigating the financial close of projects within the South African renewable energy independent power producer procurement programme. South African Journal of Industrial Engineering, 25(3), pp. 57-68. [ Links ]
Submitted by authors 23 May 2016
Accepted for publication 27 Oct 2016
Available online 6 Dec 2016

