


Services on Demand
Article
 English (pdf)
 Article in xml format
 Article references
Indicators

Related links
-
 Cited by Google
 -
 Similars in Google
Share

 Permalink
South African Journal of Industrial Engineering
On-line version ISSN 2224-7890
Print version ISSN 1012-277X
S. Afr. J. Ind. Eng. vol.27 n.4 Pretoria Dec. 2016
http://dx.doi.org/10.7166/27-4-1496
GENERAL ARTICLES
Critical review of the levelised cost of energy metric
M.D. Sklar-ChikI, II; A.C. BrentI, III; I.H de KockI, *
IDepartment of Industrial Engineering, Stellenbosch University
IIEskom Power Plant Engineering Institute, Eskom Holdings
IIICentre for Renewable and Sustainable Energy Studies, Stellenbosch University
ABSTRACT
The purpose of this paper is to critically review the 'levelised cost of energy' metric used in electricity project development. This metric is widely used, because it is a simple metric to calculate the cost per unit of electricity for a given technology connected to the electricity network. However, it neglects certain key terms such as inflation, integration costs, and system costs. The implications of incorporating these additional costs would provide a more comprehensive metric for evaluating electricity generation projects, and for the system as a whole. It is therefore recommended to refine the metric for the South African context.
OPSOMMING
Die doel van hierdie artikel is om krities te kyk na die 'levelised cost of energy' meeteenheid wat gebruik word in die ontwikkeling van elektrisiteit projekte. Die meeteenheid word wyd gebruik, want dit is 'n eenvoudige manier om die koste per eenheid elektrisiteit te bereken vir 'n gegewe tegnologie wat verbind is aan die elektrisiteitsnetwerk. Maar dit laat sekere sleutelterme, soos inflasie, integrasie koste, en stelselkostes, na. Die implikasies van die uitvoering van hierdie bykomende kostes sal 'n meer omvattende meeteenheid daarstel vir die evaluering van elektrisiteit-opwekkingsprojekte, en die totale elektrisiteitstelsel. Dit word dan aanbeveel om die meeteenheid vir die Suid-Afrikaanse konteks te verfyn.
1 INTRODUCTION
South Africa has had a monopolistic electricity sector for many years, with Eskom, the state-run electricity supply company, being responsible, as owner and operator, for the majority of electricity generation. Eskom supplies around 45 per cent of power needs on the continent of Africa. This is due to South Africa being part of the Southern African Power Pool (SAPP)1, which connects a number of the Southern African Development Community (SADC) member states. This also presents an opportunity for collaboration and generation, not only within South Africa's borders, but also beyond them, in potentially supplying more power to the members of the SAPP.
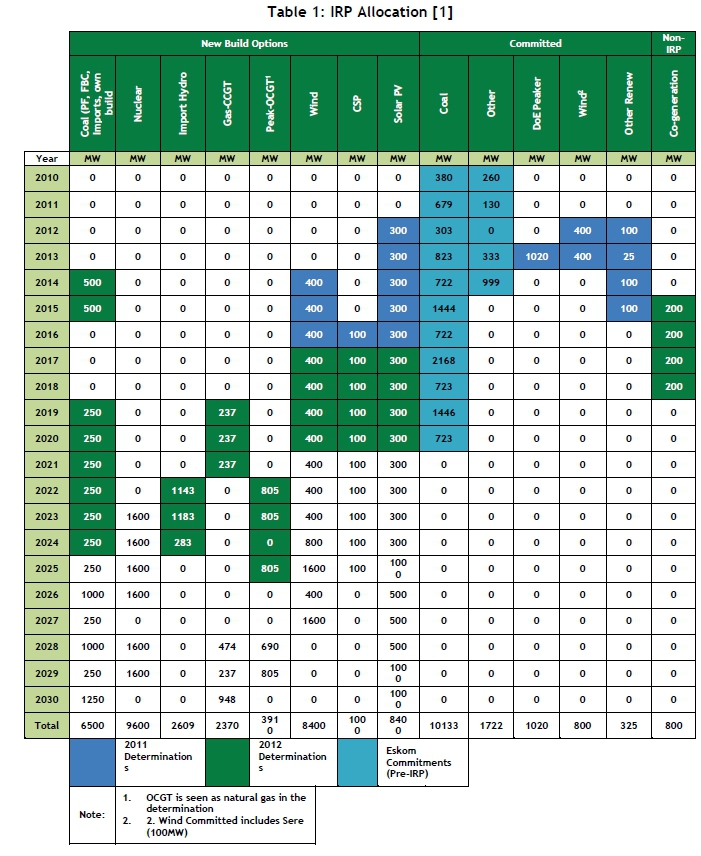
For a number of reasons, South Africa has seen a shortage of electricity supply. One reason for the shortage has been the diminishing margin between electricity supply and demand. As a planning tool, the national Department of Energy (DoE) developed the Integrated Resource Plan (IRP), which sought to predict the future capacity needs of the South African electricity sector. In doing so, each technology (nuclear, fossil-fuelled, and renewable energy) received an allocation. Table 1 is an extract from the IRP for 2010-2030 [1].
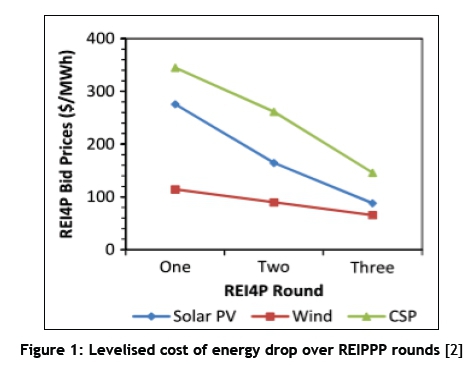
To address the current and future supply gap, the government embarked on the Renewable Energy Independent Power Producer Procurement Programme (REIPPPP)2, which sought private investment. This programme is a competitive bidding procurement approach, with a number of bidding rounds that issue set amounts for each type of technology. The REIPPPP reached the end of round four in 2015, and since then the costs of energy that have been procured have dropped considerably, as seen in Figure 1 [2]. Renewable energy projects are reaching grid parity, and are being viewed as a more commercially attractive and feasible option, whereas before they were punted as the 'green' or 'sustainable' energy option. The cost (average indexed price) of the wind projects accepted in round four of the REIPPPP is around ZAR 0.619/kWh, and R0.786/kWh for solar photovoltaic (PV) [3]. Thus both wind and solar PV projects in the REIPPPP's fourth round are below the range of ZAR 1/kWh for new-build coal and gas options.
The REIPPPP has been so successful that the DoE is preparing further bidding rounds for coal, natural gas, and co-generation, and potentially for further renewable energy projects. These will follow formats similar to the renewable energy bidding rounds.
Traditional project finance sees companies opting to keep projects off their balance sheets so that they are separately ring-fenced entities. Thus a project will be solely reliant on the revenue stream that can be captured through the project.
Economic methods for project evaluation include[4]:
1. Simple payback period - ratio of extra costs to annual savings;
2. Initial rate of return - inverse of the simple payback period;
3. Net present value (NPV) - includes time value of money and a discount rate for the cash flows;
4. Internal rate of return (IRR) - the discount rate that causes the NPV of electricity investments to become zero;
5. Cash flow analysis; and
6. Levelised cost of energy (LCOE) - the present value of energy costs divided by the energy generated.
Another useful metric for testing the viability of a project is the debt service coverage ratio (DSCR) [5], which is represented by the formula:

While the values are numerical and unit-less, the DSCR metric tests whether interest and principal repayment can be met by the project. Ratios above 1 are imperative, with safe ranges specific to different industries. For the electricity sector, above 1.2 and up to 1.5 are typical targets [5].
Thus it is clear that there are a number of ways to measure and compute project metrics. However, the focus of this paper is on the LCOE metric, because it is popular and widely-used in conventional electricity generation projects [6,7].
The objective of this paper is to evaluate the LCOE metric critically. In evaluating it, its utility and limitations will be discussed and elucidated upon.
2 METHODOLOGY
A semi-structured systematic literature analysis was undertaken by identifying key concepts in the LCOE metric, such as the input costs and the variables used to compute the power generated. This review was guided by the information and knowledge relevant to understanding and explaining the LCOE. Having introduced the metric and variations therein, the areas not typically covered in the LCOE are presented, such as externalities, system costs, different technology types underlying the LCOE analysis, and other issues. From this review, a conclusion is drawn on the utility of the metric at a system level.
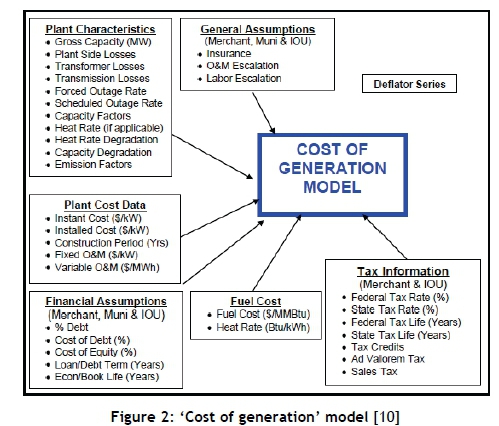
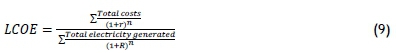
Described in simple terms, the LCOE is as follows:
However, to calculate the total discounted expenses and the total discounted power, a number of input values are required (For further insight into the derivation of the formula, see De Villiers [8]). One common reason for the popularity of the LCOE is the relatively simple nature of its computation, with its deterministic values and easily-understood formula.
LCOE is used in many different situations [9]:
• Utility resource selection;
• Dispatch decisions;
• Electricity pricing;
• Energy conservation programmes;
• Research and development (R&D) incentives;
• Subsidy determination; and
• Environmental planning.
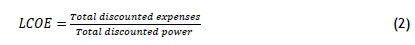
The complete calculation of the LCOE, which is also called the 'cost of generation', can include many input variables. Figure 2 shows a concise summary of all the relevant categories, including: plant characteristics, plant cost data, financial and general assumptions, fuel cost, and tax information. All of this information should be available as project information, or from various industry sources.
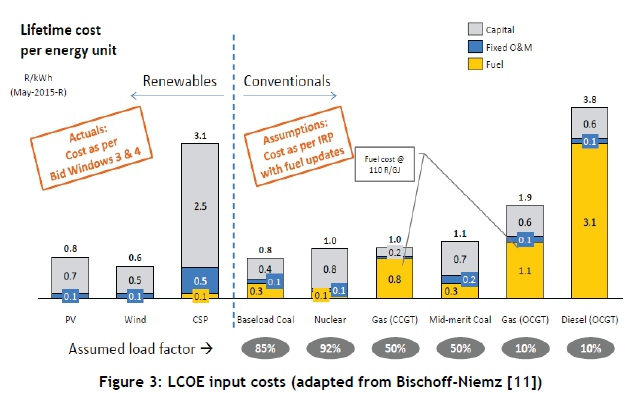
When the breakdown of the costs per generation technology is considered, it is possible to distinguish between capital, fixed operations and maintenance, and fuel costs. Figure 3 shows these values for renewable and conventional technologies [11]. Renewable technologies have virtually no fuel costs - with the exception of hybridised concentrating solar power (CSP), but high capital costs, whereas the main components of gas technologies (a conventional technology) are the fuel costs.
Understanding the three cost elements discussed here can assist in making tactical and strategic decisions. Essentially, fuel costs are monitored in the short term, whereas in the long term, all three elements are factored into the decision-making process. This is illustrated in Figure 4.
Considering the LCOE formula again, the numerator is the total discounted expense, which usually includes capital outlay (CAPEX), operations and maintenance costs (OPEX), fuel costs (for fossil- and nuclear-fuelled technologies), and decommissioning costs. In many cases, the decommissioning costs are neglected because it is assumed that the present value of these costs for long-term projects is negligible. At the end of a 50-year coal-fired plant's life, the equipment could also be sold off for scrap to counter the other costs. These costs are computed over the lifetime of the plant and are discounted to a present value:

For consistency in the formulation of the LCOE, total power must likewise be discounted. The denominator concerns the power generated over time, which needs to be computed in present value terms, since the numerator is in present value monetary format. This term is the product of the capacity factor (ratio of rated power output to the actual power generated in a year), the nameplate power of the plant, the degradation factor (which accounts for wear and tear of the plant), and the efficiency of the power plant:

The time of value of money is incorporated into the formula above. This is according to Boyle [11]:
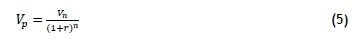
where Vp is the present value of money, and Vn is the value of money in year n. It is evident that the present value will be different from the future value, as the interest rate (or discount rate) is the discounting factor. This can be accomplished by simple mathematical manipulation of the formula. Typically, when calculating investments and returns made, the interest rate is used. However, if cash flows need to be converted into present value terms, the discount rate is used. Hence the terms 'discount rate' versus 'interest rate', where one discounts future cash flows into current monetary value, and the other determines future interest accrued on an investment. Although these terms are used interchangeably in literature and business discussions, it is important to note the different applications and inherently different direction (forward and reverse) in which the calculations are performed.
A critical financial indicator, which is an input to the LCOE calculation, is the discount rate (DR), which is used in discounting all future cash flows into present-day values, as specified above. To determine the DR, prevailing security rates (bonds, country interest rates, and so forth) are often used, or else other methods assist in calculating the DR. One such method is the capital asset pricing model (CAPM), which describes the relationship between risk and return and provides a method to price risk [12]. It says that the expected return is equivalent to the risk-free (Rf) rate of return plus some risk premium (β):

The beta (β) value can be determined in various ways, but these are too in-depth for this analysis. However, a positive beta means that the return is positively correlated with the market movement.
Another popular method is calculating the weighted average cost of capital (WACC) [12]. W represents the relative weights of different sources of debt, R the interest rates for that debt source, and T the tax rate [12]:

Essentially, tax decreases the cost of capital, as evidenced by the reducing term in the equation.
Two other ways to determine the DR are to find the opportunity cost of capital, or to set a hurdle rate that must be overcome to move ahead with a specific project [5].
2.2 LCOE variations
Despite the LCOE being a useful metric, there are a number of variations that account for certain limitations. One such variation is including the impact of inflation, which is the increase in costs of goods over time. The relationship between real (R) and nominal discount rates (r) is given by the formula below, where i is the interest rate [8]:

Taking this formula and substituting it into the LCOE metric, the following is derived:
Essentially, the above formula can be reduced to the present value of the costs over the annual electricity produced, using the applicable discount rates:

Thus it is possible to account for inflation, although this requires somewhat more intensive computation. It is therefore recommended that it be determined whether inflation is necessary for the specific case, as historical data is readily available for South African cases. At times, if projects are all thought to neglect inflation, it is possible to omit this, provided that the implications are understood.
Silinga et al. [13] argue that the LCOE metric merely focuses on the cost minimisation perspective, which is typically the viewpoint of larger state-owned utilities, such as Eskom. However, the private sector focuses on maximising profits to increase shareholder value, with cost minimisation often being a minor or secondary objective. Thus Silinga et al. [13] propose the levelised profit of energy (LPOE) metric [13], which is a minor modification to the original LCOE, and can be described by formula (11) below. The units would remain ZAR/kWh in the South African case. In this formula, the numerator now includes income and costs, which is just the profit of the electricity sold:

2.3 Aspects not covered in the LCOE metric
The LCOE does not account for the daily variation in demand and supply, which are the real value of energy. However, it uses an average of the costs and energy profiles over time [14]. A number of other aspects are not captured in typical calculations of the LCOE, such as externalities, system costs, technology types, and input data; these are discussed below.
2.3.1 Externalities
Externalities are broad, and can encompass many different costs and impacts. Roth and Lambs [9] list some externalities: "damage from air pollution, energy security, transmission and distribution costs, and other environmental impacts". Essentially, externalities are costs and benefits that do not accrue to the parties involved in the activity [15]. Other important externalities are shown in Figure 5. Especially important are the health costs as a result of pollution, which are difficult yet necessary to quantify.
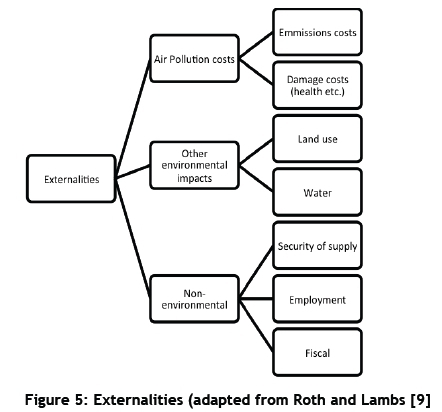
Roth and Lambs [9] determined the impact of externalities in monetary terms, and concluded that they have a significant effect on the viability of the different generating technologies. As they stated: "when externalities are considered, renewable electricity generation is comparable in cost to fossil fuel generation" [9], and externality costs associated with fossil fuel technologies are generally greater than their renewable energy technology counterparts. This said, it is impossible to account absolutely for all these costs, as the data required would be immense. However, if necessary, these should be considered.
2.3.2 System costs
From a system perspective, a technology portfolio (all power stations in the grid) is the level of analysis, not merely one type of technology (single power station). These are the types of decisions that policy-makers and business executives must make about how technologies impact on the costs of the overall system. As such, these system costs are not encapsulated in the LCOE metric.
Some commentators suggest that network costs (transmission, distribution, and marketing costs) can be as much as 40 per cent of total electricity costs [16], adding a significant burden to the network operators that must then be recovered through tariffs. These can be recovered by means of feed-in-tariffs (FITs), which assign a connection fee to generators, or by applying a network cost as part of the generation project; this will, however, increase the actual cost when compared with the standard LCOE values.
In a study conducted by the WWF [17] on the system costs of scenarios pertaining to the IRP 20102030, a system LCOE cost of ZAR 0.62/kWh was calculated. The WWF were able to look at the entire electricity network, using a spatial-temporal modelling approach that simulated the operation of the electricity system in South Africa under specific conditions [17]. One important position was the penetration of renewables in the energy mix. This was one of a limited number of studies into system LCOE.
The WWF study [17] proposed a new metric of system LCOE that includes the generation costs as before, but then introduces the integration costs [18]. However, the metric proposed by Ueckhardt et al. [18] is highly technical, in that it uses derivatives and other higher-order mathematical techniques that are not easily accessible to the general project practitioner. It will not be discussed further, as it needs to be refined before it can be applied.
2.3.3 Technology types
Dispatchable energy technologies are those that are available when required, such as fossil fuel and CSP, so that - if the network requires it - power can be generated, assuming that the capacity is available. A difficulty is encountered when comparing dispatchable and non-dispatchable (e.g., solar PV and onshore) technologies [19], as the LCOE merely accounts for average electricity produced, and does not take into account the production profiles and the market value of energy produced by the different technologies [19]. Furthermore, power (the rate at which energy is produced) and the actual energy provided are two different yet interrelated terms, and the LCOE does not differentiate between them. This is an underlying concept of physics and energy, but nevertheless, critical to understand.
One must then be attentive to understand this underlying difference between dispatchable and non-dispatchable technologies. Both are useful, but comparing a solar PV farm of 100 MW with a 100 MW pulverised fuel plant purely on a cost basis gives a skewed and incomplete representation of the actual system. Clearly, if base load were required, one would select the fossil fuel option. However, if the PV farm supply matched the demand profile, it could be considered a viable option, despite the requisite need for backup supply in the event of lost solar resources (from cloud cover and so forth). Therefore, the value of the energy produced is a significant motivating factor in selecting the type of technology that will deliver this energy.
Energy security can be supported through the uptake of renewables, as the variations in costs from fuel are minimised. However, this benefit is not included in the LCOE costs. Often, studies look at specific types of technologies (solar, wind, coal, etc.) and lump all the various different subtechnologies (parabolic troughs, concentrating solar towers, PV, wind, etc.) into one cost metric. However, there is a wide range of technologies within each technology type, and one cannot assume, unless motivated, that the costs of one technology type are the average of the underlying subtechnologies. In the LCOE calculation efforts, the way to address this issue is to provide ranges of costs for different technology types, which then account for the underlying differences. This difference in the energy delivered can be adapted in the tariff employed. Silinga et al. [13] described how tariff changes impact on the profitability of different technologies.
2.3.4 Input data
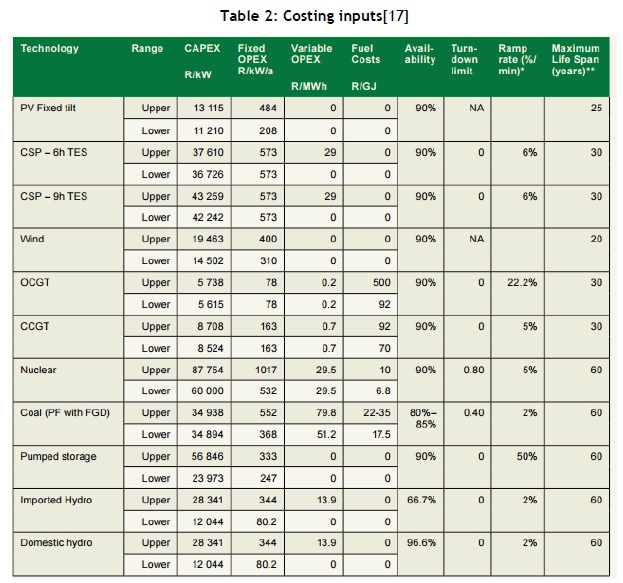
The LCOE is only as accurate as the input data that is used in the electricity project evaluation model. However, the inputs are usually deterministic in nature, representing a single figure. Table 2 shows the ranges for different input costs used in system LCOE calculations [17]; as discussed above in Section 2.3.2, these could be converted into distributions of a stochastic nature to produce more representative LCOE calculations. Essentially, probabilistic costing, using methods such as Monte Carlo simulation, could prove useful.
At higher penetration rates, renewable energy has a lower market value, and accomplishing the rollout of these will be a challenge [21]. Thus energy economics also has a role to play in determining how the market prices energy, and this needs to be accounted for in systems analysis, as it affects project viability.
3 CONCLUSION
It is a matter of perspective when determining what the relevant inclusive and exclusive costs are in determining the LCOE. Since the project owner cannot bear the burden of all the costs, but will instead be liable for the critical costs of the project, it is up to the role-players to decide on the relevant costs, even if the project owner does not directly experience these.
This paper has analysed the standard LCOE metric, which is widely-accepted and used across electricity projects worldwide. This paper has also discussed some variations of the LCOE metric - for example, to include inflation and the levelised profit of energy.
Lastly, the limitations of the LCOE, and what is excluded from it, were discussed, including the externalities of a project that pertain not only to the project, but also to system costs, technology costs, and other costs. System costs are important, as many projects have an impact on the greater system and electricity grid, and thus need to be considered in greater detail.
The LCOE is a robust metric that helps with technology selection and decision support for electricity projects and expanding electricity portfolios. However, as discussed, the LCOE metric's limitations must be highlighted, understood, and taken into account when using it, so that accurate analysis and due diligence are performed when making decisions that have widespread economic, social, and environmental impacts in the long run. It is the authors' view that this metric will continue to be used, as it is relatively simple and is the most accessible metric for this type of project evaluation. However, it must not be used in isolation, but in conjunction with other project metrics and methodologies.
4 RECOMMENDATIONS
Since the LCOE fails to account for system costs and other non-project costs, an investigation should be undertaken to understand, model, and predict these other costs for an electricity network. This would assist policy-makers and network planners in decision-making with new projects, especially renewable energy ones, and the subsequent costs to the network operator. This is especially important given the recently revised IRP that has been published for consultation with stakeholders.
REFERENCES
[1] Department of Energy. 2013. Integrated Resource Plan for Electricity (IRP) 2010-2030. South Africa: Department of Energy. [ Links ]
[2] Walwyn, D.R. and Brent, A.C. 2015. Renewable energy gathers steam in South Africa. Renewable and Sustainable Energy Reviews, 41, pp. 390-401. [ Links ]
[3] Department of Energy. 2015. BW Four Announcement. Pretoria, South Africa: Department of energy. [ Links ]
[4] Masters, G.M. 2004. Renewable and efficient electric power systems. John Wiley & Sons Inc. [ Links ]
[5] Tinsley, R. 2000. Project finance: Project finance risks, structures and financeability. 2nd edition, London: Euromoney-DC Gardner Workbooks. [ Links ]
[6] Namovicz, C. 2013. Assessing the economic value of new utility-scale renewable generation projects. EIA Energy Conference. [ Links ]
[7] International Energy Agency and the Nuclear Energy Agency. 2015. Projected costs of generating electricity. Organization for Economic Co-operation and Development/IEA, Paris. [ Links ]
[8] Roth, I.F. and Lambs, L.L. 2004. Incorporating externalities into a full cost approach to electric power generation life-cycle costing. Energy, 29, pp. 2125-2144. [ Links ]
[9] California Energy Commision. 2014. Estimated cost of new renewable and fossil generation in California. CEC-200-2014-003-SD, available at: http://www.energy.ca.gov/2014publications/CEC-200-2014-003/CEC-200-2014-003-SD.pdf [ Links ]
[10] Bischof-Niemz, D.T. 2015. Role of solar PV in the power system. Renewable Energy Finance Lecture, August, South Africa: Stellenbosch University. [ Links ]
[11] Boyle, G. 2012. Renewable energy: Power for a sustainable future. 3rd edition, Oxford: Oxford University Press. [ Links ]
[12] Volchenk, J. 2013. Renewable energy finance. Masters in Engineering course notes. Stellenbosch, South Africa: Stellenbosch University. [ Links ]
[13] Silinga, C., Gauche, P., Rudman, J. and Cebecauer, T. 2015. The South African REIPPP two-tier CSP tariff: Implications for a proposed hybrid CSP peaking system. Energy Procedia, 69, pp. 1431-1440. [ Links ]
[14] Kost, C., Mayer, J.N., Thomsen, J., Hartman, N., Senkpiel, C., Philipps, S., Nold, S., Lude, S., Saad, N. and Schlegl, T. 2013. Levelized cost of electricity renewable energies. Paper, Germany: Fraunhofer Institute for Solar Energy Systems ISE. [ Links ]
[15] Carlin, J. 2002. Environmental externalities in electric power markets: Acid rain, urban ozone, and climate change. Report, Environmental Information Agency, USA, available from: www.eia.doe.gov. [ Links ]
[16] International Energy Agency and the OECD Nuclear Energy Agency. 2010. Projected costs of generating electricity: 2010 edition. Organisation for Economic Co-operation and Development/International Energy Agency, Paris, France, report available at: https://www.iea.org/publications/freepublications/publication/projected_costs.pdf [ Links ]
[17] WWF. 2015. Feasibility of the WWF renewable energy vision 2030 - South Africa. Report available from: http://www.wwf.org.za/media_room/publications/?uNewsID=14461. [ Links ]
[18] Ueckerdt, F., Hirth, L., Luderer, G. and Edenhofer, O. 2013. System LCOE: What are the costs of variable renewables? Energy, 63, pp. 61-75. [ Links ]
[19] Milligan, M.R. and Kirby, B. 2009. Calculating wind integration costs: Separating wind energy value from integration cost impacts. Colorado: National Renewable Energy Laboratory. [ Links ]
[20] Larsson, S. 2012. Reviewing electricity generation cost assessments. Masters Thesis, Uppsala University, Sweden. [ Links ]
[21] Hirth, L. 2013. The market value of variable renewables: The effect of solar wind power variability on their relative price. Energy Economics, 38, pp. 218-236. [ Links ]
[22] De Villiers, P.J.D. 2014. Three comments on the levelized cost of energy (LCOE) calculations. Research Paper, South Africa: University of Stellenbosch. [ Links ]
Submitted by authors 10 Feb 2016
Accepted for publication 31 Aug 2016
Available online 6 Dec 2016
* imkedk@sun.ac.za
1 SAPP: http://www.sapp.co.zw/members.html
2 http://www.ipprenewables.co.za/

