


Services on Demand
Article
 English (pdf)
 Article in xml format
 Article references
Indicators

Related links
-
 Cited by Google
 -
 Similars in Google
Share

 Permalink
South African Journal of Industrial Engineering
On-line version ISSN 2224-7890
Print version ISSN 1012-277X
S. Afr. J. Ind. Eng. vol.27 n.3 Pretoria Nov. 2016
http://dx.doi.org/10.7166/27-3-1633
CASES STUDIES
Two green bottles, standing on a wall: an environmental assessment of two bottle types
I.G. Ivanov; D. Hartmann*
School of Mechanical, Industrial and Aeronautical Engineering, University of the Witwatersrand, South Africa
ABSTRACT
Non-renewable resources are becoming scarce and current Global Warming Potential values are rising. In an effort to promote a successful shift towards a 'greener' planet, governments worldwide are developing policies (such as carbon taxation) to encourage businesses to contribute to the effort. This study analysed the product carbon footprint of the packaging process for 300 ml glass and 500 ml PET containers for a South African soft drink manufacturing business. A review of the academic literature revealed that no similar research had been conducted in South Africa. The Greenhouse Gas protocol was used as the basis for the research method. It was found that the 500 ml PET packaging process draws 100 per cent of its cumulative energy demand from purchased electricity (generated by burning coal); therefore, 500 ml PET containers have 4.5 times less global warming potential per hectolitre than 300 ml glass containers, which have 71 per cent of their emissions resulting directly from coal-fired boilers on site. A dynamic model analysis revealed that packaging in larger containers results in a significant reduction in global warming potential per volume for both glass and PET containers.
OPSOMMING
Nie-hernubare hulpbronne verminder en die huidige globale verhittingspotensiaal styg. In 'n poging om 'n suksesvolle oorgang tot n 'groener' planeet te bewerkstellig, ontwikkel regerings wêreldwyd beleide (soos koolstofbelasting) wat besighede aanmoedig om daartoe by te dra. Hierdie studie analiseer die koolstofvoetspoor van die verpakkingsproses van 300ml glas en 500ml PET houers vir 'n Suid-Afrikaanse koeldrankvervaardiger. 'n Literaturstudie het geen soortgelyke navorsing in Suid-Afrika vorendag gebring nie. Die kweekhuisgas protokol is gebruik as die grondslag vir die navorsingsmetode. Daar is gevind dat die totale energie wat deur die 500ml PET† verpakkingsproses gebruik word van aangekoopte elektrisiteit afkomstig is. Die 500ml PET houers het dus 4.5-maal minder globale verhittingspotensiaal as die 300ml glas houers per hektoliter, waarvan 71 persent van hul uitlaatgasse as gevolg van steenkoolaangedrewe ketels op die perseel is. n Sensitiwiteits-analise toon dat die verpakking in groter houers tot n noemenswaardige vermindering in globale verhittingspotensiaal per volume lei vir beide glas en PET houers.
1 INTRODUCTION
Due to the rapid rate of non-renewable resource depletion and ever-increasing greenhouse gas emissions, opportunities for reducing the carbon footprint are of interest internationally. Industrial processes use electricity that emits carbon dioxide (CO2) due to the combustion of fossil fuels, which contributes to global warming.
To encourage businesses to be more environmentally conscious, South Africa is considering the introduction of carbon taxes for all major sectors of the economy. The energy-intensive processes in manufacturing make this sector a major contributor to greenhouse gas (GHG) emissions. Therefore, this sector needs carbon tax projections and mitigative strategies.
Given this context, there will be a need for the selected carbonated soft drink (CSD) manufacturing business to better understand the global warming impact its core operations have on the environment, and therefore its potential carbon tax cost. This will help the relevant stakeholders to develop appropriate carbon emissions reduction strategies. This study will quantify the environmental impact (product carbon footprint) of the packaging process of returnable glass and polyethylene tetraphthalate (PET) containers in a typical CSD manufacturing business in Gauteng, South Africa. This analysis will investigate the cumulative energy demand (CED) and its links to carbon footprint impacts in terms of global warming potential (GWP) during the packaging process of the two types of containers. The manufacturing business could use the results of the study to understand how the use of PET and glass in its packaging process contributes to prospective carbon taxation. The study will also provide the business with an understanding of how the use of glass and PET on its packaging lines affects the country's carbon emissions through fossil fuels burnt to generate electricity. By understanding the aforementioned implications, the manufacturing business will be able to make strategic decisions about the choice of packaging containers used in its packaging process.
2 LITERATURE REVIEW
The purpose of this section is to identify gaps in the existing literature with respect to determining the product carbon footprint (PCF) of the CSD packaging process for glass and PET for a South African business. These gaps were used to develop the problem statement and objectives for this research. From all the studies that relate to conducting a life cycle analysis (LCA) on different beverage packaging options [1], few [2, 3] directly investigate the carbon footprint of packaging CSDs in glass and PET containers alone. As far as the research for this project has gone, no evidence has been found for work done on the carbon footprint of the CSD packaging process for PET and glass containers in South Africa. Therefore, any work conducted in this study is the first of its kind.
Different LCA studies have different results for the contribution impact for each life cycle stage for glass and PET. Some studies suggest that the packaging process life stage is insignificant compared to the total environmental cost of the products [4], while others identify the life stage as having the most significant environmental impact [1]. No conclusive evidence was found in favour of either of the two materials. Hence, a targeted case study that will provide a repeatable method for quantification of PCF for the soft drinks manufacturer under investigation will be beneficial in closing this gap in the literature. In addition, such a case study can provide the business under investigation with valuable information about its products, which stakeholders can use in preparation for the proposed carbon tax legislation in South Africa.
Furthermore, there is no conclusive evidence to support the packaging process dominance, in terms of GHGs emissions, of glass over PET. Therefore, this creates the need for this study that the manufacturing business could use to determine how its operations impact on its potential future carbon tax.
Most studies that have looked at similar work [1, 3, 5-7] used a dataset by Ecoinvent [8], which is a theoretical database. Similarly, most LCA studies [1, 4, 6] also used existing datasets because full investigations are deemed to be too time- and resource-intensive. In order to address the gap in empirical data to inform LCA studies, this study will use actual business data and not a theoretical database. Although a South African study [9] assessed the LCA of various packaging materials in terms of their recycling footprint, it neglected to consider the energy consumed in the filling process.
Based on the above arguments, this study attempts to address the following literature gaps: • No research has been done on the PCF for CSD in a South African plant.
• There is no clear conclusion on which of the packaging materials has the lowest environmental impact.
• Since studies on the packaging process of glass and PET use theoretical data from databases, there is uncertainty about the extent to which these conclusions apply to reality.
• The literature mostly focuses on the production and recycling of PET and glass, and does not offer insight into how their use affects the consumption of non-renewable resources.
3 RESEARCH PROBLEM STATEMENT AND OBJECTIVES
This study aims to quantify the environmental impact on the GWP for the CSD packaging process of returnable glass and PET containers for a South African business in Gauteng, in light of the potential new carbon tax legislation. Hence, this study aims to determine which type of packaging process has a lower carbon footprint.
The research objectives are as follows:
• Quantify the energy requirement of all unit processes, main utilities (e.g., bought electricity and boiler-coal), and raw materials required for the packaging process of a PET container and a glass container on a CSD packaging line.
• Assess the energy consumption in terms of CED.
• Determine the breakdown of CED in terms of direct and indirect energy sources.
• Quantify the GHGs in terms of weight of CO2 emitted as a result of the packaging process, main utilities, and raw packaging materials for glass and PET. This will help to determine which type of packaging process is associated with a lower overall GWP, and so result in lower carbon taxation for the business.
4 SCOPE OF THE STUDY AND METHODOLOGY
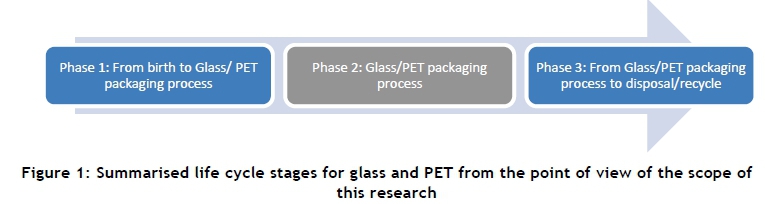
For the purposes of this study, only the area highlighted in grey in Figure 1 is studied - i.e., the CSD packaging process in PET/glass containers.
Phase 1: From birth to glass/PET packaging process
This phase is beyond the scope of this research, and has been explored relatively frequently [10]. It consists of all processes related to acquiring the raw materials, their manufacture, and all necessary transportation and storage of PET and glass containers, to get them to their respective CSD packaging line [11].
Phase 3: From glass/PET CSD packaging process to disposal/recycle
This phase is beyond the scope for this research. It consists of all the processes related to storage and transportation of the packaged CSD glass and PET containers, from the time they leave their respective packaging line to the time of their disposal/recycle.
Phase 2: Glass/PET CSD packaging process
This is the life cycle stage considered in this research. The PCF of glass and PET is for this stage only. It deals with the packaging process of CSD in PET and glass containers. The starting point is when empty glass and PET containers enter their respective packaging lines, and it ends when these containers are filled, sealed, stacked on a pallet, and ready to leave their respective packaging lines.
Method
This study was conducted as a single case study, which was justified because the site selected was characteristic of many similar companies within the CSD industry in South Africa. Mixed methods were used: qualitative methods to clarify contextual questions, and quantitative assessment of production data to establish PCFs. A framework was adopted from the literature to identify and assess the level of CED and the relationship between CED and GHG levels.
The selected site was process-mapped, and all significant packaging materials, machines, material flows, and energy consumptions were audited. A model was constructed to assess the carbon consumption of the various processes, and the the data was validated from discussions with key business personnel with expert opinions.
5 RESULTS AND DISCUSSION
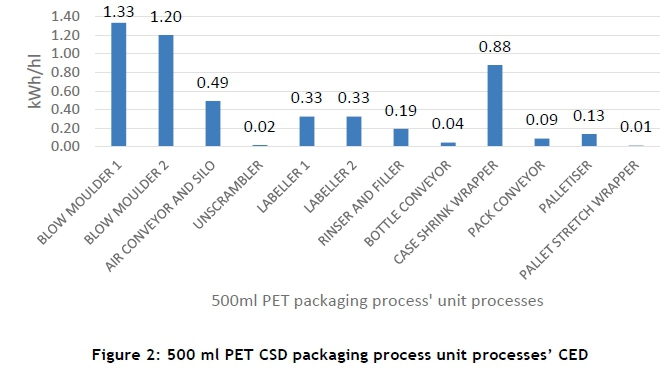
The CED in terms of kWh/hl for the 500ml PET CSD packaging process's unit processes is shown in Figure 2.
The total CED for the 500 ml PET CSD packaging process as a result of unit processes alone is calculated to be 5.04 kWh/hl. Purchased electricity is used as an energy supply for all the unit processes on the PET CSD packaging line. The blow moulders consume the most power, using 1.33 kWh/hl and 1.2 kWh/hl respectively; this amounts to 50 per cent of the CED. The case-shrink wrapper, which consumes 0.88 kWh/hl, amounts to 18 per cent of the CED. Together, the blow moulders and the case-shrink wrapper contribute 68 per cent of the CED for the 500 ml PET CSD packaging process. Therefore, business efforts to reduce the energy consumption in these unit processes would be significant for bringing the CED down. These machines require considerable energy to generate the heat used in production. The speed of the case-shrink wrapper (48,960 bph) is 22 per cent higher than the bottleneck's speed (40,000 bph). During the research, it was observed that the case-shrink wrapper is often left operating at full capacity. The faster the case-shrink wrapper runs, the faster it needs to heat the plastic shrink wrap over the bottles, and so it requires more power. Therefore, conducting a further study that focuses on determining the optimum case-shrink wrapper operating speed might result in energy reductions.
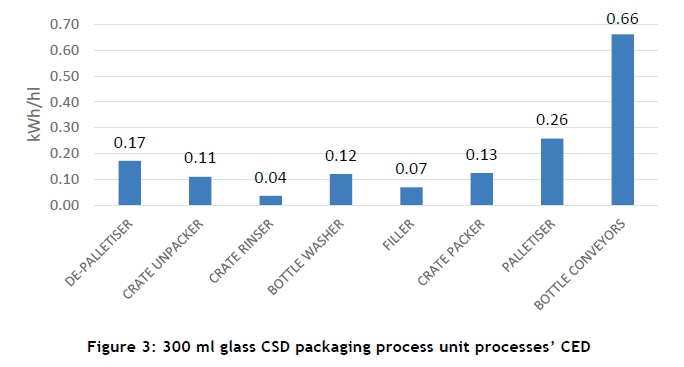
The energy breakdown for the 300 ml CSD glass packaging process's unit processes is shown in Figure 3.
The total CED for the 300 ml glass CSD packaging process as a result of unit processes alone is calculated to be 1.56 kWh/hl. Purchased electricity is used as an energy supply for all the unit processes on the glass CSD packaging line. At 0.66 kWh/hl, the bottle conveyors consume the most energy - 42 per cent of the CED. The bottle conveyors, which transport the glass bottles from one unit process to another, are powered by electric motors. Replacing existing electric motors with more efficient equivalents would have the biggest impact in reducing CED.
Figure 4 shows the GWP for the 500 ml PET and 300 ml glass CSD packaging processes' unit processes, as a result of purchased electricity.
The GWP for the 500 ml PET CSD packaging process's unit processes is calculated as 5,000 gCO2e/hl, and the GWP for the 300 ml glass CSD packaging process's unit processes is calculated as 2,000 gCO2e/hl. Packaging CSD in PET therefore results in 2.5 times more CO2e emissions than packaging it in glass. It can be noted that the higher the kWh/hl, the higher the kgCO2e/hl will be. It is important to highlight that the aforementioned emissions will not contribute directly to the business's carbon tax because those emissions are incurred by the upstream purchased electricity supplier. Thus it is important, from a cost point of view, for the business to work on optimising its energy use and to look for alternative sources of energy other than purchased electricity.
The GWP in terms of gCO2e/hl for the 500 ml PET CSD main packaging raw materials is shown in Figure 5.
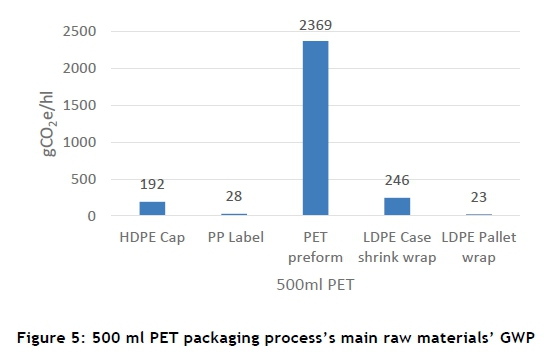
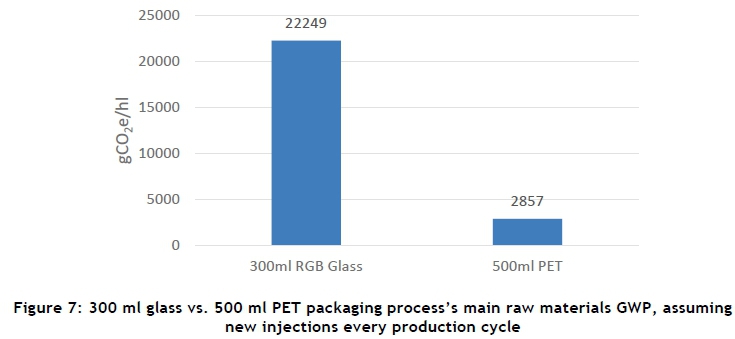
The total GWP for the 500 ml PET CSD packaging process's main raw materials, which is calculated using published data [12], has a value of 2,858 gCO2e/hl. The 500 ml PET preform has the highest GWP of 2,369 gCO2e/hl. Reducing the weight of the 500ml PET preform will have the greatest effect on the GWP of the packaging process of CSD in PET containers. Although GWP due to material manufacture will not affect the company's carbon tax directly, it will have indirect cost implications, similar to those of purchased electricity. PET preform suppliers will incur this taxation instead, and in turn will raise their prices to remain profitable. This will result in higher material costs to the business, and so negatively impact its profit margin. Poor PET recycling in South Africa may require that new raw materials are always used for the manufacture of PET preforms, which will further increase the upstream supplier's GWP. The chemical composition of PET inherently requires environmentally costly materials [12], which could be replaced by greener options with technological advances and new scientific research. It is therefore important that the business, together with suppliers, continuously looks for opportunities to reduce PET preform weight, material composition, and/or the rate at which material is recycled and fed back into the system.
The GWP in terms of gCO2e/hl for the 300 ml glass CSD main packaging raw materials is shown in Figure 6.
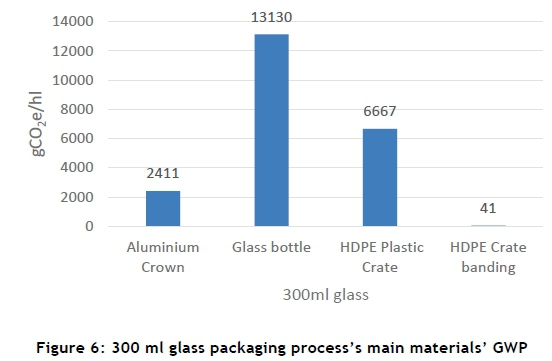
The total GWP for the 300 ml glass CSD packaging process's main raw materials, which is calculated using published data [12], has a value of 22,249 gCO2e/hl. The 300 ml glass bottle has the highest GWP of 13,130 gCO2e/hl. The HDPE plastic crate has the second-highest GWP of 6,667 gCO2e/hl. Reducing the weight and changing the material composition of the 300 ml glass bottle and HDPE plastic crate will have the greatest effect on the GWP of the packaging process of CSD in glass containers. Similarly to the PET preform discussion, the 300 ml glass bottle and HDPE plastic crate GWPs are expected to have a negative indirect effect on the business's profit margin whenever a new batch of these materials is introduced into the system. According to information supplied by the business under investigation, the return rate of 300 ml glass bottles and HDPE plastic crates is currently within target levels (20 cycles). Therefore, the indirect effect on the business's profit margin will be very small in comparison with the 500 ml PET counterpart, as discussed in the earlier paragraphs. Nonetheless, investigation into lighter, better-composed, and environmentally-friendlier glass bottles and plastic crates should be conducted between the business and its upstream suppliers.
The GWP comparison between the 300 ml glass and 500 ml PET CSD packaging process's main raw materials is shown below. Figure 7 shows the gCO2e/hl for glass vs PET, assuming that new raw material injections are required every time.
Figure 8 shows the overall CED for the glass and PET CSD packaging process, which includes the unit processes and utilities, but excludes the main packaging raw materials because they are produced offsite and the CED associated with their manufacture is beyond the scope of this research.
The CED for the 300 ml glass CSD packaging process is 216.56 kWh/hl and the one for the 500 ml PET is 7.64 kWh/hl. The 300 ml glass packaging process requires 28 times more kWh/hl than the 500 ml PET. This is a significant difference between the two processes. Furthermore, the utilities' CED for 300 ml glass contributes 99 per cent of the total glass CED, while the utilities for 500 ml PET contribute 34 per cent of the total PET CED.
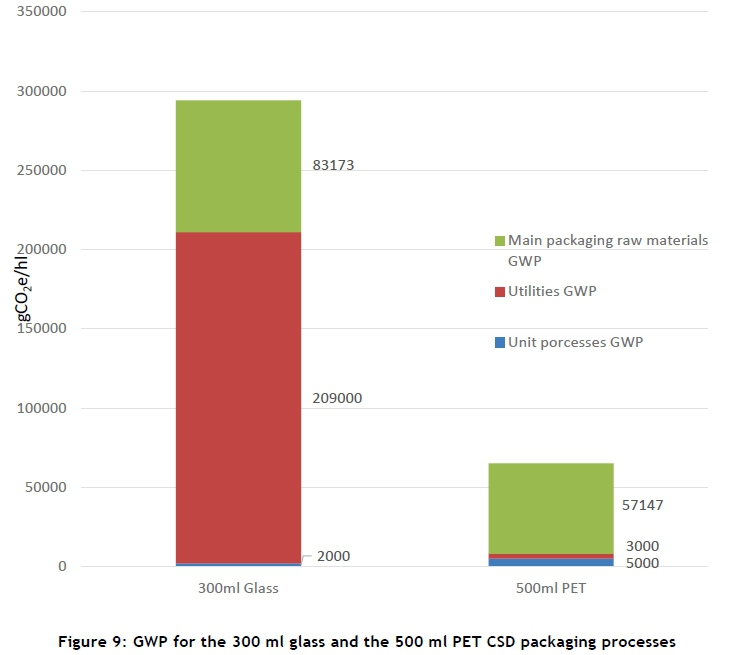
Figure 9 shows the GWP for the glass and PET CSD packaging processes, which include main packaging raw materials. It is important to note that both direct and indirect emissions are included.
Although many GHGs are expelled in combustion, these are expressed as gCO2e [13]. The overall GWP for the 300 ml glass CSD packaging process is 294,173 gCO2e/hl, and the GWP for 500 ml PET is 65,147 gCO2e/hl; this is 4.5 times less than glass. The utilities and main packaging raw materials for 300 ml glass form 71 per cent and 28 per cent respectively of the total GWP for this packaging type of container. The utilities and main packaging raw materials for 500 ml PET form 5 per cent and 88 per cent respectively of the total GWP for this type of packaging container. The main focus areas for the business, should it decide to keep both types of packaging operations, would be on the raw materials and utilities used for glass and for PET, because reduction in these areas will yield the most improvement in working with a greener product.
The 300 ml glass utilities are the only direct contributors to business carbon tax. Packaging raw materials and unit processes for 300 ml glass and 500ml PET both indirectly affect the cost of business supplies (purchased electricity and raw materials) due to carbon tax increase in upstream organisations. The direct GHG emissions by the business from the 300 ml glass CSD packaging process are 71 per cent, and the remaining 29 per cent has indirect GHG emissions. The direct GHG emissions for the 500 ml PET CSD packaging process are 0 per cent, with all the indirect GHG emissions resulting from purchased electricity and the manufacture of packaging raw materials. It is worth pointing out that the direct GHG emissions of the boiler alone generate 3.2 times the GHG of the whole of the 500 ml PET CSD packaging process. Thus using 500 ml PET will result in lower carbon tax.
It can be concluded that 500 ml PET is the better packaging option from the perspective of the CSD packaging process because it has both lower CED and GWP. Therefore, the business should consider replacing all of the glass packaging lines with PET equivalents. Before this is done, however, the scope of the PCF study conducted by this research needs to be expanded to cover the cradle-to-grave life cycle of glass and PET containers for the business.
A dynamic model analysis was performed for two main reasons. One was to show that the MS Excel model can be applied across all of the business's packaging lines, while the second was to assess the impact of using larger glass and PET containers for the CSD packaging process.
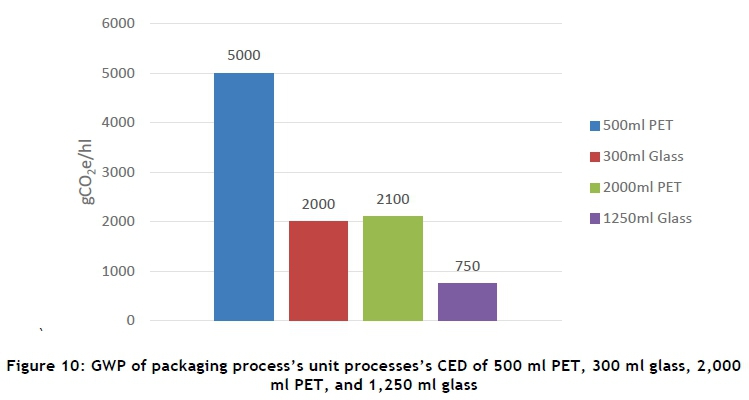
Figure 10 shows the 300 ml glass, 500 ml PET, 1,250 ml glass, and 2,000 ml PET unit processes's GWP.
500 ml PET unit processes's GWP (5,000 gCO2e/hl) is the highest across all four types of containers selected for comparison, and is 2.4 times that of its 2,000 ml PET equivalent (2,100 gCO2e/hl). The GWP for 1,250 ml glass has the lowest value (750 gCO2e/hl). However, as discussed earlier when the CED for the four types of containers was compared, this value will be offset when including the emissions from the main utilities (e.g., coal boilers). It is worth pointing out that, because the 300 ml and 1,250 ml glass packaging lines both make use of the same bottle washer, which is the most GWP-intensive machinery on the glass line, producing CSD in larger containers is expected to have a significant reduction in direct CO2e by the business. However, when considering the 300 ml glass and 500 ml PET overall GWP comparison, even halving this contribution will not favour the overall glass packaging process's GWP. The GWP for the 2,000 ml PET comes out as the best choice for the business, assuming that the raw material and utilities' indirect emissions are similar to those of 500 ml PET because it indirectly emits half the gCO2e/hl when compared to its 500 ml PET equivalent; hence, it would add the least indirect carbon tax cost to the organisation. The benefit becomes clearer when these seemingly low values, which are expressed per functional unit (hl), are factored into the annual sales of the business.
The results of the study are expressed per functional unit (hl) of CSD. Although the GWP for the glass and PET CSD packaging processes seems to consume little power and shows a low GWP per hl value, the effects change quite drastically when the business's sales are factored in. As an example, a 1,000,000 hl/year business will result in 294,173 tonnes of CO2e per annum during its glass operation, and 65,147 tonnes of CO2e per annum from its PET operation for the 300 ml and 500 ml packaging containers alone. If other CSD stock keeping units (SKUs) were factored in, the emissions would be even higher. More accurate results can be achieved if the research model is applied across the business's SKU portfolio. This will give the organisation a complete representation of its CSD packaging processes's CED and GWP, and hence enable stakeholders to better anticipate direct and indirect carbon tax costs.
Due to unit processes, the 300 ml glass CSD packaging process has half the environmental cost of its 500 ml PET equivalent. The greatest environmental cost for both processes lies with the main utilities and packaging materials (99 per cent for glass and 93 per cent for PET). Focusing on eliminating or reducing these values will therefore add the most value to the business. Based on direct carbon tax impact, the glass packaging process contributes the most to the business's direct carbon tax. Should the business decide to keep its glass packaging lines - for example, due to market demand - its most important focus must be on reducing the onsite coal boilers' emissions. Alternative energy sources should be considered first, as well as improving the efficiency of the operation by investing in a new bottle washer and/or a better steam recovery system.
If the business does not make use of glass bottles, and instead considers non-returnable (NRB) glass containers, the need for the energy- and environmentally-expensive bottle washer/sterilisation operation would fall away. This would take carbon tax implications away from the direct cost of the business, and shift the burden to the upstream NRB glass supplier instead. If this were the case, the GWP for the glass process would be around 86,000 gCO2e/hl, assuming that returnable glass bottles (RGB) and NRB glass have a very similar GWP potential during their manufacturing stages. In this case, the PET CSD packaging process would still have a lower GWP value of 65,147 gCO2e/hl, but the difference would not be 4.5 times, as is currently the case with the use of 300 ml RGBs. Hence, conducting a study that investigates the use of NRB glass as opposed to RGBs, would add value to the business's stakeholders.
Since 88 per cent of the 500 ml PET CSD packaging process's indirect GWP lies in the use of PET as the main raw material, the organisation will gain the most benefit in indirect cost reduction by focusing on this area first. The use of non-PET containers only for the CSD packaging process, which are made out of natural, very low carbon footprint materials, is estimated to reduce the indirect GWP of the CSD packaging process by up to 47,000 gCO2e/hl when compared with its 300 ml glass equivalent. This will make the choice of such PET alternatives a must for the organisation. Focused efforts on recycling PET containers and research into replacing current PET preform composition with environmentally 'clean' materials would have a great effect on the business. Its corporate governance would benefit because it would be seen as a 'green' company by the public. Also, jobs would probably be created through resource demand for recycling and research into raw material alternatives. This may also result in the government subsidising the company for its efforts and economic contributions, thus lowering its carbon tax.
The organisation's reliance on using purchased electricity for its CSD packaging process is another area around which stakeholders need to strategise. The use of alternative energy sources is likely to reduce the GWP of the process. However, given South Africa's dependence on fossil-fuel-generated power, this would be a very challenging issue to resolve. Nevertheless, the business could attempt, via co-operation with suppliers and other industries, to influence the government to move away from non-renewable resources for energy generation as part of a long-term programme.
There seems to be a somewhat directly proportional relationship between the kWh/hl and the gCO2e/hl when using the GHG calculation tool provided by the World Resource Institute [13]. The tool shows that, when burning coal, only CO2 is emitted as GHG. Since the tool is from an internationally-credible source, its output would be taken as accurate. Further supplier-specific research would be required to better understand upstream GWP.
From the dynamic model analysis conducted, packaging in larger containers results in lower overall GWP values through economies of scale. Also, the overall GWP results would still be in favour of PET, even if the PET and glass containers are of identical volumetric capacity, because of the large GWP contribution of the utilities and main raw materials required for glass.
The business has the option of considering alternative packaging materials for its CSD packaging process. However, because the capital investment is in PET and glass packaging lines only, such an investigation would be futile. For example, if further research concluded that an aluminium container were the 'greenest' choice, replacing all of the existing infrastructure to accommodate this type of container would not make business sense in view of the high conversion cost and rate of return on investment.
The same conclusion could be made when comparing the results of this research to the results obtained by Flanigan et al. [6]. The choice of packaging container when considering GWP largely depends on the raw materials chosen for its construction. For this research, raw materials' GWP for both glass and PET containers form a significant part of the finished products' overall GWP. As found in the literature review section of this paper, comparing the results of this research to other academic literature would not be fruitful because numerous assumptions are made for each study that are not always disclosed in the publically-available reports. So further comments about the similarities and differences in findings cannot be made at this stage.
6 CONCLUSIONS
Based on the results and discussion of this study, the 500 ml PET packaging process's unit processes were found to consume 5.04 kWh/hl, while its utilities consumed 2.6 kWh/hl. The 300 ml glass packaging process's unit processes were found to consume 1.56 kWh/hl, while their utilities consumed 2.15 kWh/hl. The CED for the 300 ml glass packaging process, which includes main utilities and unit processes, was found to be 216.56 kWh/hl, which is 28 times that of the 500 ml PET (7.64 kWh/hl). Thus the 500 ml PET consumes the least amount of CED. Since both the 500 ml PET and the 300 ml glass packaging process's main raw materials are produced offsite, the CED associated with their manufacture was beyond the scope of this study and so was not quantified.
For 500 ml PET, 100 per cent of the energy required for the CSD packaging process's unit processes and main utilities come from purchased electricity, which is obtained from the national grid. This electricity is generated according to the mix of generating means in South Africa. This contrasts with the 300 ml glass, for which 99 per cent of the CED was found to be drawn by coal boilers onsite, and the remaining 1 per cent from the national grid.
The GHGs associated with the CSD packaging process CED requirements all come from burning coal to generate power. The only GHG associated with burning coal in South Africa is CO2 [13]. The GWP for the 500ml PET CSD packaging process's unit processes, main utilities, and raw materials was found to be 65,147 gCO2e/hl, which is 4.5 times less than that for the 300 ml glass (294,173 gCO2e/hl).
The business's direct GHG emissions from the 300 ml glass CSD packaging process are 71 per cent, and the remaining 29 per cent has indirect (offsite) GHG emissions. The direct GHG emissions for the 500ml PET CSD packaging process are 0 per cent, with all the indirect emissions resulting from purchased electricity and the manufacture of packaging raw materials. The 500 ml PET CSD packaging process was thus found to result in lower carbon taxation to the business.
Using larger PET (2,000 ml) and glass (1,250 ml) containers was found to reduce the GHG emissions for the CSD packaging process. Using a 2,000 ml PET container for the CSD packaging process was found to be the best choice for the business.
7 RECOMMENDATIONS
Based on the discussion of the results and conclusions for the study, the following recommendations are offered:
1. The business should focus on understanding the implications of changing container size in the light of possible market constraints and how this change would impact the business' profitability. This would provide an insight into the true impact that carbon tax would have on the business' profit. If possible, marketing efforts should focus on driving sales in larger PET containers because those are expected to result in the lowest amount of carbon taxation for the business, as well the lowest increase in upstream suppliers' cost when compared with glass alternatives.
2. The business should focus on working with suppliers on projects using alternative and green material that will replace the PET preform. Concurrently, the organisation needs to get more involved in PET recycling projects, which are expected to affect corporate governance positively and result in potential government subsidies.
Recommendations for further academic research that would build on the current study are as follows:
1. Due to site-specific unit processes and utilities' setups and connections, the results from this study will not be directly applicable to another CSD manufacturing site. Therefore, the study must be repeated across the whole business SKUs portfolio and all of its packaging lines across all of its sites in South Africa to quantify fully the CSD packaging process's PCF.
2. Expand the scope of the study to include all life stages for the glass and PET CSD packaging process, and so develop a full LCA.
NOMENCLATURE
BPH Bottles per hour
CED Cumulative energy demand
CSD Carbonated soft drink
gCO2e/hl Grams of carbon dioxide emitted per hectolitre (equivalent)
GHG Greenhouse gas
GWP Global warming potential
HDPE High density poly ethylene
kWh/hl Kilowatt hours required per hectolitre
LCA Life cycle analysis
NRB Non-returnable bottle
PCF Product carbon footprint
PET Polyethylene tetraphthalate
REFERENCES
[1] Pasqualino, J., Meneses, M. and Castells, F. 2011. The carbon footprint and energy consumption of beverage packaging selection and disposal. Journal of Food Engineering, 4(103), pp. 357-365. [ Links ]
[2] The Coca Cola Corporation, 2010. What's the carbon footprint of Coca-Cola? [ Links ]
[3] Doublet, G., 2012. LCA of Rivella and Michel soft drinks packaging. Zürich: Institute of Environmental Engineering (IFU) at ETH Zürich. [ Links ]
[4] Amienyo, D. et al. 2013. Life cycle environmental impacts of carbonated soft drinks. The International Journal of Life Cycle Assessment, 18(1), pp. 77-92. [ Links ]
[5] Franklin Associates, 2009. Life cycle inventory of three single-serving soft drink containers. [ Links ]
[6] Flanigan, L., Frischknecht, R. and Montalbo, T. 2013. An analysis of life cycle assessment in packaging for food & beverage applications. UNEP. [ Links ]
[7] Ganji, A.R., Hackett, B. and Chow. S. 2002. Energy conservation opportunities in carbonated soft drink canning/bottling facilities. Texas: BASE Energy Inc. [ Links ]
[8] Ecoinvent, 2015. Retrieved from www.ecoinvent.org. [ Links ]
[9] Nahman, A. 2010. Extended producer responsibility for packaging waste in South Africa: Current approaches and lessons learned. Resources, Conservation and Recycling, 54(3), pp. 155-162. [ Links ]
[10] Vellini, M. and Savioli, M. 2009. Energy and environmental analysis of glass container production and recycling. Energy, 34(12), pp. 2137-2143. [ Links ]
[11] Gleick, P.H. and Cooley, H.S. 2009. Energy implications of bottled water. Environmental Research Letters, 4(1), pp. 014009. [ Links ]
[12] Environmental Protection Agency of the United States of America. 2015. SWMGH Greport. [ Links ]
[13] World Resource Institute. 2013. The Greenhouse gas protocol: A corporate accounting and reporting standard. [ Links ]
Available online 11 Nov 2016
Presented at the 27 annual conference of the Southern African Institute for Industrial Engineering (SAIIE), held from 27-29 October 2016 at Stonehenge in Africa, North West, South Africa
* dieter.hartmann@wits.ac.za
† For a list of acronyms, please see nomenclature at the end of the article.

