


Services on Demand
Article
 English (pdf)
 Article in xml format
 Article references
Indicators

Related links
-
 Cited by Google
 -
 Similars in Google
Share

 Permalink
South African Journal of Industrial Engineering
On-line version ISSN 2224-7890
Print version ISSN 1012-277X
S. Afr. J. Ind. Eng. vol.27 n.3 Pretoria Nov. 2016
http://dx.doi.org/10.7166/27-3-1658
CASES STUDIES
An investigation into the barriers to energy efficiency within medium to large manufacturing firms operating withinin the eThekwini municipal area
R. Singh*; J. Lalk
Department of Engineering and Technology Management, University of Pretoria, South Africa
ABSTRACT
Preliminary investigations into the energy efficiency of manufacturing firms operating in South Africa have shown that no previous study of the barriers to energy efficiency has been conducted. This paper sets out to investigate whether there is an energy efficiency gap in medium to large manufacturing firms operating in the eThekwini municipal area. It goes on further to analyse the barriers to energy efficiency in such firms. These barriers are analysed by firm characteristics and across manufacturing sectors. The findings of this research indicate that more can be done to improve the energy efficiency profile within South African manufacturing subsectors. Policy-makers should take these findings into consideration when drafting new policy on energy efficiency.
OPSOMMING
Voorlopige ondersoeke oor energiedoeltreffendheid in vervaar-digingsaktiwiteite van maatskappye in Suid-Afrika toon dat daar geen vorige studies bestaan wat fokus op die struikelblokke van toepassing op bestaande energiedoeltreffendheid nie. Hierdie artikel ondersoek 'n energiedoeltreffendheidsgaping wat bestaan binne medium tot groot vervaardigingsmaatskappye binne die eThekwini munisipale gebied. Die ondersoek identifiseer en analiseer gepaardgaande beperkinge wat bestuurders binne sulke maatskappye verhinder om energie doeltreffendheid te implementeer. Die ondersoek en analise strek oor 'n aantal vervaardigingsektore. Die bevindinge van hierdie navorsing dui daarop dat heelwat meer bereik kan word in terme van energie-doeltreffendheid binne die verskeie vervaardigingsubsektore in Suid-Afrika. Hierdie gevolgtrekkings behoort in ag geneem te word deur beleidmakers tydens die opstel van 'n nuwe beleid oor energie-doeltreffendheid.
1 INTRODUCTION
Energy sustainability has become a topic of discussion among world leaders and political parties, and nations worldwide are beginning to realise the impact of this concept on social, environmental, and economic indicators [1]. Moving towards energy sustainability will require more than just changes in the way energy is generated and supplied, but also in the way it is used. Energy efficiency (EE) is a key determinant of energy sustainability that offers significant potential benefits. EE is seen as a cost-effective approach to sustainable economic development and the simultaneous reduction of energy consumption trajectories.
In South Africa, the industrial sector is a major consumer of energy, accounting for about 35 per cent of the total final energy consumption [2]. Further, the industrial sector has been shown to have a high-energy-intensity character [3]. From this it is clear that some industrial firms do not readily adopt EE technologies to help reduce their intensity profile. This provides some evidence of the possibility of an EE gap. A vast literature on the phenomenon known as 'the efficiency gap' or 'the energy paradox' has been published to date, as discussed in DeCanio [4], Weber [5], DeCanio [6], and DeCanio and Watkins [7]. This concept can be argued as follows: while it is well known that, from a technical point of view, EE improvement programmes are economically profitable, it is not well understood why such technical solutions are not exhaustively exploited by firms. Several case studies of this paradox have been discussed in Koomey, Sanstad and Shown [8] and Decanio [4]. This singularity in economic theory on EE has been at the centre of debate for many years. This paper will attempt to account for this paradox through an investigation of barriers to EE in medium to large manufacturing firms (MLMFs) operating in the eThekwini municipal area (EMA). Another research objective of this study is to understand the extent to which EE adoption is influenced by firm-level characteristics and sector type. A survey of the literature on EE indicates that patterns of EE adoption vary considerably across industrial firms, each with differing operating characteristics. For example, Sardianou [20] shows that in Greek industries the perceived knowledge of energy conservation practices is especially high in large industries. As a result, any EE policy mechanism needs to be specific to the target sector and characteristics of the firms being considered.
Three main questions are raised in this study: (i) Is there an EE gap among firms operating in the EMA? (ii) What are the barriers to EE adoption among these firms? (iii) How do these barriers vary by manufacturing sector and with the characteristics of the firm?
This paper is organised as follows: Sections 2 and 3 provide background to the energy context in South Africa. Section 4 presents a taxonomy of the barriers to EE. Section 5 presents a conceptual model of how these barriers operate. Section 6 describes the methodology used for this research. Section 7 discusses the empirical findings. Section 8 presents a summary of the findings and their contribution to the general literature on EE. Section 9 offers recommendations for future research arising out of this study. Section 10 provides some cautionary notes about the application of the results. Finally, Section 11 presents the conclusion.
2 ENERGY IN SOUTH AFRICA
Historically, South African consumers enjoyed relatively cheap electricity that attracted significant foreign direct investment and resulted in large- and small-scale industries operating inefficient plant or specifying inefficient processes from an energy point of view - giving the economy its high-energy-intensity character. EE was not always a technical consideration in process design or on the agenda of the executive team of many businesses, nor was there any incentive to save energy. This inefficient use of energy has resulted in South Africa's CO2 emission per person being more than double than that of the world average [9]. Aslund [10] shows that South Africa's addiction to coal has resulted in its being the highest CO2 emitter on the African continent. About 90 per cent of the electricity the country generates is produced from coal [11]. In the short term, CO2 emissions are set to grow with the commissioning of the Kusile and Medupi power stations. The South African social landscape has been a significant contributing factor to energy supply restrictions relating to peak consumption and energy demand. Before 1994, two-thirds of South Africa's population did not have access to basic electricity. The post-apartheid period saw the supply of electricity to previously-disadvantaged areas as a key national objective. However, these mass electrification schemes did not seize the opportunity to implement energy-efficient mechanisms. Furthermore, the opening up of the market, together with the cheap price of electricity, resulted in rapid economic growth. Unfortunately, such growth patterns were not catered for adequately in Eskom's load forecast planning [12]. This lack of capacity planning, coupled with an inefficient energy-intensity trajectory, has resulted in the current electricity crisis where demand outstrips supply.
3 ENERGY EFFICIENCY EFFORTS IN SOUTH AFRICA
In the medium term, in order to reduce the energy deficit, the country had embarked on several EE efforts. As medium to large industry is seen to be among the highest energy consumers, most efforts were initially focused on such entities.
The recent promulgation of the EE Tax Credit Act (Section 12L of the Income Tax Act of 1962 [13]) serves as an incentive for businesses to become more energy-efficient. This is supported by the SABS:SANS 50010:2011 standard, which is intended to ensure a standardised approach to the measurement and verification of energy savings through EE initiatives. Other efforts, such as the development of national standards for energy sustainability (e.g., SANS 10400-XA, which governs building regulations, and SANS 204:2011 on EE in buildings), assist in ensuring governance in the move to EE [14].
In 2011, an International Organisation for Standardization (ISO) standard on energy management systems (ISO 50001) was released. Such a system is integral to the systematic reporting on and monitoring of energy performance in the confines set out by an organisation's energy policy [15]. Some large South African industrial consumers have already adopted this standard as part of a pilot industrial EE (IEE) improvement project.
The Integrated Resource Plan, Revision 2 (IRP2) of 2011 mentions EE demand-side management (EEDSM) as an important consideration for future generation options [16]. The report highlights two scenarios for EE: a high-efficiency scenario, and a conservative approach. The high-efficiency scenario, however, is seen as a risky option for inclusion in capacity planning. The conservative approach takes existing EE programmes into consideration, ensuring a higher level of energy security in future capacity. The final policy-adjusted IRP2 adopted the conservative EEDSM strategy.
Focused consideration of EE at the national level dates back to 2004 when the Department of Minerals and Energy (DME) released the National Energy Efficiency Strategy (NEES) for the Republic of South Africa [17]. While consideration was given to EE in earlier national white papers on energy policy, it was only in the 1998 policy release that a formal strategy for EE was proposed. This strategy aimed to enhance energy security, to de-couple energy consumption from economic growth, and to reduce greenhouse gas emissions [17]. This strategy has been reviewed twice since 2005, and a product of the second review was a policy-mapping study that served as input into the National Energy Efficiency Action Plan (NEEAP). A target proposed by the strategy was a final national energy demand reduction of 12 per cent by 2015 (compared with 'business as usual') through EE mechanisms measured from 2000 as the base year. One of the concerns in the NEES is that, while ambitious targets were proposed, no investigation into the barriers to EE in the South African landscape was carried out.
4 BARRIERS TO ENERGY EFFICIENCY
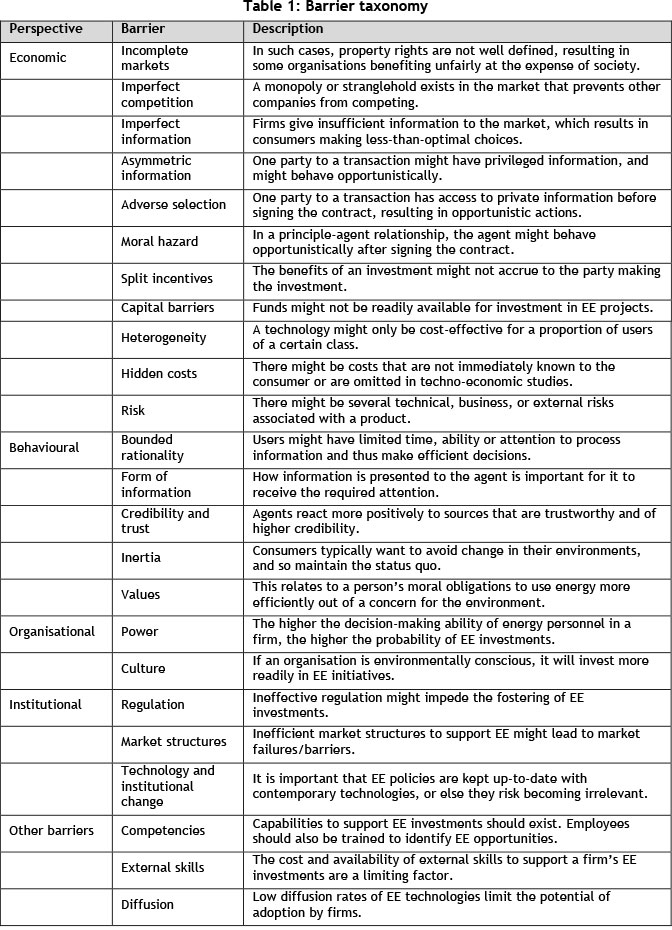
Sorrell et al. [18] define a barrier as "a postulated mechanism that inhibits investments in technologies that are both energy efficient and (at least apparently) economically efficient". The resultant efficiency gap is in direct conflict with mainstream economic theories, in terms of which business always seeks to maximise profits. The mechanisms that inhibit investment in EE technology are also deeply entrenched in organisational and transaction cost economics, as recent studies have shown. Sorrel et al. [18] note that mainstream (i.e., neoclassical) economics alone is insufficient to provide a holistic view of the barriers to EE. A literature review of past and more recent studies shows that a range of barriers contribute to this efficiency gap. Sorrel et al. [18] and Weber [19] classify these barriers into three groups: economic, organisational, and behavioural. More recent literature on the concept extends these classifications to include institutional barriers. The taxonomy used in this study is drawn from this literature, and is shown in Table 1.
5 CONCEPTUAL MODEL OF THE ENVIRONMENT
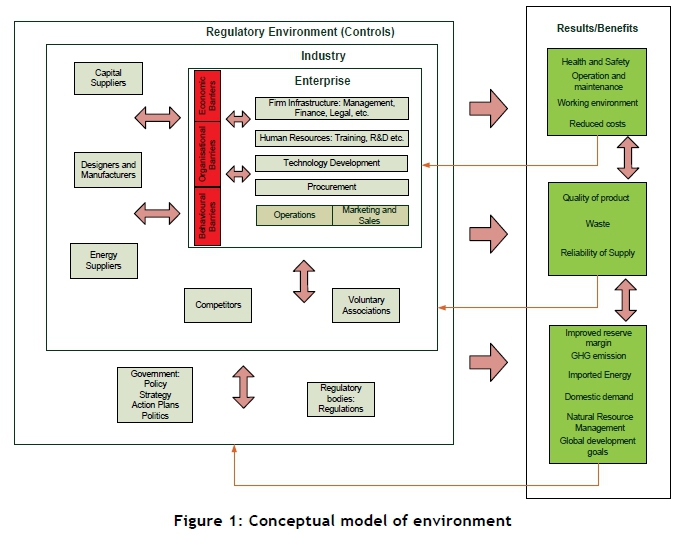
In order to understand better how the actors, drivers, barriers, and benefits to EE interact in a system, we propose the conceptual model shown in Figure 1. The model demonstrates that the enterprise has its own internal dynamics that are influenced by the macro-environment. The enterprise works to achieve the benefits that EE has to offer either selflessly or as a way to comply with regulatory impositions. The magnitude of the results is constantly moderated by the barriers. Taken together, the barriers are a blend of the macro-economic environment and the internal dynamics of the organisation. As every enterprise operates in the same macro-economic environment, it is expected that, at the broader level, all organisations are exposed to similar barriers. However, the characteristics of the enterprise determine the extent to which the enterprise itself is affected.
6 METHODOLOGY
In this survey, empirical analysis is conducted using a sample of 246 manufacturing firms operating in the EMA. The survey was conducted in the period from 11 May 2015 to 8 August 2015. A three-part questionnaire was developed, covering the general characteristics of the firm and the barriers to EE that industry experiences.
The questionnaire was constructed and administered through telephonic calls, emails and face-to-face interviews with the manager or a suitably-qualified representative from each firm. Firms were selected randomly from a database actively managed and maintained by the University of Kwa-Zulu Natal's Faculty Of Population Studies. The database consisted of six sectors: food and beverages, chemicals, iron and steel, metals, electric apparatus, and automotive and non-metallic minerals. The overall item response rate achieved was better than 99 per cent. The final overall response rate was much lower, at 16 per cent. This response rate, however, is higher than the average for surveys questioning barriers in industrial firms ([20], [21], [22], which had response rates of 6,5 per cent, 12 per cent, and 4,2 per cent respectively).
The first and second questions of this research are answered by providing a descriptive analysis of the results. Investment and adoption rates of EE technologies provide an indication of the EE profile. We determine whether there is an EE gap through a quantitative inspection of the results using four key quality criteria. These include whether firms have an energy manager in their organisational structure, whether they have energy targets in place, whether there is any awareness of tax incentives, and whether the organisation has an EMS in place and in use.
To determine how the barriers vary on a per-sector basis, a non-parametric test is performed, as the sample sizes per sector are small and tests for normality could not be determined with confidence. Since the non-parametric test involves testing for statistical significance between two or more groups, the Kruskal-Wallis H test is employed.
To determine how the barriers vary with the characteristics of the firm, ordinal logistic regression (OLR) is deployed, as the barrier variables are measured on an ordinal scale. Each barrier is regressed on firm characteristics. The expanded model shown in equation (1) below is used for the purposes of this study.
where: Yj= ith barrier, Bi = company size, B2= competitiveness, B3= age, B4= energy costs, B5= property ownership type, B6 = training plan, β7 = debt ratio, B8 = profitability, B9 = marketing costs, B10= invested in EE tech, B11 = international orientation, B12 = ISO 14001.
7 EMPIRICAL RESULTS AND DISCUSSIONS
This section has two parts. First it answers the first question of this research by providing a descriptive analysis of the results. It then investigates the barriers to EE. Each of these sections concludes with a discussion of the results.
7.1 Descriptive analysis
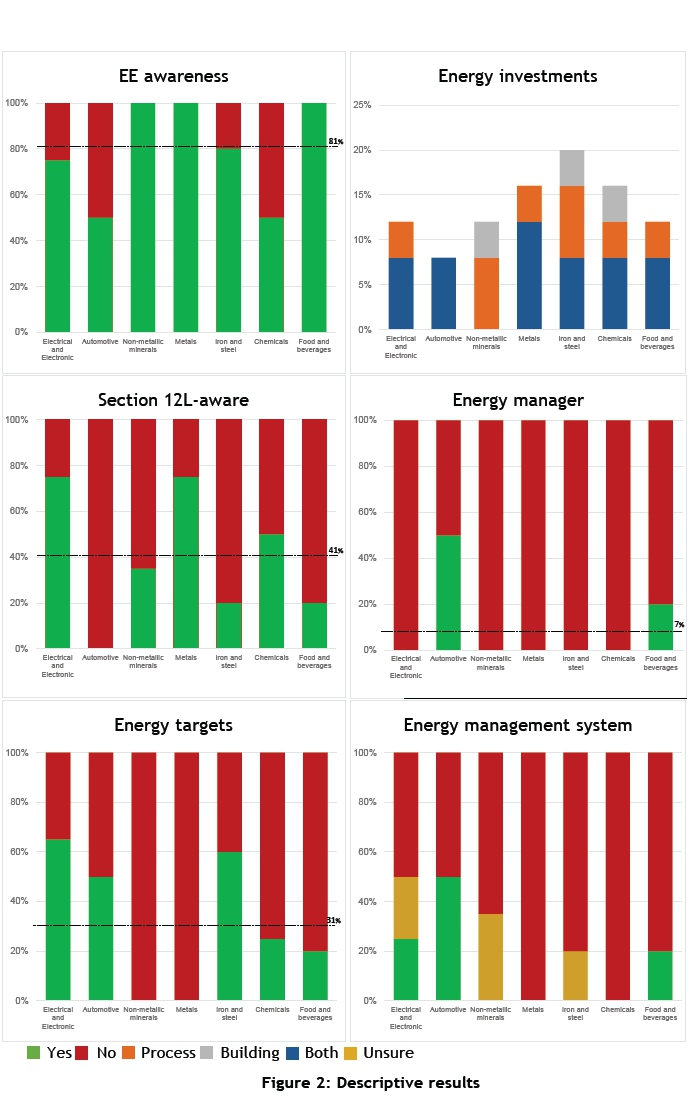
The descriptive statistics present a profile of the EE performance of MLMFs in the EMA. The results are shown graphically in Figure 2, and are discussed below.
7.1.1 EE awareness
There is generally a high level of EE awareness across manufacturing sectors, especially in the non-metallic minerals, metals, and food and beverages sectors. The aggregate level of awareness of EE technologies stands at around 81 per cent for the MLMFs in the EMA. High awareness levels also suggest that there is a significant amount of information diffusion on EE technologies. Interestingly, Figure 2 reveals that some firms in the energy-intensive categories are still not aware of EE technologies that are available to their industry. Such cases should be urgently addressed.
7.1.2 EE investments
Firms were asked whether they had made any EE investments in their specific processes or as part of their general building infrastructure. They were also separately asked whether such investments had brought any benefits. The graph of EE investments in Figure 2 shows each sector's performance against the overall population.
The results show that there is generally a high level of investment in process-related EE technologies (with around 78 per cent of firms responding positively). There is especially a high level of such investment in the automotive and metals sector. There is much room for improvement in the non-metallic minerals, chemicals, and iron and steel industries in particular, because they operate in an energy-intensive environment. About 76 per cent of those who have invested in EE technologies have seen a positive result. A further 19 per cent of those who have invested were unsure whether any benefits had been achieved. This was either because they did not measure after investment, or were not made aware of the associated benefits. A small percentage of those who have invested did not see any improvement. Investments in process-related EE technologies in the electrical and electronic, automotive, non-metallic minerals, and metals sectors generally had an overall positive impact.
The results show that there is generally a lower adoption rate of EE building technologies compared with process-related options, despite such options being regarded as 'low-hanging fruit'. The average adoption rate of EE-related building technologies is around 63 per cent among the MLMFs in the EMA, compared with 78 per cent for EE process-related technologies. About 67 per cent of those companies who have invested in EE building technologies have seen positive results through a reduction in costs, among other things. In addition, about 22 per cent have either not measured the results or have not been made aware of the associated benefits. A lower percentage of respondents (about 7 per cent) advised that they have seen no positive reduction in costs. These results are similar to the results presented for the derived EE benefits from process-related investments.
7.1.3 Awareness and adoption of Section 12L
The recent promulgation of the EE Tax Credit Act (Section 12L in the Income Tax Act of 1962) [13] serves as an incentive for businesses to adopt EE technologies.
About 41 per cent of the sampled population are aware of the Section 12L EE Tax Credit Act. The level of awareness varies widely across the manufacturing subsectors. The electrical and electronic and metals subsectors generally have a higher level of awareness of the Act than do the other sectors. Of those who are aware of the Act, only about 7 per cent have implemented it. These firms are located in the electrical and electronic and food and beverages manufacturing subsectors. As this Act provides an incentive for companies to engage in EE activities, the low awareness and implementation rate reveals that higher adoption rates of EE technologies are indeed possible.
7.1.4 Energy manager
Only about 7 per cent of the MLMFs in the EMA have appointed a dedicated energy manager. The results show that these firms are typically located in the automotive and food and beverages sectors. It is notable that those firms that are energy-intensive have no energy manager in their structures, despite ISO 50001 and other best practices that recommend the appointment of such a manager. Of those who have reported that they do have an energy manager, only 50 per cent reported that this manager reports to the company's board. The appointment of dedicated EE managers reveals management's perception of the role that EE plays in its operations. An appointment rate of 7 per cent indicates that more awareness on the benefits that such an appointment could add to a company's operations should be created.
7.1.5 Energy improvement targets
Firms were asked whether they had set any energy improvement targets as part of a strategy to reduce their overall energy consumption. The results show that about 31 per cent of them have energy improvement targets in place. Notably, however, none of the firms sampled in the non-metallic minerals and metals sector have energy improvement targets in place, despite their classification as energy-intensive. There is generally a low uptake in establishing energy improvement targets by manufacturing entities across all manufacturing sectors.
7.1.6 Energy management system (ems)
Firms were asked whether they have implemented an EMS in their business. An EMS helps an organisation to follow an orderly and methodical approach to achieving continual improvement in energy performance.
The results indicate that only 11 per cent of the sampled firms have an EMS in place. Notably, the non-metallic minerals, metals, iron and steel, and chemicals subsectors either do not have an EMS in place or are not sure, despite their classification as energy-intensive. There is much room for the uptake of EMSs in such sectors. While there is a high adoption rate of EE technologies, the sustainability of such solutions is questionable without EMSs in place.
7.1.7 Discussion of results
The results show that more can be done to improve the efficiency landscape of MLMFs, especially in the energy-intensive manufacturing sectors. While there is a generally high level of awareness and adoption of EE technologies in the EMA, the quality of the adoption profile is poor. There is an extremely low appointment rate of energy managers (7 per cent), a poor adoption rate of energy targets among firms (31 per cent), a generally low level of awareness of EE tax incentives offered by government, and among the high energy users, there is a low adoption rate of EMSs. These factors taken together indicate that there is an EE gap in the market.
While many firms are indeed aware of EE technologies that are available on the market, a proportion (19 per cent) remains that has had no exposure to date. Despite government's initiatives in providing subsidies for EE-related improvements to buildings, a third of the firms sampled have not implemented any EE technologies in their buildings. It was also found that a proportion of those who have invested in EE technologies were not able to determine whether there has been any return on their investment, especially for EE building technologies.
The low awareness of section 12L offers hope that higher adoption rates of EE technologies are still possible once consumers become more aware of this option. There is also much room for setting up efficiency targets in the metals and non-metallic minerals sectors, especially since they are considered to be energy-intensive. Where firms have already invested in EE technologies, it is important that they put in mechanisms in place to monitor and report on such improvements so that the benefits do not go unnoticed.
7.2 Barriers to energy efficiency
One of the main objectives of this research is to understand better the factors that prevent firms from adopting EE technologies. This section aims first to rank the mean score of the barriers obtained from the survey. It then investigates how these barriers vary by manufacturing sector and firm characteristics.
7.2.1 Ranking of barriers
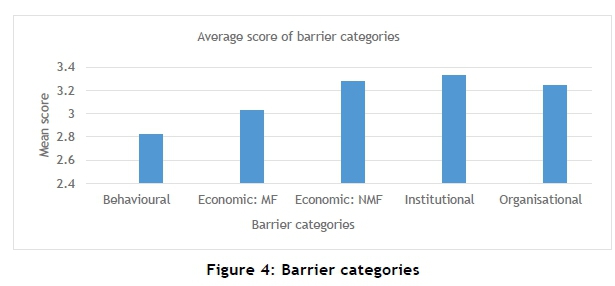
Firms were asked to rank barriers on a five-point Likert scale (strongly disagree=1 to strongly agree=5). The mean scores are shown in Figure 3 below.
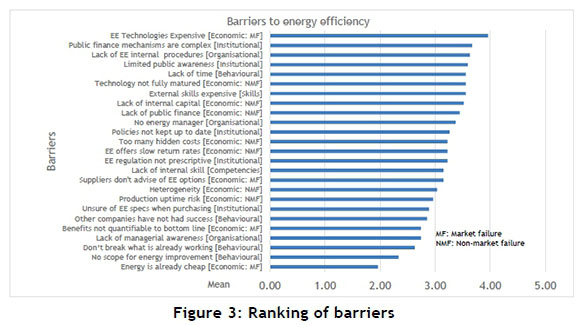
The mean scores for the barriers range between 2 and 4. The main barrier that prevents firms from investing in EE is the cost of EE technologies. This is a market-related issue, and it points to the possibility of imperfect competition in the marketplace or to the lack of sufficient economic stimulus to help make EE technologies more viable in price. Where public finance mechanisms exist, they are still quite complicated to access. Institutions need to facilitate the provisioning of grants, subsidies, and loans for EE investments better.
Firms also feel that there is a lack of internal policies and procedures in the business that could promote the adoption of EE. While this is an organisational-related barrier, it does not remove the need for institutional support in specifying such policy and mandating compliance.
Figure 4 summarises the barrier score by category, and indicates that institutional barriers are the main contributor to inhibited EE adoption among MLMFs in the EMA. Future policy on EE should address this concern.
7.2.2 Barrier variation by manufacturing sector
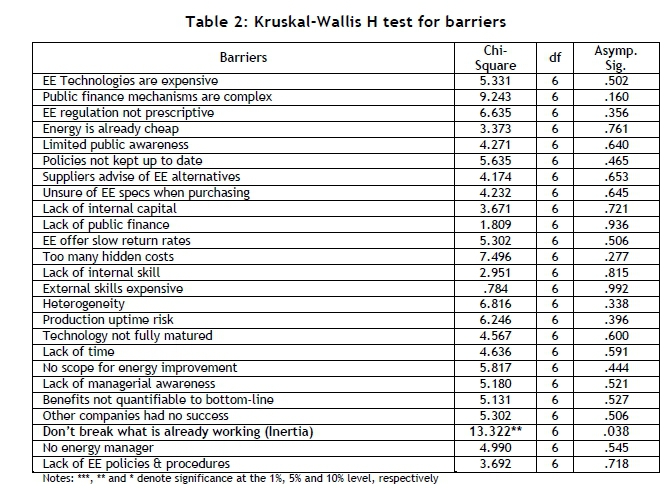
To determine how the barriers vary by manufacturing sector, a Kruskal-Wallis H test is deployed, as discussed in Section 6. The result of this test is shown in Table 2.
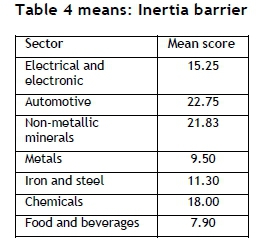
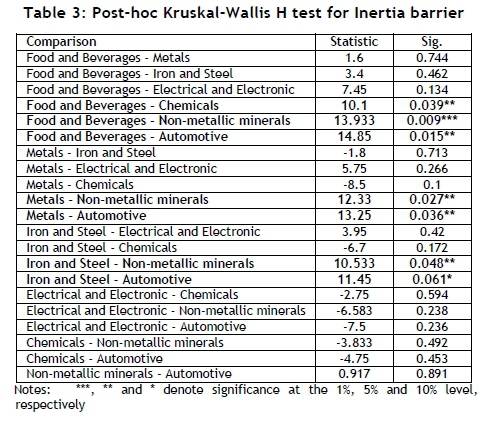
The Kruskal-Wallis H test shows that the barrier mean scores are similar across manufacturing sub-sectors. The exception is the inertia barrier, where there was a statistically-significant difference between the mean scores, X2 (6)=13.22, p=0.038, with means given in Table 4 below. To test which sectors differ significantly on the inertia barrier, we deploy a post-hoc Kruskal-Wallis test. The post-hoc test involves pairwise comparisons of the inertia variable with the various sectors. The results of the post-hoc tests are shown in Table 3 below.
7.2.3 Barrier variation with firm characteristics
To determine how the barriers vary with the characteristics of the firm, we employ the ordinal regression method, as discussed in Section 6 above. The results are shown in Table 5 below.
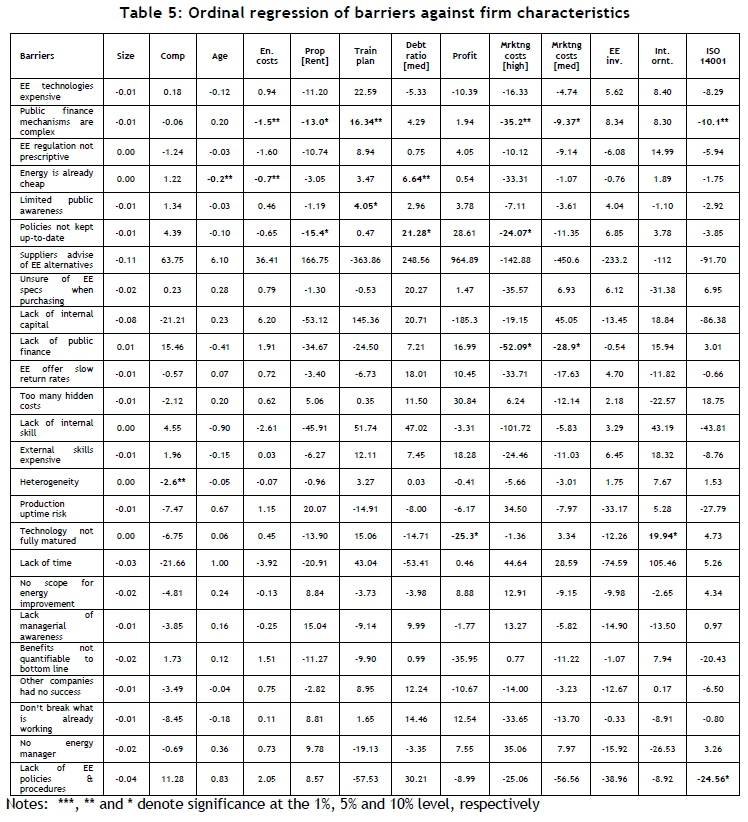
Since the ordinal regression method produces coefficients at log odds, we limit the interpretation of the results only to the direction of the effects, and ignore the magnitude of the results. We list significant results at the 1 per cent, 5 per cent, and 10 per cent levels. In total, nineteen significant results were found, of which six were at the 5 per cent level and 13 were found at the 10 per cent level.
a) Competitive organisations are associated with a reduction in the odds of considering heterogeneity of EE technologies a barrier, with a log odds ratio of -2.55 (95 per cent CI, -5.116 to 0.022), Wald x2 (1) =3.775, p < .052. Interpretation: Competitive organisations are more likely to feel that EE technologies can be used across engineering domains. This is likely, as competitive firms are cost-driven. Implication: More awareness of EE technology homogeneity in less competitive sectors is required from a policy point of view.
b) An increase in age (expressed in years) is associated with a decrease in the odds of considering energy to be already cheap as a barrier to EE investments, with a log odds ratio of -0.21 (95 per cent CI, -.379 to -0.035), Wald X2(1) =5.580, p < .018. Interpretation: Older organisations are less likely to consider the cheap price of energy as a barrier to EE technology investment. Implication: Younger organisations should be advised of the secondary benefits of EE investments, and be less cost-driven about EE investments.
c) An increase in energy costs (expressed as a ratio of sales) is associated with a decrease in the odds of considering energy to be already cheap as a barrier to EE investments, with a log odds ratio of -0.69 (95 per cent CI, -1.300 to -0.077), Wald X2(1) =4.876, p < .027. Interpretation: Higher energy users do not consider the already cheap price of energy as a barrier to EE technology investment. Implication: This finding is good news for policy makers, as high energy users are still driven to invest in EE technologies despite the cost of energy. With regard to low-energy users, more business cases that take the secondary benefits of EE into account should be put forward.
d) The log odds of firms with a medium debt ratio (between 40 per cent and 70 per cent) considering energy to be already cheap as a barrier to EE investment are 6.639 (95 per cent CI, -0.007 to 13.285) times higher than those of firms with a low debt ratio - a statistically significant effect, Wald X2(1) =3.834, p < .05. Interpretation: Firms with a higher debt ratio find that the low cost of energy prevents them from investing in EE technologies. Implication: Firms with high debt ratios probably find the cost of energy cheaper than the interest that such firms would pay on new EE capital projects. New EE capital projects will incur more debt at high interest rates and further increase their already high liability. Such firms should be made aware of the EE tax credit option available from government, and include this in their costing models for EE projects. They should also be made aware of the several secondary benefits of EE.
e) An increase in energy costs (expressed as a ratio of sales) is associated with a decrease in the odds of considering public finance mechanisms to be difficult as a barrier to EE investments, with a log odds ratio of -1.517 (95 per cent CI, -2.957 to -0.078), Wald X2(1) =4.269, p < .039. Interpretation: Those organisations that have high energy costs do not find public finance mechanisms difficult to access. Implication: While this proves that EE institutions are targeting the right audience - i.e., energy-intensive firms - they should ensure that less-intensive users are not kept on the back burner for too long. It should be noted that there are great economies of scale for EE reduction that can still be leveraged out of the high volume of low-intensity firms.
f) The log odds of firms who rent their premises and that consider public finance mechanisms to be difficult as a barrier to EE investments are -12.988 (95 per cent CI, -27.755 to 1.779) times lower than firms that own the property on which they operate - a statistically significant effect, Wald X2(1) =2.972, p < .085. Interpretation: Firms that own the property on which they operate generally find public finance mechanisms difficult to access, compared with those that rent the property. Implication: Firms that own the property on which they operate are probably more active in accessing EE public financing mechanisms, and while doing so, find these mechanisms difficult to access. EE institutions should therefore investigate possible bottlenecks in their administration - or initiate a secondary project to investigate the apparent problems.
g) The log odds of firms who have a training plan in place and in use that consider public finance mechanisms to be difficult as a barrier to EE investments are 16.335 (95 per cent CI, .911 to 31.760) times higher than firms who do not have a training plan - a statistically significant effect, Wald X2(1) =2.972, p < .085. Interpretation: Firms with a skilled workforce find public finance mechanisms difficult to access. Implication: Similar to point f above, such firms are probably more active in accessing public mechanisms. Again, EE institutions should investigate possible bottlenecks in their administration.
h) The log odds of firms with a medium marketing cost ratio (between 4 per cent and 20 per cent) considering public finance mechanisms to be difficult as a barrier to EE investments are -9.370 (95 per cent CI, -20.408 to 1.669) times lower than those of firms with a low marketing cost ratio (<4 per cent) - a statistically significant effect, Wald X2(1) =2.768, p < .096. Interpretation: Those firms with higher marketing costs do not find public finance mechanisms difficult to access for investment in EE technology. Implication: As marketing costs are used as an indication of a firm's image in the marketplace, well-known firms seem to experience less difficulty than others in accessing public finance mechanisms. This addresses point e above. Institutions should make sure that smaller and less popular firms are not kept isolated from such mechanisms.
i) The log odds of firms with a high marketing cost ratio (> 20 per cent) considering public finance mechanisms to be difficult as a barrier to EE investments are -35.224 (95 per cent CI, -69.738 to -.751) times lower than those of firms with a low marketing cost ratio (<4 per cent) - a statistically significant effect, Wald X2(1) =4.010, p < .045. Interpretation: Those firms with higher marketing costs do not find public finance mechanisms difficult to access for investment in EE technology. Implication: This point further validates point h above. Therefore the same conclusions can be drawn.
j) The log odds of firms who are ISO14001 -registered that consider public finance mechanisms to be difficult as a barrier to EE investments are -10.098 (95 per cent CI, -20.039 to -0.157) times lower than firms that are not ISO14001-registered - a statistically significant effect, Wald X2(1) =3.964, p < .046. Interpretation: Those firms that are ISO14001 -registered generally do not find public finance mechanisms difficult to access for investment in EE technology. Implication: Firms that are ISO14001-registered find it easier to access public finance mechanisms. Consistent with point h above, the administration of public finance mechanisms should adopt a homogenous approach, ensuring that groups of firms are not isolated from such benefits. It also suggests that ISO14001 may serve as an enabler to accessing public finance mechanisms for EE investments.
k) The log odds of firms that rent and that consider policies not kept up to date as a barrier to EE investments are -15.429 (95 per cent CI, -32.251 to 1.393) times lower than firms that own the property on which they operate - a statistically significant effect, Wald X2(1) =3.231, p < .072. Interpretation: Those firms that own the property on which they operate find that policies on EE that are not kept up to date serve as a barrier to EE investment, as opposed to those that rent their property. Implication: As firms that own the property on which they operate are more likely to be more active in EE, such firms find that the policies on EE do not track technology well, resulting in policies becoming outdated, posing a barrier to EE adoption. Policy should therefore be revised more frequently to take newer technologies that enter the market into account.
l) The log odds of firms with a medium debt ratio (between 40 per cent and 70 per cent) considering policies not kept up to date as a barrier to EE investment are 21.283 (95 per cent CI, -1.882 to 44.448) times higher than those of firms with a low debt ratio - a statistically significant effect, Wald X2(1) =3.243, p < .072. Interpretation: Firms with medium debt ratios (between 40 and 70 per cent) are more likely to find policies not being kept up to date a barrier to EE investment. Implication: Policies not being kept up to date makes it more difficult for heavily-indebted firms to adopt EE technologies. Such policies pose a risk to firms, especially those that are highly-indebted; such firms are generally already risk-averse. Similar to the points raised above, policy should be revised more frequently to take newer technologies that enter the market into account.
m) The log odds of firms with a high marketing cost ratio (> 20 per cent) considering policies not being kept up to date as a barrier to EE investments are -24.067 (95 per cent CI, -52.265 to 4.130) times lower than those of firms with a low marketing cost ratio (<4 per cent) - a statistically significant effect, Wald X2(1) =2.798, p < .094. Interpretation: Firms with higher marketing costs are less likely to find policies not being kept up to date a barrier to EE investment. Implication: Points k, l and m indicate that there is a difference of opinion about whether policies are indeed kept up to date, depending on the characteristics of the firm. This warrants further investigation into the reason behind the differences of opinion on the matter. Where policies are indeed found to be out of date, they should be revised more often to take newer technologies that enter the market into account.
n) The log odds of firms that have a training plan in place and in use that consider limited public awareness a barrier to EE investments are 4.054 (95 per cent CI, -.712 to 8.820) times higher than firms that do not have a training plan - a statistically significant effect, Wald X2(1) =2.779, p < .096. Interpretation: Firms that have a training plan in place and in use are more likely to find limited public awareness about EE a barrier to EE investment. Implication: Firms with a training plan in place and in use generally have a skilled workforce. Such employees are aware of the potential that EE has to offer, but feel that there is limited public awareness about such opportunities. More public awareness campaigns should therefore be put in place to reduce the effect of this barrier.
o) The log odds of firms with a medium marketing cost ratio (between 4 per cent and 20 per cent) considering the lack of public finance a barrier to EE investments are -28.925 (95 per cent CI, -63.194 to 5.324) times lower than those of firms with a low marketing cost ratio (<4 per cent) - a statistically significant effect, Wald X2(1) =2.740, p < .098. Interpretation: Firms with higher marketing cost ratios are less likely to find the lack of public finance a barrier to EE investment. Implication: Again, as marketing costs are highly correlated with a firm's image in the marketplace, well-known firms seem to have easier access to public finance. This addresses point e raised above. Institutions should make sure that smaller and less-popular firms are not kept isolated from such facilities.
p) The log odds of firms with a high marketing cost ratio (> 20 per cent) considering the lack of public finance as a barrier to EE investments are -52.087 (95 per cent CI, -109.734 to 5.559) times lower than those of firms with a low marketing cost ratio (<4 per cent) - a statistically significant effect, Wald X2(1) =3.136, p < .077. Interpretation: Firms with even higher marketing cost ratios are less likely to find the lack of public finance a barrier to EE investment. Implication: This point validates point o above. The same conclusions can therefore be drawn.
q) The log odds of firms that are profitable and that consider technologies not being fully matured as a barrier to EE investments are -25.285 (95 per cent CI, -54.799 to 4.229) times lower than firms that are not profitable - a statistically significant effect, Wald X2(1) =2.819, p < .093. Interpretation: Firms that are profitable are less likely to find technologies not being fully matured a barrier to EE investment. Implication: Firms that are profitable generally have a greater risk appetite to take on innovative technology. Less profitable firms might not share this risk appetite. EE institutions should ensure that there is diffusion of such EE adoption cases. Further, to help control the impact of the risk, EE institutions should mandate that suitable guarantees be offered on all EE products entering the market.
r) The log odds of firms that have an international orientation (measured by export and global facilities) and that consider technologies not being fully matured as a barrier to EE investments are 19.937 (95 per cent CI, -3.163 to 43.037) times higher than firms that do not have an international orientation - a statistically significant effect, Wald X2(1) =2.862, p < .091. Interpretation: Firms that have an international orientation are more likely to find technologies not being fully matured a barrier to EE investment. Implication: Technologies that are not fully matured create significant risk in EE investment options. EE institutions should investigate the reasons for the difference in perspectives on the maturity of EE technologies in the local and international context. More research on what drives this opinion might be required. The difference in perspective might be driven by exposure: firms that operate in an international context might have greater exposure to EE technologies, which might drive their perspective. EE manufacturers should consider offering higher guarantees on products to allay fears about product maturity.
s) The log odds of firms that are ISO14001-registered and that consider the lack of internal EE policies and procedures as a barrier to EE investments are -24.564 (95 per cent CI, -53.668 to 4.539) times lower than firms that are not ISO14001-registered - a statistically significant effect, Wald X2(1) =2.737, p < .098. Interpretation: Firms that are ISO14001-registered are less likely to find the lack of internal policies and procedures a barrier to EE investment. Implication: Policy should focus more on a firm's ISO14001 registration/ compliance, as this acts as an enabler of EE adoption. Firms that are ISO14001-registered already have internal policies and procedures in place. Naturally, ISO14001 would drive EE adoption - i.e., ISO14001 has a spill-over effect.
8 SALIENT FINDINGS AND CONTRIBUTION TO GENERAL THEORY ON ENERGY EFFICIENCY
The salient findings are summarised below, and should be taken into consideration in the development of future policy on EE.
a) Firms are primarily cost-centric in their approach to EE.
b) Institutional barriers pose the greatest hurdle to EE adoption among MLMFs in EMA.
c) More effort to improve the quality of the EE profile, especially among high energy-intensity users, is recommended. Adoption of ISO50001 will help to improve the quality of the EE adoption profile.
d) The barriers to EE have mostly been found to be similar across manufacturing sectors in EMA.
e) Public finance mechanisms should be made equally available to all firms, irrespective of age or energy intensity.
f) There is evidence to confirm that ISO14001 is an enabler of EE technology adoption. ISO14001 has a positive spill-over effect on EE adoption.
g) In cases where energy is already considered cheap, more innovative pricing models need to be developed in order to encourage firms to adopt EE technologies.
h) Firms in general should be made aware of the other secondary benefits associated with EE technologies. Comparative labelling on products that showcases the quality improvements and overall lifecycle cost savings against standard alternatives should be considered.
i) There is concern about the maturity of EE technologies, especially among firms that are less profitable. EE technologies should offer better guarantees to allay such fears. Initial capital costs should be subsidised or be allowed to be paid back from EE savings over the lifecycle of the technology.
9 RECOMMENDATIONS FOR FUTURE RESEARCH
During the course of this study, the following gaps were identified as needing further research:
a) An investigation into the bottlenecks in the administration of EE institutions should be conducted, especially about the matter of financing mechanisms.
b) Where energy is considered cheap, more innovative pricing models should be investigated to foster EE investment. Such models should integrate the cost of pollution as a result of inefficient energy-use.
c) While this study focused on MLMFs, significant scope for energy improvement lies in small to medium manufacturing firms. While the per-firm reductions may be smaller than those for energy-intensive industry, the higher volume creates scope for economies of scale. Research into the EE performance of such firms should be conducted.
d) The existence of an EE gap prompts further investigation into the maturity levels of EE technologies and the diffusion rates of success stories.
e) Background studies in the EE landscape in SA revealed that no research on EE performance has been conducted in the residential, mining, transport, and energy sectors. Research into the operating efficiency of such sectors is therefore required.
10 LIMITATIONS OF THIS RESEARCH AND SHORTCOMINGS
During the period of this research, SA's economy was recognised to be entering a technical recession. This was validated by the manufacturing output reported by StatsSA [23]. Load-shedding was also very prevalent at the time of field capture, which further contributed to the downturn in the economy. Taken together, these macro-economic circumstances might have influenced the response rates and attitudinal scores collected as part of the survey.
While it could be successfully argued that the eThekwini region (with the second-biggest manufacturing sector in SA) is representative of the manufacturing landscape of South Africa, the generalisability of the results should be approached with caution. Municipalities offer varying levels of service quality and energy tariffs, which may affect a firm's attitude towards EE. Some manufacturers might also be fed electricity directly from Eskom, and might have service-level agreements in place. These cautionary notes should be taken into account when generalising the results or when making inferences.
The lack of awareness about the quality criteria for EE - EMS, Section 12L implementation, energy targets, and ISO 50001 implementation - resulted in an inability to test for relationships between such criteria and firm profitability.
11 CONCLUSION
The objective of this research was threefold: a) to determine whether there is an EE gap among MLMFs operating in the EMA; b) to understand the barriers to EE that determine this situation; and c) to understand how these barriers vary by manufacturing sector and firm characteristics. Through the use of four key criteria on EE, the results of this study show evidence of an EE gap in MLMFs operating in EMA. While there is a generally high level of adoption of and investment in EE technologies among these MLMFs, the quality of this adoption profile is poor. More focused efforts could be made to improve this adoption profile by ensuring alignment with the ISO50001 EMS.
It was found that the most significant barrier to EE is cost-related. While in some cases EE technologies offer significant benefits for overall cost-reduction, in other cases, EE technologies seems to be priced outside the market. For the EE technology adoption profile to improve, consumers need to have access to the right information to make the right decisions. Policy-makers should consider introducing mandatory EE labelling on components that can offer the consumer immediate lifecycle cost comparisons against standard alternatives. Innovative public financing mechanisms that assist with financing the high initial capital outlay required for EE technologies should be considered. The interest paid on such financing arrangements could be derived from the lifecycle cost savings.
The barriers were mainly found to be similar across manufacturing sectors, but were found to differ considerably from the characteristics of the firm. Manufacturing sectors differed significantly on the inertia barrier. In total there were 19 significant findings about how the barriers vary with the characteristics of the firm. Of those, at least five require urgent policy attention.
Policy-makers should take into consideration the salient findings of this research when drafting new policy on EE. Several recommendations for future research have also been proposed as part of this study. It has been noted that, while this research study focused on MLMFs, there is huge potential for EE research into small and medium enterprises, which represent a significant portion of SA's energy profile.
REFERENCES
[1] WEC. 2012. World energy insight 2012. London: First Publications. [ Links ]
[2] DoE. 2015a. Energy statistics, energy balances, 2012. Accessed online on 20 September 2016. Available from: http://www.energy.gov.za/files/energyStats_frame.html [ Links ]
[3] Inglesi-Lotz, R. and Pouris, A. 2012. Energy efficiency in South Africa: A decomposition exercise, Energy, 42(1), pp. 113-120. [ Links ]
[4] DeCanio, S.J. 1998. The efficiency paradox: Bureaucratic and organizational barriers to profitable energy-saving investments, Energy Policy, 26(5), pp. 441-454. [ Links ]
[5] Weber, L. 1997. Some reflections on barriers to the efficient use of energy, Energy Policy, 25(10), pp. 833835. [ Links ]
[6] DeCanio, S.J. 1993. Barriers within firms to energy efficient investments, Energy Policy, 21(9) pp. 907914. [ Links ]
[7] DeCanio, S.J. and Watkins, W. 1998. Information processing and organizational structure, Journal of Economic Behaviour & Organization, 36(3) (30 August), pp. 275-294. [ Links ]
[8] Koomey, J., Sanstad, A.H. and Shown, L.J. 1996. Energy-efficient lighting: Market data, market imperfections, and policy success, Contemporary Economic Policy, 14(3) (July), pp. 98-111. [ Links ]
[9] Energy and Development Group. n.d. The Department of Biodiversity and Conservation Biology, University of the Western Cape, Cape Town, South Africa. Accessed online on 20 September 2016. Available from: http://www.botany.uwc.ac.za/inforeep/energy3.htm [ Links ]
[10] Aslund, C. 2002. The true cost of coal in South Africa - Paying the price of coal addiction. Norway: Greenpeace. [ Links ]
[11] DoE. 2015b. Electricity overview. Department of Energy, Pretoria. Accessed online on 20 September 2016. Available from: http://www.energy.gov.za/files/electricity_frame.html [ Links ]
[12] Inglesi-Lotz, R. and Pouris, A. 2010. Forecasting electricity demand in South Africa: A critique of Eskom's projections, South African Journal of Science, 106(102), Jan/Feb, pp. 50-53. [ Links ]
[13] KZN Energy. 2014. Energy efficiency tax incentives workshop, Durban, 7 March 2014. Available from: http://www.kznenergy.org.za/energy-efficiency-tax-incentives-workshop-durban-7-march-2014/. [ Links ]
[14] SABS. 2011. SANS 10400-XA: The application of the national building regulations - Part X: Environmental sustainability - Part XA: Energy usage in buildings, SABS Standards Division: Compliance and Development. [ Links ]
[15] ISO. 2011. ISO 50001: 2011(en). Energy management systems - Requirements with guidance for use. Accessed online on 20 September 2016. Available from: https://www.iso.org/obp/ui/#iso:std:iso:50001:ed-1:v1:en. [ Links ]
[16] DME. 2011. Integrated resource plan for electricity 2010-2030 Rev. 2, Final report. Pretoria, South Africa. [ Links ]
[17] DoE. 2005. Energy efficiency strategy of the Republic of South Africa, Department of Minerals and Energy, Pretoria, March 2005. [ Links ]
[18] Sorrell, S., Schleich, J., Scott, S., O'Malley, E., Trace, F., Boede, U., Ostertag, K. and Radgen, P. 2000. Section 3: Understanding barriers to energy efficiency, barriers to energy efficiency in public and private organisations, environment and energy programme, Project JOS3CT970022. SPRU Environment and Energy. [ Links ]
[19] Weber, L. 1997. Some reflections on barriers to the efficient use of energy, Energy Policy, 25(10), pp. 833-835. [ Links ]
[20] Sardianou, E. 2008. Barriers to energy efficiency in Greece. Science Direct, 16(1), pp. 1416-1423. [ Links ]
[21] Shafron, W., Anderson, J. and Harris, J. 2000. Investment in energy efficiency: A survey of Australian firms, Energy Policy, 28(1), pp. 867-876. [ Links ]
[22] De Groot, H.L.F., Verhoef, E.T. and Nijkamp, P. 2001. Energy saving by firms: Decision-making, barriers and policies, Energy Economics, 23(6) (November), pp. 717-740. [ Links ]
[23] StatsSA. 2015. Key findings: P3041.2 - Manufacturing: Production and sales. August 2015. Accessed online on 20 September 2016. Available from: http://www.statssa.gov.za/ [ Links ]
Available online 11 Nov 2016
Presented at the 27 annual conference of the Southern African Institute for Industrial Engineering (SAIIE), held from 27-29 October 2016 at Stonehenge in Africa, North West, South Africa.
* singhres@elec.durban.gov.za
# The author was enrolled for an MEng (Technology Management) in the Department of Engineering and Technology Management, University of Pretoria.

