


Servicios Personalizados
Articulo
 Inglés (pdf)
 Articulo en XML
 Referencias del artículo
Indicadores

Links relacionados
-
 Citado por Google
 -
 Similares en Google
Compartir

 Permalink
South African Journal of Industrial Engineering
versión On-line ISSN 2224-7890
versión impresa ISSN 1012-277X
S. Afr. J. Ind. Eng. vol.27 no.3 Pretoria nov. 2016
http://dx.doi.org/10.7166/27-3-1631
CASE STUDIES
Implementing a business improvement model based on integrated plant information
H.F. Swanepoel*, #; J.H. Wichers
Department of Mechanical Engineering, North West University, South Africa
ABSTRACT
The World Energy Council [1, 2] defines numerous challenges in the global energy arena that put pressure on owners and /operators to operate run existing plant better and more efficiently. As such there is an increasing focus on the use of business and technical plant information and data to make better, more integrated, and more informed decisions on the plant. The research study developed a business improvement model (BIM) that can be used to establish an integrated plant information management infrastructure as the core foundation for of business improvement initiatives. Operational research then demonstrated how this BIM approach could be successfully implemented to improve business operations and provide decision-making insight.
OPSOMMING
Die Wêreld Energie Raad [1, 2] definieer talle uitdagings in die wêreld energie arena wat aanleg eienaars en/of operateurs dwing om bestaande proses-aanlegte beter en meer doeltreffend te bestuur. Dit vereis toenemende fokus op besigheids- en tegniese aanleg inligting en data om beter, meer geïntegreerde en meer ingeligte besluite te neem. Die navorsingstudie het 'n besigheids-verbetering model ontwikkel wat gebruik kan word om 'n geïntegreerde aanleg inligting infrastruktuur te skep as die grondslag vir besigheid verbetering inisiatiewe. Operasionele navorsing is dan ook gebruik om prakties te demonstreer hoe hierdie model en benadering suksesvol geïmplementeer kan word om sakebedrywighede en besluitneming insig te verbeter.
1 INTRODUCTION: THE DRIVERS OF A NEW BUSINESS IMPROVEMENT MODEL
The current world of work revolves around information generated in business operations and analysing this information to make business decisions that will drive business efficiency and maximise profits and plant outputs. Unfortunately, the biggest problem with the mass of data and information being produced on a continuous basis is that very few, if any, individuals can effectively deal with this avalanche of information without the help of intelligent information systems. This becomes an even bigger issue in process plant control and information systems, due to the frequency and volume of process information collected to control plant operations effectively.
An IDC study [3] highlights the cost implications (obvious and hidden) of not being able to find or access the right information at the right time, including:
• Poor decisions (based on incorrect or missing information)
• Duplicated efforts
• Reduced output
• Lost productivity
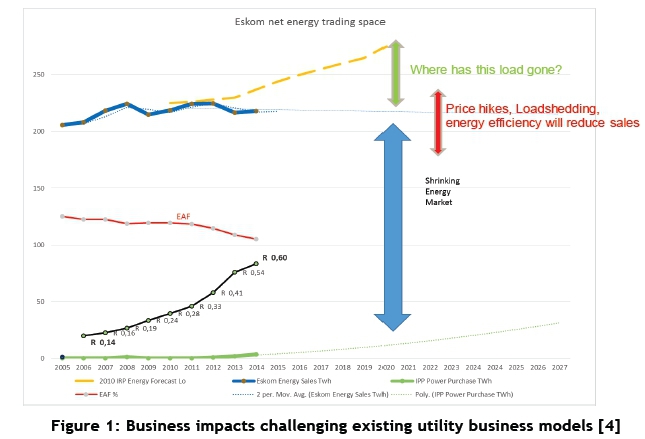
Internal power utility research by Jones [4] has shown that the current business model is no longer sustainable. Operating challenges, rising operating costs, and deteriorating plant availability are creating a perfect storm that demands radical changes in the way the Power Utility manages its business operations and how it addresses the challenges (Figure 1). The South African environment and its challenges are not unique, as shown by the PWC survey on energy sector business models, which covered 53 utilities in 35 countries, and confirmed similar business environment triggers that initiate business model changes [5].
In its 2011 studies [1, 2], the World Energy Council echoes this view and defines the core '3 As' of future sustainability that are forcing utilities to evaluate their operations in the context of these sustainability measures, using the core business drivers of cost, efficiency, and safety:
• Accessibility to energy/electricity
• Availability of electricity/energy
• Acceptability of energy options offered
The World Energy Council summarises their evaluation of the changing energy environment with the comment: "Power Generators will need a PACKAGE OF MEASURES to deal with this scenario - single measures will no longer have the desired effect"[6]. At the heart of this package of measures is the ability to access the correct and most relevant business and plant process information to make the right decisions at the right time to improve business operations and efficiency.
Literature surveys show that business improvement initiatives, models, and approaches are generally focused on the improvement of business processes (core or underlying). The most notable and widely-used improvement framework is the ISO 9001 quality management system, supported by frameworks like Baldrige [7, 8, 9, 10] or the EFQM Framework [11, 12]. Because of their generic nature, they offer very little information or specifics about which methodology could be followed to improve business operations using plant information and data.
Similarly, information management business improvement models (BIMs) focus on the implementation of the required systems and governance to manage the information infrastructure [13, 14, 15]. In a web-based discussion [16] on this topic, Ledergerber confirms the researcher's view that the most commonly-used IT business improvement frameworks (TOGAF and COBiT) again focus on IT business processes, resulting in a focus on documenting processes rather than prescribing how to identify and deal with (and make decisions on) the actual data generated.
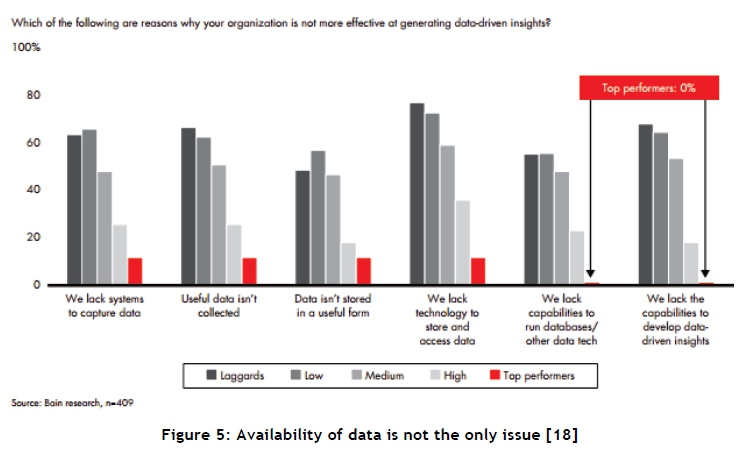
Gartner [17] predicts that about 70 per cent of the world's most profitable companies in 2015 will be using predictive analytics software extensively by 2020. But switching over to such technologies poses a major challenge: big data infrastructure differs fundamentally from conventional IT infrastructure in terms of system stability and network structures. Wegener and Sinha [18] confirm that top business performers have developed the required analytical models, and know exactly what data and information are important to develop the necessary decision-making algorithms.
2 A NEW BUSINESS IMPROVEMENT MODEL (BIM)
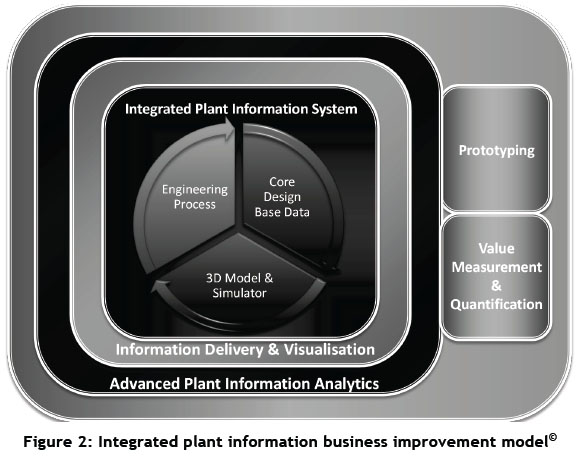
The research study (and this research paper) contributes to the engineering management body of knowledge by introducing a new integrated business improvement model (BIM) that has, at its heart, an integrated plant information (IPI) framework based on the plant design base. The integrated plant information business improvement model (IPI-BIM)© developed by the research study (Figure 2) was proven with operational research, prototyping, and hypothesis-testing over a number of years.
The research prototyping confirmed that developing and establishing an integrated and holistic plant information (IPI) system platform is a complex and time-consuming process. The implementation process is complicated in that business and plant control systems are generally managed in separate IT/IM infrastructures, with a difference in focus on the elements and content that makes up such an infrastructure. A further challenge is the data required to perform the required predictive analytics: it demands a solid, well-defined and documented plant design base, and data of the highest quality and integrity, to be of value. This data must also be correctly and aptly integrated with plant process control data.
This model differs from the two best-known business improvement framework models (Baldrige business model review framework [8] and the European Foundation for Quality Management (EFQM) excellence model review framework™ [12]) in that it does not focus on process, core values, or concepts as its foundation, but rather on integrated plant information and data as the foundation for business improvement in a process plant or utility.
In support of operational readiness, a value proposition cost model was developed based on the actual and potential cost savings and benefits of implementing the IPI-BIM. This cost model can be used for IPI-BIM model implementation and project costing and ROI calculations.
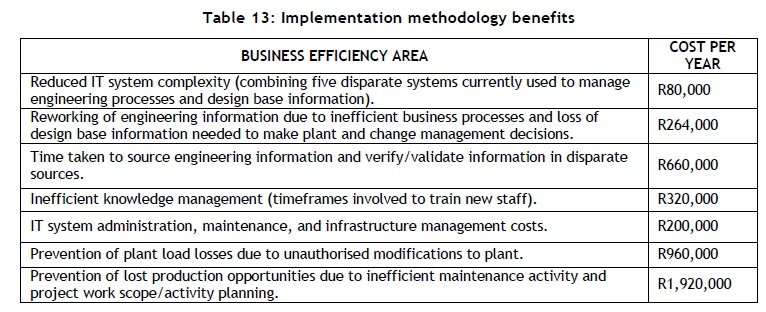
The operational readiness of this new BIM was determined by means of prototyping on a Brownfields utility power plant and Greenfields power plant project to confirm that it is sufficiently defined and developed to lay the plant information foundation framework for enhanced predictive plant condition analysis, simulations and future development of artificial intelligence algorithms. All the elements of the IPI-BIM framework were successfully implemented in the power stations that formed part of the research study (Figures 13 and 14). Implementation of the IPI-BIM elements could further be quantified in actual cost savings achieved, as shown in Table 13.
3 DEVELOPMENT PROCESS OF THE NEW BUSINESS IMPROVEMENT MODEL (BIM)
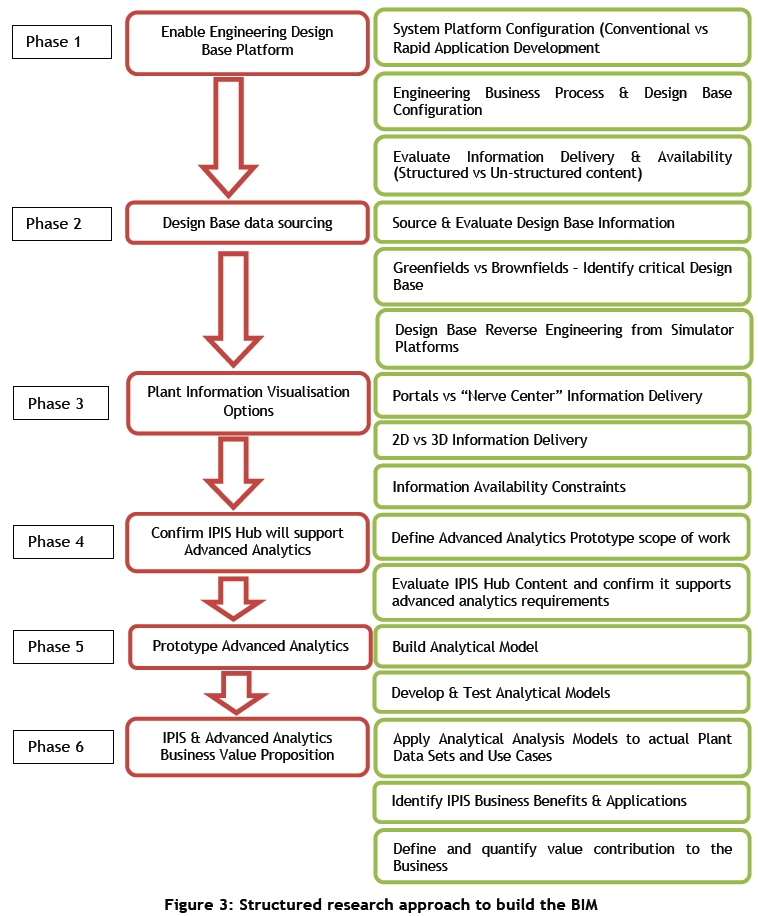
Due to the scope and complexity of the IPI-BIM, a phased, sequential and structured approach was taken in the research to develop and prove the model (Figure 3), its core elements, and the approach to establishing each element.
The V-Model of systems engineering [20] was used to evaluate the IPI-BIM elements and approaches proposed by the research. Each phase thus considered the V-Model elements of hypothesis creation, requirements definition, validation and verification, conceptual proof of concept, and optimisation/rationalisation of the IPI-BIM element(s).
4 IMPORTANCE OF PLANT DATA/INFORMATION FOR BUSINESS IMPROVEMENT INITIATIVES
KPMG conducted a survey [21] among large project owners, and reported that inadequate engineering design base and change control has a major impact on cost control and on the ability to complete projects timeously and efficiently. The IDC study [3] further highlighted the costs (obvious and hidden) of not being able to find or access the right information at the right time.
With current electricity supply constraints, there is a concerted effort by South Africa's power utility to improve its operations through two core output areas: improvement in business productivity and product output; and cost management. Underpinning this effort is an increased focus on the use and better understanding of business, plant, and engineering and technical plant information and data, and leveraging this to make better, more integrated, and more informed decisions on the plant.
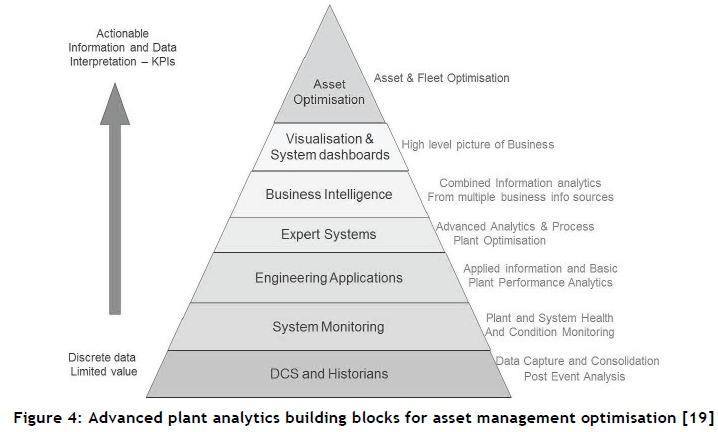
Figure 4 shows the logical information building blocks to build a Smart Utility IT/IM infrastructure [19]. It also shows the phased process of maturing plant process and engineering information in an asset-driven organisation, from discreet data to usable information and knowledge, and the importance of plant data in the decision-making processes.
Wegener and Sinha [18] aptly show with their survey that, in addition to the criticality of having access to data and information for decision-making, there are further dimensions that differentiate top-performing companies from their peers when it comes to data analytics. The researchers point out that top performers have developed the required analytical models, and know exactly what data and information are important to develop decision-making algorithms (Figure 5). Their industry survey of 409 companies shows that only 4 per cent of the participants had the right people, tools, data, and intent to draw meaningful insights and take action arising from that data.
According to Biehn [22], data scientists believe that as little as 5 per cent of the 'big data' gathered results in 95 per cent of the value contribution of the data. And herein lies one of the biggest challenges of data analytics: identifying, modelling and analysing the 5 per cent critical data effectively to improve business operations.
Many companies gather vast amounts of data, but rarely make the effort to analyse the data or even to ask the basic question: Why are they gathering the data? Although data storage costs have significantly reduced, the impact of analysing critical business and plant data when it is buried in 95 per cent of 'low-value data' has a significant impact on situational analysis capability and on response and decision times.
The research study demonstrated how a business improvement model, using plant data as its baseline to support smarter ways of work, is a very efficient catalyst to bring about:
• Improved plant reliability and availability.
• Pro-active fault prediction/identificati'on and incident prevention.
• Real-time effective decision-making, based on trustworthy plant and business information in a common information platform.
• Knowledge management (KM), improved training, and best practice information-sharing.
• Critical and scarce skills leverage.
• Enhanced operational and technical support.
• Improved asset management and planning.
5 DEVELOPING THE NEW BUSINESS IMPROVEMENT MODEL (IPI-BIM)
The BIM was developed in a sequential and structured way with an integrated plant information (IPI) system at its core, enabling advanced data analytics. Descriptive, predictive, and prescriptive analytics methods were used throughout the IPI-BIM development to achieve the end result, thus confirming the research theory postulated that a combination of analytical methods would be required to provide a holistic plant improvement framework (echoed by Lustig et al. in their research [23]). The process and scope of development of the main IPI-BIM elements are briefly discussed below.
5.1 Creating the integrated plant information (IPI) system for the IPI-BIM
A number of system implementation approaches are possible in commercially-available integrated engineering information management systems, ranging from 'out-of-the-box' (OOTB; pre-configured) systems at one end of the spectrum to highly-configurable ones at the other end.
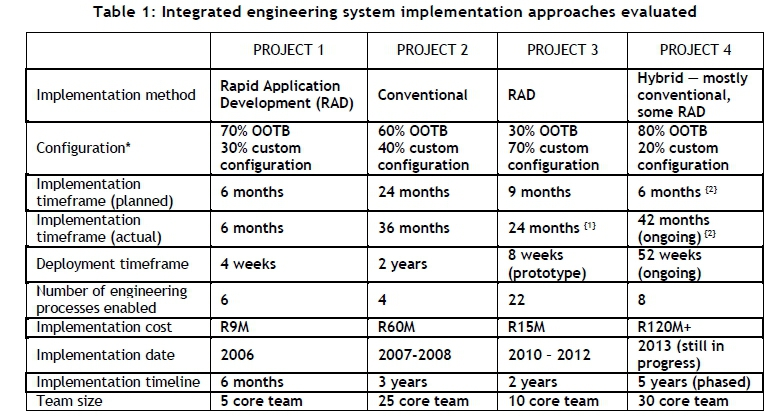
The research study evaluated the results and outcomes of four different implementation methodologies over a period of five years to characterise the successes and challenges of each (Table 1).
Active research involvement in the prototyping and execution of Project 3 in Table 2 led to a research hypothesis that it defines the most viable and cost-efficient method of IPI system implementation execution. The approach in Project 3 was based on the IT rapid application development (RAD) methodology [24] where the required engineering design base and the related process framework are developed and implemented in a rapid fashion with a very small team of highly-skilled individuals from the required disciplines and process and systems engineering backgrounds.
Based on the successes of Project 3, the research study used the same approach and developed a templatised and standardised software system implementation methodology to establish the integrated plant information (IPI) platform that will support the smart utility strategy [19] and proposed BIM (IPI-BIM), independent of any commercial system configuration requirements or constraints.
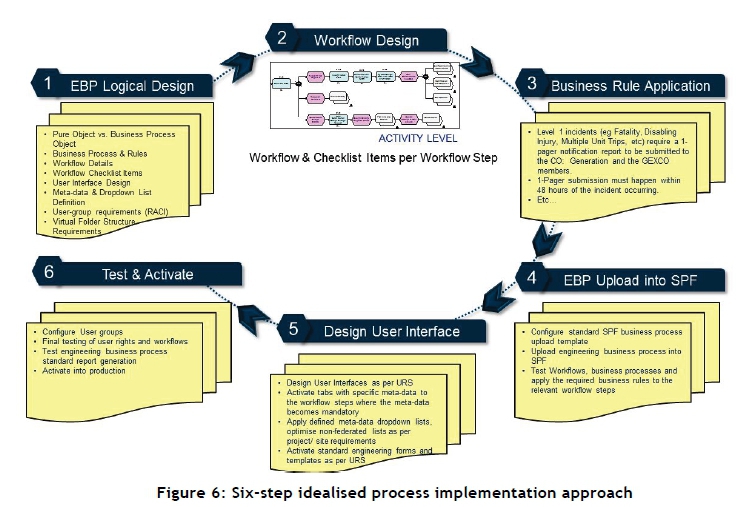
A six-step implementation approach was developed (Figure 6). It covers a business process logical design to align the business process with software system configuration requirements (Step 1). It then designs the required workflow to manage the engineering business process and engineering data generated (Step 2).
The process workflow is then subjected to the required business rules (Step 3), after which the system 'template' with the content from Steps 1-3 is uploaded into the integrated engineering system platform (Step 4). A user interface (UI) will then be designed, and is dependent on the engineering system capabilities and user requirements (Step 5).
The capability will then be tested, activated, and made available for business use (Step 6).
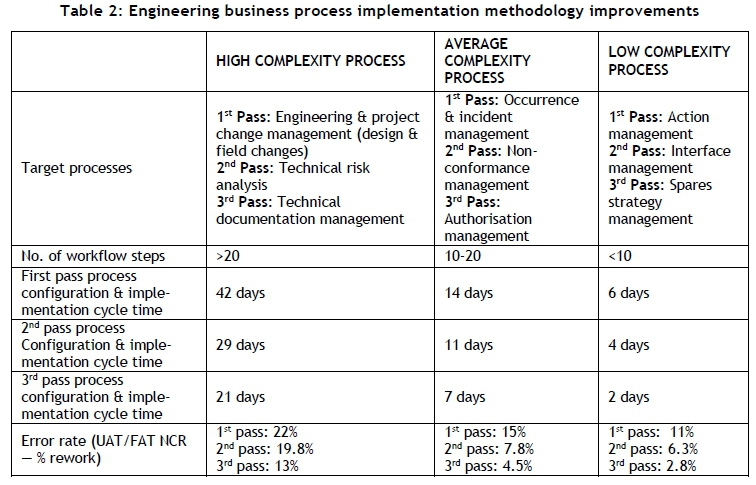
The proposed system implementation methodology was tested and validated against engineering business processes of varying complexity. The results of this evaluation are shown in Table 2.
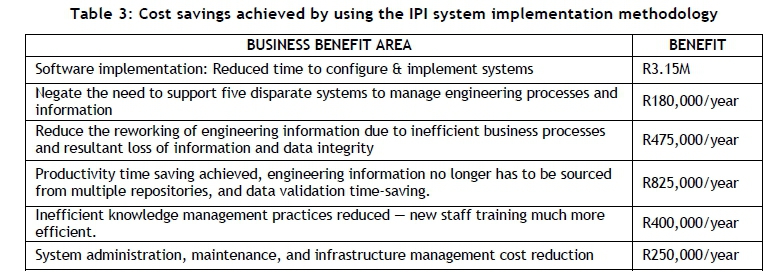
The testing and validation of the newly-developed implementation methodology demonstrated how the structured and templatised approach proposed by the research significantly reduced business process implementation cycle times - as would be expected from any proposed RAD methodology. Table 3 shows the research study's actual cost savings achieved on the Brownfields plant by implementing an integrated plant information management system platform.
5.2 Defining an appropriate design base for IPI-BIM information system content population
To establish the appropriate design base definition for the IPI-BIM, research was conducted in two phases. Phase 1 entailed the classification and validation of existing design base content, and implementing a rule-validation capability using data-mining techniques to automate the process of IEC document class assignment.
The IEC 61355 document classification framework [25] defines a significant group of potential document types that can make up the plant design base. Using this structured design base artefact classification system allowed the researcher to identify potential areas of missing design base content that might have to be reverse engineered.
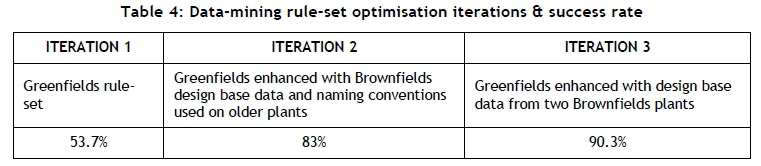
Table 4 summarises how the IEC document class assignment timeframe and success rate was improved using comparative data validation and three 'rule-enhancement' iterations of the automated data-mining tool developed by the research study.
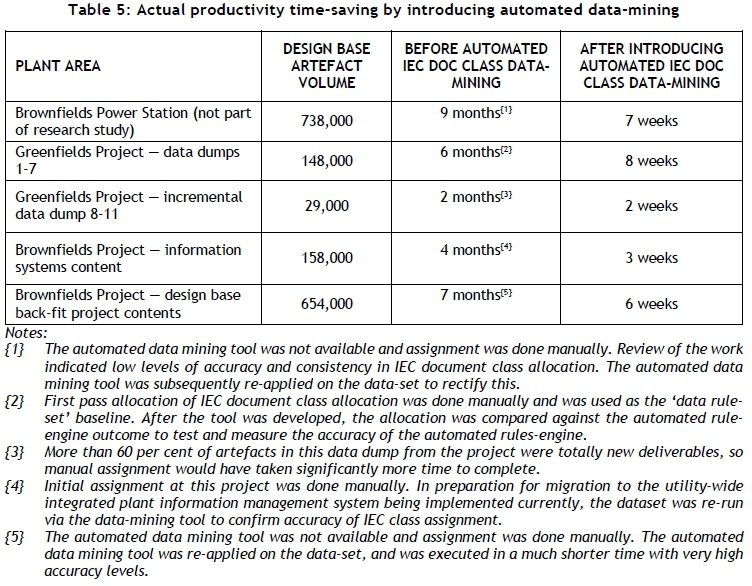
Table 5 indicates the productivity and cost-saving achieved on plants in the power utility where the automated data-mining tool, developed by the research study, was implemented. The assignment of the classes is generally done by experienced, technically-qualified staff with expertise in the IEC documentation classification system. Automation significantly reduced the time spent by these scarce and costly resources to do the design base classification.
A comparative validation of the design base content classification between the two power utility plants confirmed a similar distribution of documents within the key engineering disciplines. From initial research it became evident that, although an ideal (total) design base can be defined, the chances of sourcing all this information on a Brownfields plant utility that was designed, built, and commissioned before the electronic information era are very slim. It even proved problematic on the Greenfields project due to the insufficient level of specifications for data and information supply.
This finding led the research to undertake a further scope of work (as Phase 2) to define the core design base elements that would make up the critical plant design base for a Brownfields power utility generating plant. The benefits of narrowing the initial design base scope down to core elements only are that it would:
• Minimise the engineering effort of data-sourcing and migration required to populate the proposed IPI system with plant design base information.
• Reduce the cost of the validation and verification (V&V) of the migrated design base content, as this activity would then focus only on core design base content.
• Define and confirm the minimum design base information dataset required to perform advanced analytics, and set the scene for advanced analytics and future AI development.
• Improve the value proposition of establishing the IPI-BIM system platform by reducing the time, cost, and effort involved to source and migrate core design base content.
Following further research literature surveys, as well as information availability evaluations in collaboration with power utility C&I design engineers, it was hypothesised that the design base elements and content needed for a full plant C&I control system refurbishment would be the closest definition of what information could be deemed core plant design base content for effective plant asset management. As the research and IPI-BIM development scope included advanced analytics prototyping using this core design base content, it would confirm whether a sufficient design base was established using this approach (thus becoming the V&V mechanism for the core design base definition).
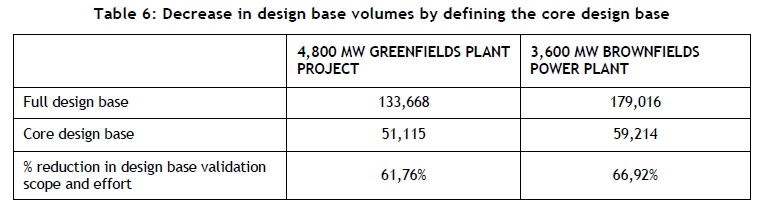
Table 6 reflects the difference in volumes between the full design base vs the core design base proposed by the research study.
Where a need for reverse-engineering of design base content candidate(s) was identified, Phase 2 of the research included a process to reverse-engineer this data and plant process content from the plant control systems, operating simulator, and engineering simulator capabilities. A process of three-way validation and verification between the systems was used to confirm that reverseengineering data outcomes were correct.
A typical example of this research study scope of work was the development, sourcing, and verification of the Brownfields power station Rankine cycle information. Plant process criteria captured in the Rankine cycle would typically define key and critical plant performance parameters within the operating design base envelope, and would reflect the impact of changes to operating criteria and plant process conditions in the most significant way.
5.3 Enabling the visualisation and information delivery capability of the IPI-BIM
The industry survey and related research by Pennwell [26] shows how information management challenges and business drivers are pushing the energy industry (and by implication, all process plant industries) to look at more integrated and trustworthy information delivery options and solutions. Sixty-eight per cent of survey respondents were either evaluating or implementing more effective enterprise content management (ECM) solutions to solve the challenges of managing information for engineering, capital projects, and asset management.
Using research, IT architecture review and analysis, and existing capability evaluations, the study proposed the development and prototyping of a portal-based integrated plant information system to resolve information delivery requirements of the power utility's Smart Utility strategy [19].
The research study postulated that a combination of visual (interactive 3D) and conventional 2D hierarchical data display methods would enable the preferred method of engineering technical data delivery in an integrated engineering information environment.
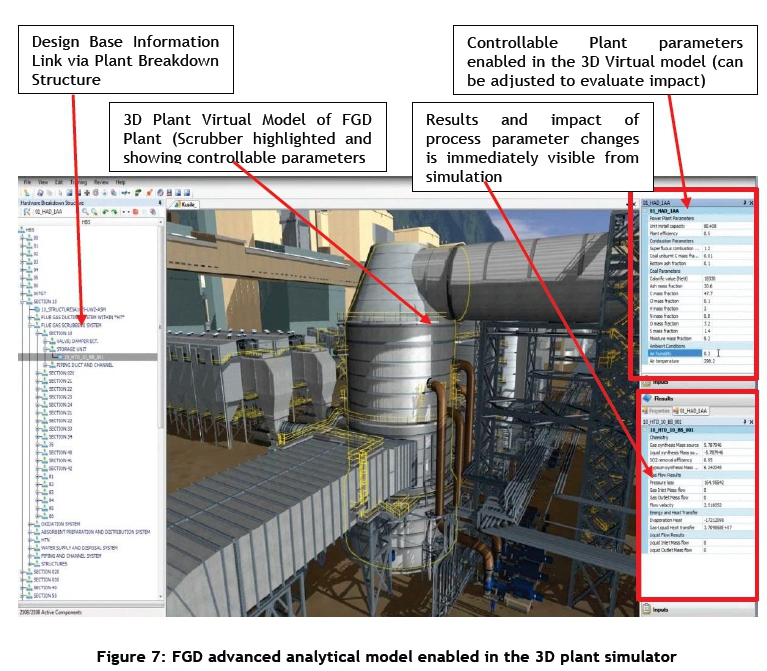
A proof-of-concept 'Smart Utility' information portal was configured and developed during the research study. The research study then proceeded to demonstrate how design base content, interactive 3D visualisation capability, and advanced analytics capability could be enabled in one common portal-based user interface (Figure 7).
The capability developed by the research study and shown in Figure 7 is scheduled for deployment in the Greenfields project power station as soon as it goes into commercial operation.
In addition to enabling and demonstrating the core information delivery framework for the IPI-BIM, the research study also integrated process plant design base criteria such as alarm settings and control limits into the portal to flag operations and business decision-makers when plant processes are not available or are operating outside of acceptable design base parameters.
Research on this element of the IPI-BIM was concluded by an evaluation of the portal prototype outcome against the 'nerve centre' information delivery option (as the potential alternative to a portal). The evaluation confirmed that the cost, time of deployment, and user-friendliness of portal technology makes it the preferred option.
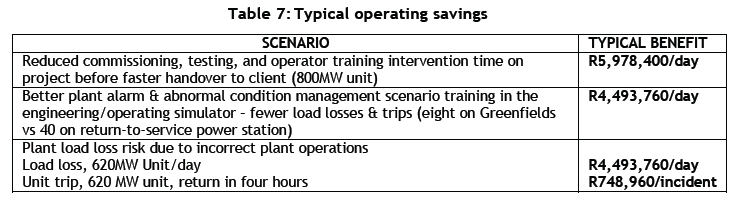
The 3D virtual simulator capability developed by the research study was deployed on the Greenfields project for operator training nine months before the unit was commissioned. This enabled much better operator training to handle the plant commissioning, start-up, alarm, and abnormal condition management. Table 7 shows typical cost savings achieved by improved operator training methods using the integrated design base information and visualisation platform.
The commercialisation of the first Greenfields project generating unit was executed with minimal trips (eight documented trips due to operator error). When compared with a previous return-to-service (RTS) project, the trips during commissioning for this RTS plant exceeded 40 for the same time period. This plant did not have the benefit of the virtual plant model and virtual training simulator, nor the benefit of a defined and well-managed design base in an integrated plant information management system.
The benefits of using portal technology as listed in research from Wheeler [27] were confirmed by the SmartPortal prototype that demonstrated the efficient sharing of core business information in a common information platform that is easily customisable, supports collaboration, consolidates information infrastructure requirements, and is more user-friendly and intuitive.
The SmartPortal prototype was conducted, concluded, and demonstrated to business stakeholders in less than three weeks. The plant visualisation capability and on-line plant state monitoring of materials handling systems were done in two weeks, and the capability is available and in use at the research study Brownfields plant. The nerve centre project is still in project justification phase. The outcome from the research prototype was demonstrated to stakeholders in the power utility, when it was agreed that this research work would form the baseline framework for the SmartPortal capability to be developed in the power utility.
5.4 Enabling the advanced analytics IPI-BIM capability
A study by the Energy Central organisation in global power utilities in 2006 [28] has indicated that significant gaps were identified in managing the human capital of technical and complex business organisations. The study emphasises the need to address skills losses and having improved automation and control system intelligence to assist with knowledge transfer and managing complex process plants.
An Emerson study [29] further points out that overwhelmed operators and complex plant operations are some of the biggest challenges for process plant reliability and control, and that these require a new approach to managing plant process and controlling information more efficiently and predictably. The challenge of effective alarm management and the mass of control data generated in upset conditions (and the impact they have on the operator) is confirmed by EEMUA research and recommendations about alarm management [30].
The research study postulated that developing an IPI-BIM framework with advanced analytics and simulation capability as one of its core elements would enable a power utility or process plant to deal with the challenges identified above.
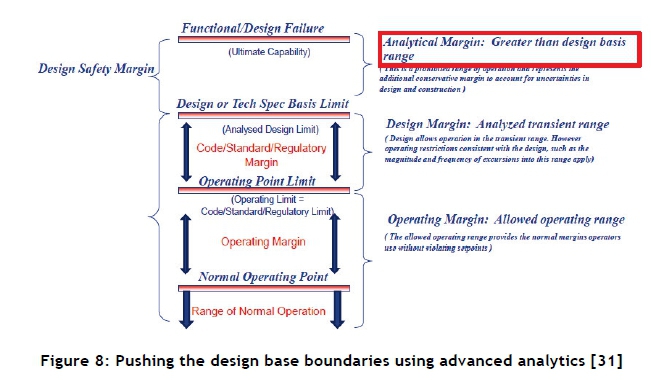
The inclusion of advanced analytics and simulation capability as part of the IPI-BIM framework will enable plant operating and process control hypothesis-testing as a core business improvement capability. It can typically enable simulated testing of impacts and risks in operating the plant beyond the currently known design basis limits, as indicated by Parlour [31] in Figure 8.
This is a view supported by Liptăk [32], who suggests that process constraints can potentially be modulated to increase production output using advanced simulation and process plant hypothesistesting, allowing plant to be operated in the analytical margin space (indicated in Figure 8). This becomes a viable improvement option in process plants where very large design safety margins have been introduced due to very conservative design approaches.
A major benefit of virtual simulation and advanced analytics capability is that it allows for the simulation of diverse and complex plant process condition changes and impact evaluation in a virtual plant environment. It thus removes the risk of straining the actual process plant to test hypothesised design base change models.
From research, it is believed that Angeli [33] most aptly describes the basic research methodology elements used to define and test the advanced analytics capability element of the IPI-BIM framework. It describes a very holistic approach to defining and building advanced analytical models. Research indicates that this model has been used successfully in the power utility Brownfields plant that forms part of this research study, specifically to evaluate and optimise the design base operating philosophy for the flue gas control system.
Analytical fault models were developed for this plant area that use both analytical and heuristic elements, as indicated by Angeli's Model [33]. The two examples below indicate typical research outcomes and results achieved.
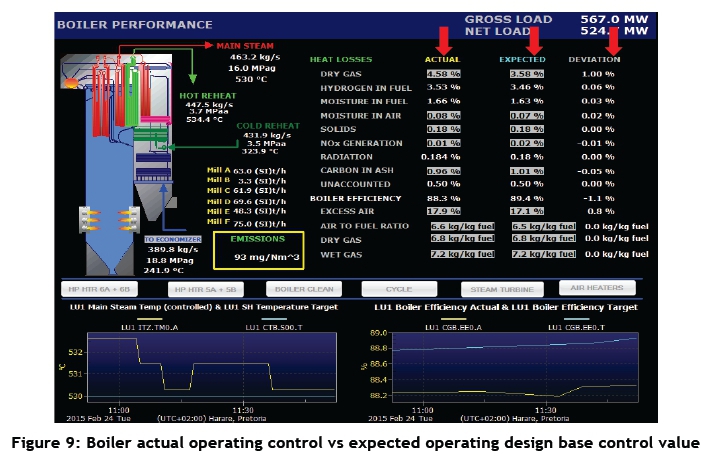
Example 1: Evaluation of actual plant process control data against the defined plant operating design base to identify unacceptable process control deviations. Figure 9 shows an example of how the performance was compared and trended in the boiler system area to identify areas where operating staff did not maintain controllable parameters within the desired operational design base. An acceptable percentage deviation per controllable parameter is defined, and flags the operator once the deviation exceeds allowable limits. Continuous parameter trending fields are indicated by the red arrows in Figure 9.
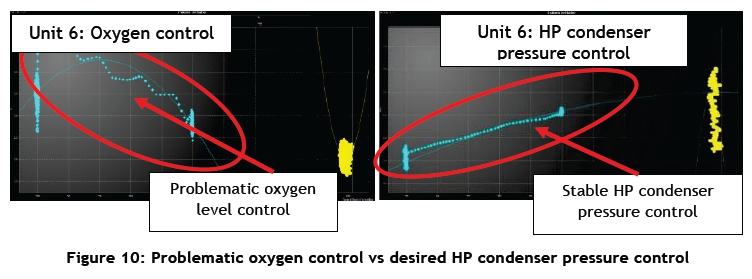
Figure 10 demonstrates how the research study used advanced analytics and operational control curve data trending and analytics to identify areas of inefficient plant control. The example demonstrates how oxygen control is more problematic during ramp-up conditions, with the operator required to intervene regularly to adjust actual oxygen levels to desired control curve levels.
In contrast, the HP condenser pressure was much better controlled, and kept in close alignment with the desired control curve. The research helped plant operators to identify this problem area, and resulted in enhanced training interventions on how to deal with these plant behaviour and control conditions.
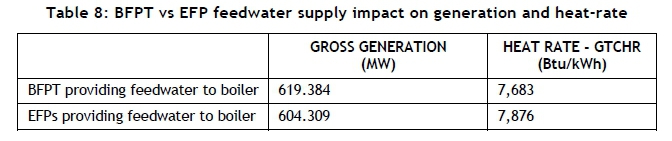
Example 2: The research evaluated the impact of using the two electric feed pumps for feed water supply (normally reserved for standby/emergency purposes). This would be contrary to the ideal design base scenario of using the steam-turbine feed pump for normal operations. Furthermore, the original plant design base was the use of steam-driven feed pumps (SFPs) for both normal and standby duty; but the final implemented design configuration was one steam-turbine-driven feed pump with two electrically-driven feed pumps as a back-up in emergencies, should the main pump not be available.
The impact of this decision on available output generation and GTCHR is significant: higher fuel consumption to generate the same output as a steam feed pump would have required 20 MW less power output to the power utility transmission grid (Table 8). Twenty This equates to R144,960 a day and R52,9M a year. It demonstrates the importance of operating plant at ideal design base conditions, and the need to minimise deviations from expected performance or designed operating envelopes.
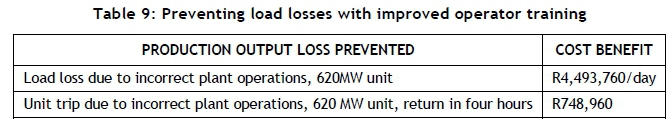
By identifying these plant control areas of improvement, the research study collaborated with the site simulator operator training group to address these issues. This has resulted in the prevention of at least two load loss incidents due to incorrect oxygen level control, and timeous correction by the operator of the plant condition (Table 9).
The research study demonstrated the importance of accurate and detailed FMECA and fault analytics data to identify problem plant areas and develop fault models. By developing comparative controllable parameter models (design base vs actual) the research study demonstrated how performance could be trended and remedial action could be taken more timeously to improve plant process operations. An increased focus on plant health conditions and better operating of the plant has increased the station's efficiency from 74.6 per cent to 84.6 per cent over the past three years.
Using the principles of Angeli's model [33], the research study proceeded to demonstrate, with predictive and prescriptive analytics methods, how advanced analytics software, process simulation, and fault models can be used to:
• Measure efficiency of current operating practices against operating design base.
• Demonstrate that improved early warning failure detection is possible using big data analytics and methodology to analyse plant operating and control data.
• Measure efficiency of operations during upset and test conditions of the process plant.
5.5 Justifying the IPI-BIM benefits via a value proposition model
Research by Emerson [34] shows that improved information management of the operating design base, integration of this information asset with plant process control data, and using it for daily operations, produce significant savings from a productivity and economic benefit point of view. Chevron [35] expresses similar sentiments - that the value proposition can be found in improved asset management, design, and construction capability. Further value is found in safer operations practices and improvements in plant reliability and efficiency.
Emerson [34] reports that similar savings can be achieved by implementing an integrated information management system and combining it with improved plant control and process monitoring and advanced analytics capability. Their reported savings are based on feedback from clients who implemented their IPI system technology and quantified the return on investment.
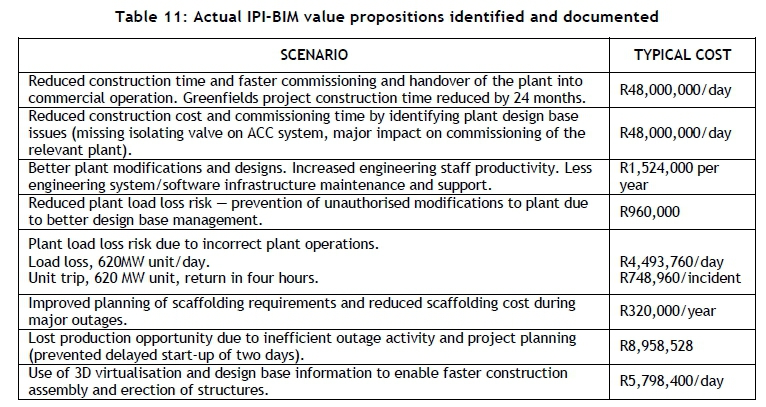
Given the reported cost savings identified by the research literature survey, it was hypothesised that the IPI-BIM approach developed and prototyped by the research study could yield the same benefit - and even more. Contrary to other business improvement models, the value proposition model forms part of the overall IPI-BIM model. Typical scenarios considered in the development of the value proposition model covered aspects such as improved and optimised operator training and inspections, improved safety training and job safety analysis, improved outage planning, improved construction and commissioning efficiencies, and numerous other potential benefit areas.
The research evaluated scenarios that occurred at the Brownfields plant or were documented in plants of similar size and construction in the power utility fleet. For commissioning-related cost savings, the Greenfields plant's operational capacity and construction cost history were used. Actual cost and impact scenarios from the new build programme were used for cost definition and quantification.
The IPI-BIM cost model introduced common adjustable variables and a 'cost saving probability factor'. A massive (and potentially unrealistic) value proposition is possible if the 'worst case scenario' for each proposed scenario is considered and used. By implementing a probability factor, the benefit value (or 'saving') can be reduced to more realistic values.
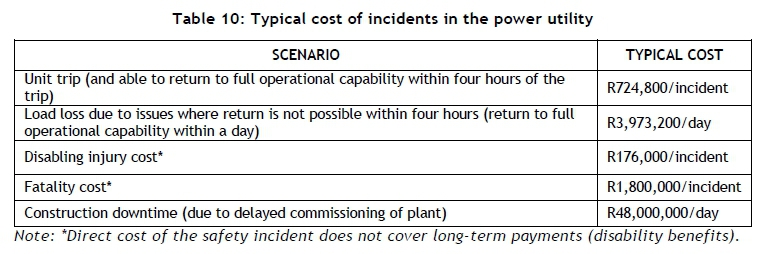
Table 10 demonstrates the typical cost of plant and human-related incidents in a power utility plant that can usually be prevented by business improvement and optimisation initiatives. Outcomes such as improved and integrated design base management, improved knowledge management and plant reliability, and availability improvement using the IPI-BIM advanced analytics and simulation elements, can reduce or prevent these types of incidents, and in effect create a compelling case for implementing the IPI-BIM.
By developing an adjustable cost model with variable inputs, flexibility is provided to other utilities or process plant owners who would like to use this model, as it allows for adjustments (where needed) that reflect their specific plant history and its environmental and socio-economic conditions.
5.6 Operationalising the IPI-BIM
A primary hypothesis of the research study was that taking a structured and phased approach to developing and enabling the IPI-BIM elements is the most efficient, cost-effective, and ultimately viable approach to building such a complex model and implementation approach. Although the phased approach enabled a critical evaluation of each individual element of the proposed BIM, the holistic model had to be proven as a whole in order for the IPI-BIM to be considered a workable business improvement model.
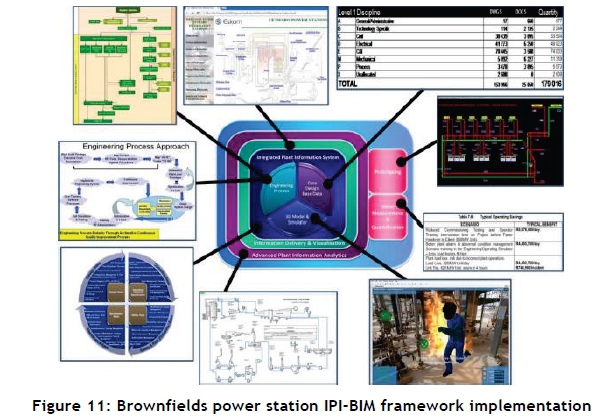
Ultimate confirmation of the operational readiness of the IPI-BIM framework and implementation approach was to demonstrate its ability to implement all its elements in a POWER UTILITY PLANT/PROCESS PLANT successfully, and to evaluate its success by documenting actual value proposition scenarios achieved by implementing the model. Figures 11 and 12 show the scope of the IPI-BIM elements deployed as a holistic solution for the research study power stations. For the two power stations that form part of the research study, the IPI-BIM elements are either in the process of being fully implemented (if the research study only conducted a prototype to prove the concept) or were implemented as a final IPI-BIM framework validation and verification.
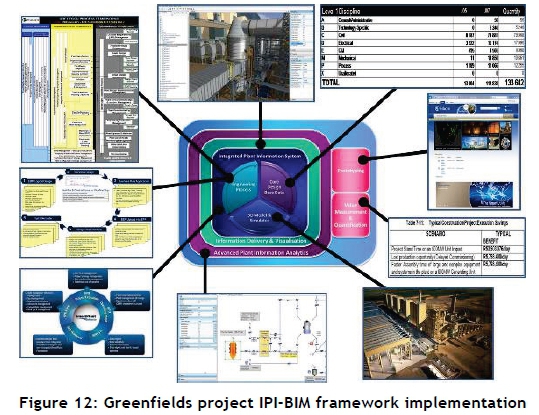
Table 11 depicts typical cost savings identified and recorded as part of the process of implementing the framework and documenting the value proposition of using the IPI-BIM framework and implementation approaches.
6 CONCLUSION
This research study significantly adds to the engineering management body of knowledge on business improvement models, in that it has defined an integrated plant information-based BIM model and approach that is measurable in real business (and monetary) value. The use of prototyping and testing of the IPI-BIM model in an operational process plant/utility environment has confirmed that it can be practically executed and can yield notable business value.
6.1 IPI system implementation methodology
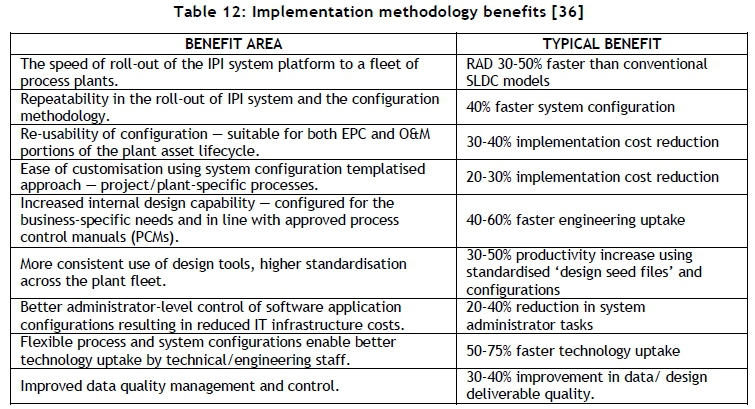
The research study findings showed how the software system implementation methodology and approach can have a major impact on the cost and timelines involved in implementing the IPI system that supports the overall IPI-BIM framework. Table 12 shows typical benefits reported from implementing the templatised methodology proposed in the research study.
6.2 Core design base content required enabling the IPI-BIM
The hypothesis posed about C&I control system upgrade requirements making up core design base content proved to be an accurate, feasible and cost-effective solution. By documenting and confirming the core design base needed for effective asset management and advanced analytics enablement, the scope of validation and verification can be reduced by up to 66 per cent. This results in significant savings of engineering resource time and cost to validate these design base artefacts.
The core design base content could be sourced with relative ease in the cases of both the Greenfields and the Brownfields plant cases; and where it could not be sourced, sufficient alternative information was available to reverse-engineer and/or re-build the missing information.
6.3 IPI-BIM information delivery capability
The research and associated prototype confirmed portal technology to be the ideal information delivery platform. The research prototype demonstrated that information delivery via portal technology can be enabled very fast, efficiently, and effectively. Given the extensive cost of enabling a location-based 'nerve centre' capability, this project is still at proof-of-concept/ concept design phase, while the portal prototype was conducted, concluded, and demonstrated to business stakeholders in less than three weeks.
6.4 IPI-BIM advanced analytics and simulation capability
The advanced analytics model of the Brownfields plant Rankine cycle and the outcomes achieved running analytical scenarios on it created a useful plant performance management and monitoring capability. This reverse-engineered and developed plant operating curve and analytical models could be used with confidence for further analytics and measurement of plant reliability and availability. Research prototyping confirmed the major value propositions that advanced monitoring/trending capability in the IPI-BIM model research brings. The most notable of these are:
• Increased visibility of plant performance and identification of plant problem areas.
• Increased understanding of plant behaviour in upset conditions, and the impact of this on plant output and reliability.
• Online and continuous monitoring of performance against design base values.
• Timeous intervention where performance deviations from the plant design base parameters are identified (actual vs target/expected values).
• Increased usage (and thus better ROI) for the existing advanced analytics software investments in the Utility.
6.5 The IPI-BIM value proposition
The best validation method for any business improvement model is its practical implementation in an operational environment, and quantification of its value to the business in productivity/ efficiency improvement measures and monetary value.
Although each element of the BIM in this research study was proven individually, all the elements were successfully combined and implemented, as indicated in Figures 11 and 12.
Table 13 demonstrates the typical business efficiencies and cost savings achieved in implementing the integrated plant information system platform by using the system implementation methodology developed in the IPI-BIM (with a total saving of R4,4M per year on the Brownfields power station used in the research study).
In closing, it can be stated that the proposed IPI-BIM is an operationally-ready business improvement model that has been proved through operational research and prototyping. It is, however, a complex undertaking, and the effort required to fully establish this framework should not be under-estimated. Due to the generic nature of the IPI-BIM and its approach, its application extends beyond the power utility space, and is applicable to most process plant industries.
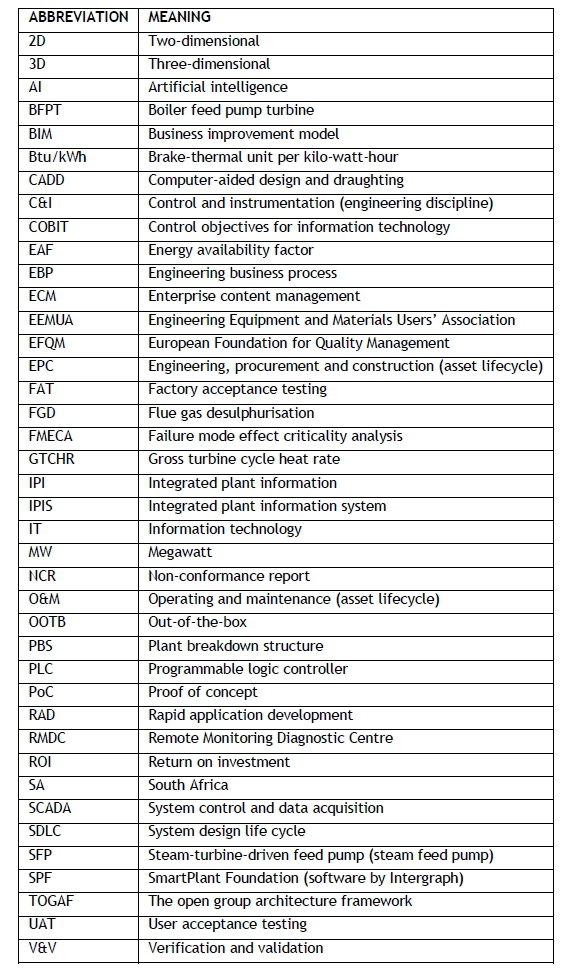
ABBREVIATIONS USED
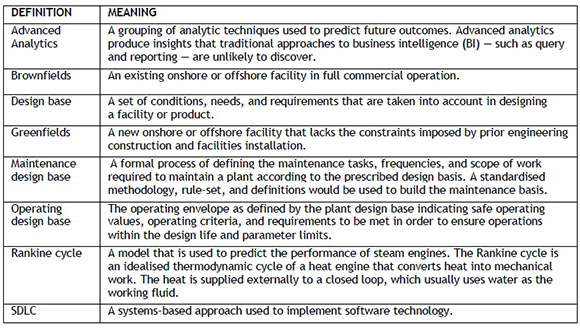
DEFINITIONS USED
REFERENCES
[1] Bang, G. 2010. World Energy Council: Pursuing Sustainability: 2010 Assessment of country energy and climate policies. World Energy Council. [ Links ]
[2] Jain, C.P. 2007. World Energy Council: Deciding the Future: Energy Policy Scenarios to 2050 - Results of Analysis. World Energy Council. September 2007. [ Links ]
[3] Feldman, S. and Sherman, C. 2001. The high cost of not finding information - An IDC White Paper. July 2001. [ Links ]
[4] Jones, L. 2015. Eskom's evolving business model - Smart grid forum presentation. Eskom Holdings. Presentation given in July 2015. [ Links ]
[5] Schwieters, N., Van Hoof, J., Etheridge, D. and Hatop, O. 2015. A different energy future. Where energy transformation is leading us. 14th PWC Global Power & Utilities Survey. PWC Global Power & Utilities Division. www.pwc.com/utilities. [ Links ]
[6] Wyman, O. 2010. Pursuing sustainability: 2010 assessment of country energy and climate policies. World Energy Council. The United Kingdom. [ Links ]
[7] Greaves, T. and Hohner, L.N. 2009. 3D laser scanning: Benefits and paybacks for industrial plant design, construction, and operation. Spar Point Research. Faro Corporation. [ Links ]
[8] National Institute of Standards and Technology. 2015. 2015-16 Baldrige Excellence Framework. US Department of Commerce (www.nist.gov). Information retrieved on 22 January 2015 [ Links ]
[9] National Institute of Standards and Technology. 2015. Baldrige Excellence Builder: Key questions for improving your organization's performance. US Department of Commerce. (www.nist.gov) Information retrieved in January 2015. [ Links ]
[10] Tanner, S. and Bailey, M. 2014. The business improvement handbook - From ISO 9001 to world-class performance. 4th edition. British Standards Institution. [ Links ]
[11] Du Plooy, D. 2013. Innovation in capital power projects development. Eskom Holdings (Pty) Ltd. Conference presentation made on 29 May 2013. [ Links ]
[12] Van Rompuy, H. 2012. An overview of the EFQM excellence model. European Foundation for Quality Management. Belgium. [ Links ]
[13] Bell, C. 2015. Finding value with information management. Univeristy of Waterloo. 17 June 2015. [ Links ]
[14] Data Management Association. DAMA International website - www.dama.org. [ Links ]
[15] Socha, G. and Gelbmann, T. 2016. Information governance reference model. Creating practical resources to improve e-discovery & information governance. EDRM LLC. (www.edrm.net) [ Links ]
[16] Ledergerber, M. 2012. Information governance reference model (IGRM). EDRM Web Discussion - Creating practical resources to improve e-discovery & information governance. Web-discussion information retrieved on 6 December 2012. [ Links ]
[17] Gartner. 2015. Top 10 strategic predictions for 2015 and beyond: Digital business is driving 'big change'. Published on 10 June 2015. [ Links ]
[18] Wegener, R. and Sinha, V. 2013. The value of big data: How analytics differentiates winners. Bain & Company. Atlanta. [ Links ]
[19] Hales, K. 2013. Eskom's Smart Strategy. Eskom Holdings (Pty) Ltd. [ Links ]
[20] Federal Highway Administration (FHWA). 2005. Clarus concept of operations: V-Model (software development) description. FHWA Publication No. FHWA-JPO-05-072 (Sourced via Wikipedia in November 2014). [ Links ]
[21] KPMG. 2009. Global Projects Owners Survey. Published by Klynveld Peat Marwick Goerdeler (KPMG), Global MPA Survey 2008. January 2009. [ Links ]
[22] Biehn, N. 2013. The missing V's in big data: Viability and value. PROS. www.wired.com/insights. May 2013. [ Links ]
[23] Lustig, I., Dietrich, B., Johnson, C. and Dziekan, C. 2010. The analytics journey. Institute for Operations Research and the Management Sciences. [ Links ]
[24] Koredla, C. 2014. Rapid application development (RAD) / Prototyping life cycle. www.dieharddeveloper.blogspot.co.za. 17 June 2014. [ Links ]
[25] International Electricity Commission. 1997. IEC 61355: Classification and designation of documents for plants, systems and equipment. Available from www.iec.com. [ Links ]
[26] PennEnergy and OpenText Corporation. 2012. White Paper: Information challenges in capital projects and enterprise asset management. Published by Open Text Corporation on www.opentext.com, February 2012. [ Links ]
[27] Wheeler, A. 2012. Benefits of using Microsoft Sharepoint. Phoenix-TS - TechRoots: Sourcing Your tech perspective. Sourced from www.phoenixts.com. _7 September 2012. [ Links ]
[28] Causey, W. 2006. The high cost of losing intellectual capital. Energy Central Research and Analysis Division. Energy Central. May 2006. [ Links ]
[29] Emerson. 2003. White Paper: Reducing operations & maintenance costs. Published by Emerson Process Management on www.PlantWeb.com, September 2003. [ Links ]
[30] Mayssat, R.E. 2009. Alarm management standards - Are you taking them seriously? LinkedIn Slideshare Article. Honeywell Advanced Solutions - White Paper. [ Links ]
[31] Parlour, J. 2007. A brief history of configuration management in the nuclear industry and the CMBG. Presentation made to Configuration Management Benchmarking Group Steering Committee. 20 June 1997. [ Links ]
[32] Lipták, B. 2006. Artificial intelligence in process automation. Just how smart will controller intelligence get? Published on 06 November 2006. Retrieved from website http://www.controlglobal.com/articles/2006/221/. [ Links ]
[33] Angeli, C. 2004. On-line fault detection techniques for technical systems: A survey. Department of Mathematics and Computer Science, Greece. Technomathematics Research Foundation. [ Links ]
[34] Emerson Process Management. 2003. White Paper: Reducing operations & maintenance costs. Austin Texas. Published on www.EmersonProcess.com in September 2003. [ Links ]
[35] Watson, J. 2010. Operational excellence management system - An overview of the OEMS. Chevron, San Ramon. [ Links ]
[36] Swanepoel, H.F. 2010. Eskom's fast tracked implementation of SPE 2009 as the common engineering system platform in a center-led engineering framework. International Intergraph Conference. Eskom Holdings (Pty) Ltd. 05 May 2010. [ Links ]
Available online 11 Nov 2016
Presented at the 27 annual conference of the Southern African Institute for Industrial Engineering (SAIIE), held from 27-29 October 2016 at Stonehenge in Africa, North West, South Africa.
* Corresponding author swanephf@eskom.co.za
# The author was enrolled for a PhD (Mechanical) degree in the Department of Engineering Management, North West University, South Africa.

