


Serviços Personalizados
Artigo
 Inglês (pdf)
 Artigo em XML
 Referências do artigo
Indicadores

Links relacionados
-
 Citado por Google
 -
 Similares em Google
Compartilhar

 Permalink
South African Journal of Industrial Engineering
versão On-line ISSN 2224-7890
versão impressa ISSN 1012-277X
S. Afr. J. Ind. Eng. vol.27 no.3 Pretoria Nov. 2016
http://dx.doi.org/10.7166/27-3-1657
GENERAL ARTICLES
Methodology to produce a Water and Energy Stream Map (WESM) in the South African manufacturing industry
E. Davies#; K.R. van der Merwe*
Department of Industrial Engineering, Nelson Mandela Metropolitan University, South Africa
ABSTRACT
The increasing demand for water and energy in South Africa, and the capacity constraints and restrictions of both resources, have led to a rapid increase in their cost. The manufacturing industry remains South Africa's third-largest consumer of water and second-largest consumer of national energy. The improvement of water and energy efficiency is becoming an increasingly important theme for both organisational success and national economic sustainability. This paper presents the 'lean based water and energy stream mapping framework' developed for the manufacturing industry, with the specific objective of decreasing its water and energy intensity. As with the traditional value stream mapping tool, the water and energy stream mapping focuses on eliminating water- and energy-specific wastes within a process. Water and energy waste categories that will be used in conjunction with the framework will also be discussed. The key objective of this paper is to detail the process of creating the water and energy stream mapping, and the statistical forecasting methodology used to develop the baseline water and energy demand data. The outcome of the implementation of the framework is the future state water and energy stream mapping, which is effectively a blueprint for increased water and energy efficiency within a studied process.
OPSOMMING
Die toenemende vraag, kapasiteit en hulpbron beperkings het gelei tot die styging van water en energie koste in Suid-Afrika. Die Suid-Afrikaanse vervaardigingsbedryf bly die derde grootste verbruiker van water en die tweede grootste verbruiker van energie in terme van nasionale verbruik. Die verbetering van water en energie doeltreffendheid word al hoe meer belangrik vir beide organisasie sukses en nasionale ekonomiese volhoubaarheid. Hierdie artikel verteenwoordig die lenige water- en energiestroom kartering-raamwerk wat ontwikkel is vir die vervaardigings bedryf met die spesifieke doel om water en energie intensiteit te verlaag. Soos met die tradisionele waardestroomkarteringinstrument, fokus die water- en energiestroom kartering op die uitskakeling van spesifieke vermorsing van water en energie binne 'n proses. Water en energie vermorsing kategorieë wat gebruik gaan word in samewerking met die raamwerk word ook bespreek. Die hoofdoel van hierdie artikel is om besonderhede oor die proses van die skep van die water- en energiestroom kartering te beskryf, sowel as die statistiese vooruitskatting metodologie wat gebruik is om die basislyn water en energie vraag data vas te stel. Die uitkoms van die implementering van die raamwerk is die toekomstige staat water- en energiestroom kartering, wat effektief 'n bloudruk is vir hoër water en energie doeltreffendheid binne 'n bestudeerde proses.
1 INTRODUCTION
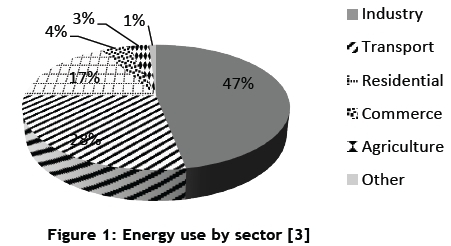
The South African energy economy is under immense pressure, in part because the main energy utility, Eskom, has struggled to generate sufficient reliable electrical energy to meet customer demand. Nersa estimated that the impact of 23 days of load shedding in 2008 cost the South African economy R2.17bn a day [1], which has had a direct negative impact on the nominal GDP. South Africa is further threatened by a scarcity of fresh water that is intensified by increased demand, unsustainable usage, and pollution [2]. The industrial sector is currently South Africa's largest consumer of energy, using about 47 per cent of total national energy [3], as illustrated in Figure 1.
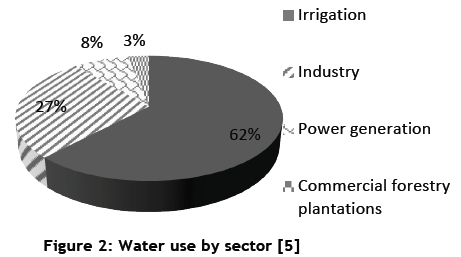
The Digest of South African Energy Statistics 2009 forecast that the manufacturing industry will use about 45 per cent of all electricity produced nationally [4]. The manufacturing industry is also responsible for 27 per cent of national water consumption [5]; irrigation is the only sector using a greater portion, as seen in Figure 2.
From the above statistics one can deduce that there is a major opportunity for an overall reduction in national water and energy consumption - provided that focus is placed on water and energy saving initiatives in the South African manufacturing industry.
Lean manufacturing is a management system that focuses on continuous improvement by constantly identifying and eliminating the sources of waste in a process [6]. The lean manufacturing methodology is based on the Toyota production system (TPS), and was popularised by the book The machine that changed the world [7]. Lean manufacturing has been successfully implemented in many organisations throughout the world and in South Africa, leading to a significant increase in productivity and profitability in these companies. Research has shown that lean productivity improvements have led to the indirect reduction of energy comsumption in manufacturing processes, because the lean philosophy seeks to eliminate waste in a process [8, 9].
The author hypothesised that developing a lean based water- and energy-efficiency improvement framework could support the objective of the South African manufacturing industry of reducing its water and energy demand. This can be achieved by the continuous improvement philosophy of lean, which holds that a process is never fully optimised and that there are always opportunities to improve. The water and energy stream mapping (WESM) framework was developed for this reason [10, 11].
Prior research has been carried out on value stream mapping (VSM) models for energy [16, 17, 18]. The energy-based VSM models include value and energy stream mapping (VeSM) [18], value and energy stream (VESM) assessment [16], and energy and value stream mapping (EVSM) [17]. A brief overview of the individual methodologies is provided below.
The VeSM method, developed by Prather, evolved from the need to map supplementary process performance parameters and tools, in addition to the traditional VSM technique. This was done to identify more opportunities to reduce waste and cost. Included in these supplementary parameters and tools are energy use, equipment energy efficiency, energy intensity, statistical process variables, and heat loss.
The basic framework for EVSM, on the research conducted by the Fraunhofer Institute, can be summarised as a systematic three-step process [17]:
• Holistic collection and evaluation of energy consumption in the production processes being studied;
• Use of design guidelines to increase energy efficiency; and
• Energy consumption optimisation.
Erlach explains that the framework for EVSM should lead to the achievement of the following goals [17]:
• A rough analysis of energy consumption in selected production areas by identifying all relevant energy types and all relevant energy consumers, and by creating transparent production process-related energy usage.
• Avoiding energy wastage by providing a basis for energy consumption optimisation, key figures to estimate energy efficiency, and estimates of potential energy efficiency.
• A systematic process to increase energy efficiency by providing design guidelines for a thorough search for improvement measures and tools to visualise the ideal future state.
The VESM assessment methodology consist of two stages:
• Value and energy stream assessment: concentrate on identifying potential opportunities for improvement, and selecting the best-practice opportunities.
• Improvement implementation: investigate and repair, and obtain engineering and technical support.
Some of the limitations in the above methodologies identified by this researcher are listed below, together with opportunities considered to develop the WESM framework:
• The frameworks consider the energy waste types; however, they only consider, and provide information on, the energy impact of the traditional lean wastes. They do not consider energy-and water-specific wastes, which the researcher included in the WESM framework.
• The prior research did not consider measurement and verification (M&V) guidelines for energy efficiency. Incorporating an M&V methodology into the WESM framework will allow practitioners to determine the improvement in water and energy efficiency accurately, in line with internationally-accepted M&V practice.
• Some of the prior research determines the effectiveness of the intervention, based on a comparison of the energy consumed per unit before and after implementing measures. This essentially negates the impact of the independent variables in the manufacturing process, which in itself can either positively or negatively influence the energy or water intensity. This is addressed in the developed WESM framework by using a regression model.
An overview of the WESM framework is provided in the next section, and then discussed in more detail.
2 BACKGROUND TO THE WATER AND ENERGY STREAM MAPPING (WESM) FRAMEWORK
The VSM tool was used as a basis for the developed WESM framework, as the tool effectively pulls together and uses all lean principles, techniques, and tools [12]. The author decided to investigate and incorporate frameworks and methodologies relating to the fields of measurement and verification (M&V), energy auditing, and VSM. The following methodologies and frameworks were considered and used to develop the WESM framework:
• The measurement and verification protocol [13];
• The energy audit guideline of the Government of Hong Kong Special Administrative Region [14];
• The energy audit manual and tool of the Office of Energy Efficiency and Natural Resources, Canada [15];
• The energy value stream mapping framework of the Fraunhofer Institute [16];
• The energy value stream mapping framework of the Institute of Machine Tools and Industrial Management at Berkeley, University of California [17]; and
• The value and energy stream mapping framework of California Manufacturing Technology Consulting [18].
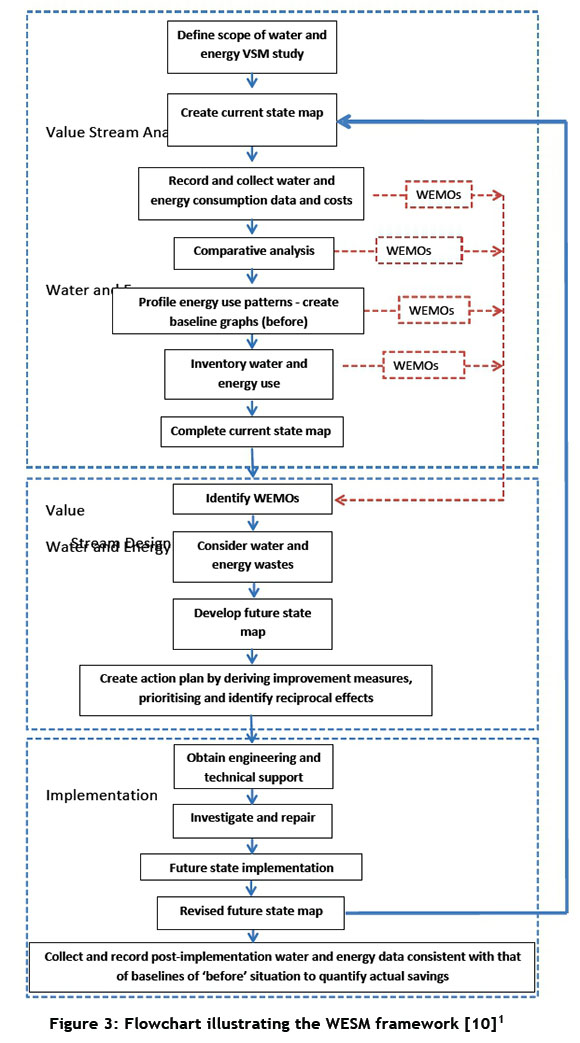
The developed WESM framework was formulated to follow the lean principle of kaizen (the Japanese term for 'continuous improvement') by using the plan-do-check-action (PDCA) problem-solving cycle. The developed framework is subdivided into three phases, illustrated in Figure 3:
• Water and energy value stream analysis;
• Water and energy value stream design; and
• Implementation.
The analysis phase includes all the actions required to create a complete current state water and energy stream map. It is essential that the preparation is thorough; so this phase is subdivided into individual elements to guide the project team in considering all aspects.
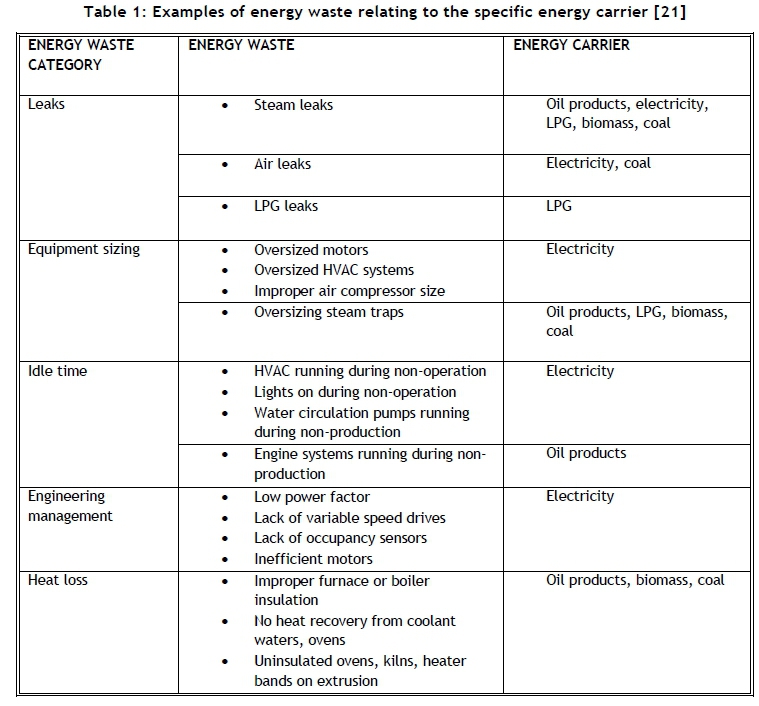
During the water and energy value stream design phase, the project team will consider the water and energy wastes to develop the future state map and the action plan to implement the improvements. The water and energy waste categories to be used in conjunction with the WESM framework are:
• Leaks;
• Equipment sizing;
• Idle time;
• Engineering management; and
• Heat loss [11].
If required, this phase can also include a return-on-investment study for improvements that might require capital expenditure.
In the final phase of the WESM framework, the implementation phase, the future state map is implemented according to the project plan. After the complete implementation, the future state map is revised, and essentially becomes the current state map for the next wave of the project, completing the PDCA loop.
The flowchart in Figure 3 illustrates the complete WESM framework. The next section will discuss the individual elements of the water and energy value stream analysis phase.
3 WATER AND ENERGY VALUE STREAM ANALYSIS
3.1 Defining the scope of the water and energy VSM study
The starting point for any WESM study is to define the scope of the project. This ensures that the project team delineates specific parameters for the study that assist the team to maintain focus and resist diverting their attention from the defined goals. The parameters to be considered are physical area of study, energy types (including water), timeframe (which will dictate the level of detail), priorities, and potential. The scope should be clearly documented for the team to reflect on regularly, and to ensure that the project does not grow beyond its scope.
3.2 Create the current state map
The team can start drawing the current state WESM at this stage, focusing on adding as much information to the map as possible. As with conventional VSM projects, the project team will physically walk through the processes to observe the water and energy flows. This walkabout should be carried out in conjunction with all the relevant departments of the company to provide additional information that may not be immediately visible.
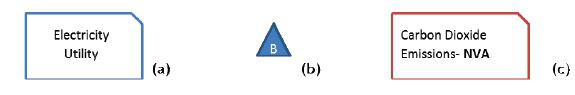
Following a conventional VSM development process, the practitioner will start with the customer - i.e., what is produced for the customer. So a customer information block will be added to include total units produced for the customer (value-adding), which will later include the total value-adding energy or water per unit required for manufacturing (see Figure 4(e)). Likewise, the non-value-adding by-products from the manufacturing process will also be represented on the map, as seen in Figure 4(c). In the case of energy, one of the biggest non-value-adding by-products is the emission of carbon dioxide. These emissions are easily calculable with the use of standard factors, as shown below for the two common energy carriers in the manufacturing industry.
• Electrical energy produced within South Africa = 1.015 kg CO2 per kWh, and
• LPG = 0.21451 kg CO2 per kWh [19].
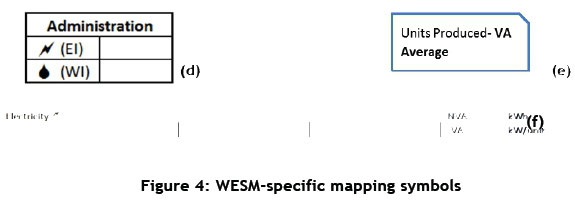
Process boxes are included in line with the normal VSM process; however, the information is expanded to include data pertinent to water and energy (see Figure 4(d)).
Baseline icons are inserted before process boxes, where the WIP is normally displayed on a VSM (see Figure 4(b)). The baseline icon represents the baseline water or energy consumption in a process when there is no production. This consumption is a complete waste to the customer, and so it needs to be kept to an absolute minimum. It is required, however, that certain production equipment remains idle rather than being turned off completely, due to long start-up procedures. Thus it is essential to establish the minimum baseline usage to manage this baseline consumption figure effectively.
In a conventional VSM, the suppliers are illustrated on the LHS of the map, which in the case of a WESM will be the energy or water utility for the specified manufacturer (see Figure 4(a)).
Conventional VSM employs a lead time ladder that splits the VA and NVA times to establish the lead time for a specific product in a value stream. In the case of a WESM, water and energy flow ladders will be drawn below the process boxes (see Figure 4(f)) to distinguish between VA and NVA water/energy consumption. The NVA portion will primarily be the baseline consumption figure, which should be minimised as far as possible.
3.3 Collection of water and energy data
The practitioner needs to collect water and energy consumption data, and associated costs of the various energy types and water - such as historic energy bills and metering data. If this data is not readily available, metering equipment should be installed to gather the required information.
3.4 Comparative analysis
At this stage of the mapping process, a comparative analysis - with similar processes outside of the delineated process area within and external to the organisation - should be considered as a benchmarking process. Any improvements to the observations in the benchmarking process can be regarded as possible improvements to the future state map.
3.5 Profile energy use patterns
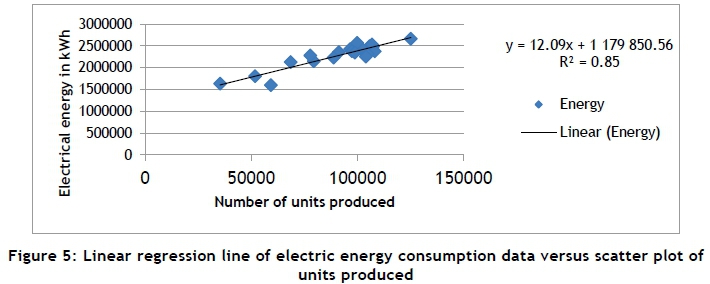
To measure and evaluate the level of effectiveness and success of the project, the energy usage for the area of study for the pre-implementation period, assuming no improvements were made, needs to be compared with the actual energy usage after the implementation of the project. As it is not possible to measure water and energy savings directly - hence the need to measure postimplementation - a forecast for the same period is required. Such a forecast can be achieved using regression analysis. For energy- or water-specific applications, the regression model is shown below [13].

where E is energy use estimated by the equation, C is the constant term in [energy units/day (period)], B1,B2...Bnis the coefficient of independent variable Vnin [energy units/driving variable units/day], and V1,V2...Vnis the driving variable. If any adjustments need to be made, A1 is the coefficient for the independent variable for the adjustment and Vnis the independent variable for the adjustment.
To ensure the data used for the regression model is statistically valid, and to evaluate the strength of the regression model, the following indices are used [20]:
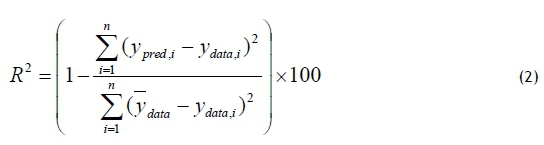
where ydata1is the data value of the dependent variable corresponding to a particular set of independent variables, ypred,iis the predicted dependable variable value for the same set of independent variables as for ydata1,  data is the mean value of the dependable variable of the data set, and n is the number of data points in the data set.
R2is the coefficient determination and is used to determine the degree of linear-correlation of the variables - in other words, how well the data fits into the regression model. The suggested acceptable value for R2is a value greater than 0.75 (75 per cent).
An example of a scatter plot and the corresponding linear regression model for a process, detailing the electrical energy consumption data versus units produced, is given in Figure 5. The linear regression formula and the R2value are displayed on the graph.
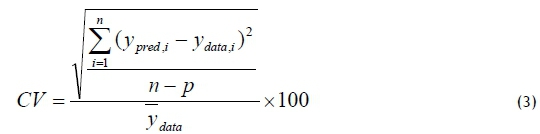
The coefficient of variation CV is the ratio of the standard deviation to the mean. This coefficient determines the variability between two data sets - in this case, the experimental data versus the predicted data. Therefore, the lower the CV, the less variation there is between the two data sets. This index therefore determines the uncertainty in the model. The suggested acceptable value for CV is values smaller than 15 per cent.
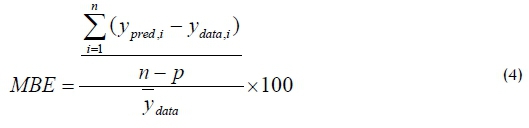
The mean bias error MBE is the statistical measure that indicates the bias in a regression model. A positive measure therefore indicates an estimate higher than actual; whereas a negative value indicates an estimate lower than actual. The suggested acceptable value for MBE is ±7 per cent.
3.6 Inventory energy and water use
Wherever possible, the energy and water consumption data for individual processes should be recorded to determine the standard behaviour of each process. This exercise will determine the difference between the necessary and the unnecessary non-value-adding water and energy consumption. The aim should be to eradicate completely the unnecessary non-value-adding demand and minimise the necessary demand.
All information and data necessary to complete the current state map is now available. The next section will discuss the water and energy value stream design phase.
4 WATER AND ENERGY VALUE STREAM DESIGN
4.1 Identify water and energy management opportunities (WEMOs)
As illustrated in Figure 3, WEMOs are determined and identified in framework steps, as discussed in Sections 3.3, 3.4, 3.5, and 3.6. These opportunities might exist from a process management perspective, with no requirement for additional investment. Such opportunities might include standardisation of a process, optimal start-up sequence to achieve lowest energy consumption, regular maintenance to minimise water loss through leaks, and switching over transformers or compressors during non-production to stand-by units, etc.
4.2 Consider water and energy waste
The developed current state map needs to be scrutinised, and the possible water and energy waste should be identified and recorded on the current state map as focus areas. Examples of energy waste are given in Table 1.
The team should focus on actions either to eliminate or to minimise these wastes. These actions will be transferred on to the future state WESM.
4.3 Develop future state map
At this stage of the WESM framework, the team should be ready to develop the future state map. The future state WESM is a visual depiction of the optimised water and energy stream of the project area. The future state map will become a blueprint for the planned improvements.
4.4 Creation of action plan
Once the future state WESM is completed, the project team needs to create an action plan. The action plan will list the actions to be implemented during the implementation phase: repairs, improvements, WEMOs, etc. The actions need to be prioritised and the timing deadline, responsibility, and completion status need to be documented on the action plan. It is advisable to perform a risk evaluation or a failure mode and effects analysis (FMEA) to identify any negative effects of the proposed improvement actions. This is also a good opportunity to determine whether any improvement actions might lead to a reciprocal effect in another area of the manufacturing plant.
5 IMPLEMENTATION
5.1 Engineering and technical support
The first step of the implementation phase is to involve engineering and technical support staff in implementing the proposed improvements. Usually, the team would already have obtained buy-in from various departments at the inception of the project; however, at this stage, the finer detail should be considered and agreed on. This will avoid unnecessary waste and delays.
5.2 Investigate and repair
During the mapping process, the team would have noted WEMOs that would have been included on the WESM and the subsequent action plan. At this stage, these opportunities need to be investigated, implemented, and closed out. These actions are usually maintenance items and opportunities that will most likely not require significant investment.
5.3 Future state implementation and revision
These are the final steps in the implementation of the WESM framework, where all outstanding issues should be closed out and actioned. When the project implementation is complete, according to the action plan, the future state WESM needs to be revised. The revised future state map will only be different from the map already created if some of the actions were either not implemented in full or not implemented at all for unexpected reasons. This revised future state map now becomes the blueprint for the current process and, therefore, the current state map for the next wave of improvements in the studied process.
5.4 Collect and record post-implementation data
To measure the effectiveness of the WESM process and the extent of the water and energy saved, the post-implementation water and energy consumption data must be collected and compared with the baseline regressions, as developed in Section 3.5. The baseline data is developed for exactly the same independent variable data as for the post-implementation period. The independent variable for a manufacturing process will usually be the number of units produced. The pre-implementation and post-implementation data can now be compared to determine how much water or energy has been saved.
6 CONCLUSION
In response to increasing costs and the decreasing ability of South African utilities to supply water and energy reliably since 2007, the author has endeavoured to develop a framework to assist manufacturing professionals to conduct effective water- and energy-saving projects. It was decided to develop a lean-based water and energy efficiency tool, due to the proven energy efficiency benefits of implementing lean manufacturing principles.
The developed WESM framework has been discussed, and the individual framework elements have been explained, to guide lean or water and energy efficiency improvement teams in the manufacturing industry to develop and implement water and energy stream maps successfully.
As the goal of this paper was only to explain the methodology of the WESM, no statistical data on case studies was provided. This methodology is intended to be used in conjunction with existing productivity improvement workshops in manufacturing companies and, if VSM is used, as an extension of VSM. It can, however, also be used as a stand-alone tool.
REFERENCES
[1] Bisseker, C. 2015. Too dark to shop? Financial Mail. Retrieved from http://www.financialmail.co.za/features/2015/02/05/economy-too-dark-to-shop. Accessed: May 29, 2016. [ Links ]
[2] Department of Water Affairs. 2011. The annual national state of water resources report: October 2011 to September 2012. Retrieved from https://www.dwa.gov.za/groundwater/documents/2011-12%20Annual%20National%20State%20of%20Water%20Resources%20report.ppd. Accessed: September 16, 2015. [ Links ]
[3] Department of Minerals and Energy. 2004. Energy outlook for South Africa. Eskom Energy Research Centre (ERC), Cape Town: University of Cape Town (UCT). [ Links ]
[4] Department of Energy. 2009. Digest of South African energy statistics 2009. Retrieved from http://www.energy.gov.za/files/media/explained/2009%20Digest%20PDF%20version.pdf. Accessed: September 20, 2015. [ Links ]
[5] Department of Water Affairs and Forestry. 2004. National water resource strategy, 1st edition. Pretoria: Department of Water Affairs and Forestry, South Africa. [ Links ]
[6] Nicholas, J. 2011. Lean production for competitive advantage: A comprehensive guide to lean methodologies and management principles. New York: CRC Press. [ Links ]
[7] Womack, J.P., Jones, D.T. and Roos, D. 1990. The machine that changed the world. New York: MacMillan. [ Links ]
[8] Mollenkopf, D., Stolze, H., Tate, W.L. and Ueltschy, M. 2010. Green, lean and global supply chains, International Journal of Physical Distribution & Logistics Management, 40(1), pp 14-41. [ Links ]
[9] Rao, P. 2004. Greening production: A South-East Asian experience, International Journal of Operations and Production Management, 24(3), pp 289-320. [ Links ]
[10] Davies, E. and van der Merwe, K.R. 2015. Development of a framework for a lean based water and energy efficiency assessment tool, Journal of Engineering, Project, and Production Management, 5(2), pp 98-106. [ Links ]
[11] Davies, E. and van der Merwe, K.R. 2014. Development of a framework for a lean based water and energy efficiency tool, Proceedings of the 5th International Conference on Engineering, Project, and Production Management, pp 95-104. [ Links ]
[12] Womack, J.P. and Roos, D. 2003. Lean thinking. New York: Free Press. [ Links ]
[13] International Performance Measurement and Verification Protocol. 2003. Concepts and options for determining water and energy savings, Vol. 1. Oak Ridge, TN: U.S. Department of Energy. [ Links ]
[14] Electrical and Mechanical Services Department. 2007. Guidelines on energy audit. Hong Kong: Energy Efficiency Office. Retrieved from http://www.emsd.gov.hk/filemanager/en/content_291/Guidelines_on_Energy_Audit.pdf. Accessed: April 12, 2013. [ Links ]
[15] Canadian Industry Program for Energy Conservation. 2011. Energy savings toolbox: An energy audit manual and tool. Canada: Office of Energy Efficiency and Natural Resources Canada. [ Links ]
[16] Erlach, K. 2011. Using principles of VSM for analysing the energy efficiency of a factory. Germany: Fraunhofer Institute for Manufacturing Engineering and Automation IPA. [ Links ]
[17] Reinhardt, S. 2011. Energy value stream mapping. Berkeley: University of California. [ Links ]
[18] Prather, K. 2011. VeSM (Value and energy stream mapping) expands opportunities for energy savings and cost reduction. California: California Manufacturing Technology Consulting (CMTC). [ Links ]
[19] Letete, T., Guma, M. and Marquard, A. 2008. Information on climate change in South Africa: Greenhouse gas emissions and mitigation options. Cape Town: Energy Research Centre, University of Cape Town. [ Links ]
[20] United States Department of Energy (USDOE). 2008. M&V guidelines: Measurement and verification of federal energy projects, Version 3. Washington DC: Nexant, Inc. [ Links ]
[21] Davies, E. 2016. The development of a framework to reduce water and energy consumption through the use of water and energy value stream mapping for the South African manufacturing industry. Unpublished doctoral thesis. [ Links ]
Available online 11 Nov 2016
Presented at the 17th annual international conference of the Rapid Product Development Association of South Africa (RAPDASA), held from 2-4 November 2016 in Vanderbijlpark, South Africa.
* Corresponding author Karl.vanderMerwe@nmmu.ac.za
# The author was enrolled for a D Tech (Operations Management) degree in the Department of Industrial Engineering, Nelson Mandela Metropolitan University

