


Services on Demand
Article
 English (pdf)
 Article in xml format
 Article references
Indicators

Related links
-
 Cited by Google
 -
 Similars in Google
Share

 Permalink
South African Journal of Industrial Engineering
On-line version ISSN 2224-7890
Print version ISSN 1012-277X
S. Afr. J. Ind. Eng. vol.27 n.2 Pretoria Aug. 2016
http://dx.doi.org/10.7166/27-2-1391
CASE STUDIES
Strategic production line synchronisation
M.L. Fienberg#; D. Hartmann*; T. Hattingh
School of Mechanical, Industrial and Aeronautical Engineering University of the Witwatersrand, South Africa
ABSTRACT
A study was conducted at the sole global producer of suspension struts for a particular vehicle manufacturer. This supplier is currently able to meet customer demand. However, it does so because of a large finished goods and work-in-progress (WIP) inventory. The plant operates two production processes that are separated by a large buffer of WIP, which essentially decouples the production processes. This study aimed to reduce this WIP buffer; this would require the processes to become synchronised, bearing in mind that the reliability of delivery should not decrease. A tool that considers time, quality, and machine capacity was developed to assess the impact of line synchronisation on company performance figures. It was found that line synchronisation produced several benefits for the supplier, including batch size reduction, lower inventory levels, and associated shorter lead times. This further allowed the supplier to improve flow in the plant by introducing a pull system. Improved visual oversight could lead to further improved problem-solving and innovation.
OPSOMMING
'n Gevallestudie is by die alleenverskaffer van suspensiestutte vir 'n spesifieke motorvervaardiger geloods. Die vervaardiger kan tans die vraag van die kliënt bevredig, maar dit is as gevolg van 'n groot voorraad van voltooide goedere en werkstukke in proses. Die fabriek bedryf twee vervaardigingsprosesse wat met 'n groot buffer van werkstukke in proses geskei word. Dit ontkoppel effektief die produksieprosesse. Die doel van hierdie studie is om die werk-in-proses buffer te verminder. Dit vereis dat die prosesse gesinkroniseer moet word sonder dat die betroubaarheid verminder word. n Gereedskapstuk wat die tyd, gehalte en masjienkapasiteit in ag neem is ontwikkel om die impak van produksielyn sinkronisering op die maatskappy se vertoning te bepaal. Daar is gevind dat die produksielyn sinkronisering verskeie voordele vir die verskaffer inhou, onder andere vermindering van lotgrootte, laer voorraad-vlakke en korter leitye. Dit het die verskaffer toegelaat om die vloei in die fabriek te verbeter deur n trekstelsel bekend te stel. Verbeterde opsig kan lei tot verder verbeterde probleemoplossing en innovasie.
1 INTRODUCTION
Automotive manufacturers are constantly innovating their production processes to reduce costs and increase volume and quality levels, with similar innovations expected from their suppliers.
Production facilities are typically made up of a series of production processes. The extent to which the production processes work in harmony to create a level production schedule determines whether the plant as a whole is synchronous.
Unsynchronised production processes increase the amount of inventory kept in a production system, hiding inefficiencies and increasing costs. Ensuring the controlled flow of inventory in a plant is difficult to achieve, with machinery often operating at different input and output rates.
This study was conducted at a South African Original Equipment Manufacturer (OEM) that is the sole, global producer of forged aluminium rear suspension struts for a specific model of a major vehicle manufacturer. The OEM exports 92 per cent of struts produced, with eight per cent used in the local market. This OEM currently experiences high levels of inventory and disjointed flow between production and customer deliveries.
This study explores various strategies that organisations can use to synchronise all elements within their production system, enabling the controlled flow of inventory. A synchronised production line could enable a reduction in batch sizes, work-in-progress (WIP) levels, and lead times, potentially enabling large financial savings in the capital requirements.
The objectives of this study are:
1. To identify factors that contribute to the OEM's unsynchronised production line
2. To develop a tool to test the effect of implementing strategies to maintain a synchronised production system
3. To evaluate the effect of strategies on the production system
2 LITERATURE REVIEW
The limited research on production line synchronisation focuses mainly on the lean production philosophy and theory of constraints (TOC), which both require scheduling techniques that anticipate - and counter - uncertainties before they occur. Lean scheduling requires a smooth production schedule with limited peaks, while TOC methods focus on shop-floor-level scheduling [1].
Line synchronisation
Many studies [2] have focused on addressing varying work content among the work stations on a line. Ohno [3] called this 'unevenness' (Mura). The key elements that must be addressed to improve are 'unevenness', 'waste' (Muda), and 'overburden' (Muri). To balance a line, work elements are moved between work stations to even out the work load within a value stream [4].
By contrast, this study explores line-asynchronicity, which is a phenomenon of a decoupled production system, where inventory is used as a buffer to insulate a downstream machine from having to work in a coordinated way with the machine feeding it. Thus machine A (which feeds machine B) doesn't need to make what machine B needs as long as machine B has a sizeable stock of the required material. For this study, the question asked was whether matching the output of machine A to the needs of machine B could reduce the large buffer inventory.
The undesirability of inventory
In the lean philosophy, inventory is generally viewed as a liability to an organisation [5, 6]. This view is also supported in the theory of constraints [7], and contrasts with accounting practice in which inventory is generally viewed as an asset [8]. The major justification for viewing inventory as undesirable is that it ties up capital that could be invested; and plants with large amounts of inventory tend to be less flexible, being bound to their current business through the sunk cost fallacy (see [9] and [10]). Inventory is also often used in organisations to hide inefficiencies and process errors; and it makes problem-solving more difficult [11]1.
Inventory accumulation
Some organisations plan buffers or strategic stock [12] to insulate their operations against variation. This is common in bottling plants, where machines are decoupled, raising Overall Equipment Effectiveness (OEE) [13]. Accumulated inventory is often a result of not heeding the lean principle of pull [3], instead pushing currently-unsellable inventory into the system. This manifests as one of the seven well-known wastes: overproduction [14].
The theory of constraints also predicts that inventory accumulates immediately upstream of a bottleneck [7]. This is often used diagnostically - although it is important to note that the presence of a bottleneck is not the only reason for inventory accumulation.
Inventory level reduction
Inventory levels can be safely and sustainably reduced by embracing a pull philosophy [14], which links plant activity to real customer demand. This means that nothing will be in process unless ordered. This will have to be coupled to a strategic decision to drop stock levels [7], which will start to manage the waste of overproduction [11]. Such material reduction must be done in concert with good production planning practice [15].
3 METHOD
A case study approach was chosen, as the OEM exhibits interesting (but not atypical) behaviours and processes within a South African production environment. The case study was used to collect rich data on current practices through immersion in the OEM. This study was conducted in four phases:
Phase 1: Analysis of the current operating state of the OEM to determine why it is unsynchronised, through:
• Plant observations
• Engagement with staff
• Raw data collection
• Mapping of processes
• Root cause analysis techniques
Phase 2: Development of an Excel model to represent the current (asynchronised) state of production processes within the OEM.
Phase 3: Idealisation of a future state that incorporates best practice strategies to create a synchronised production system.
Phase 4: Comparison of the current and future states to determine whether implementing strategies could have the desired effect.
4 CURRENT STATE ANALYSIS
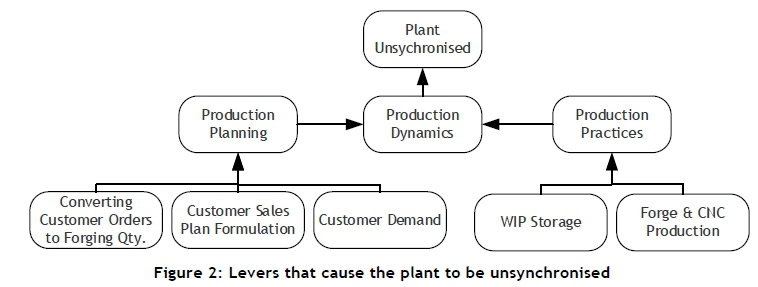
This study found that the main drivers of the unsynchronised nature of the plant were the production process itself and the dynamics of production. The study explored planning, demand dynamics, machine variability, and WIP variation. Each of these is described in detail in this section.
4.1 The production process
The OEM currently forges five different types of suspensions struts that can be made into 14 variants following Computer Numerical Controlled (CNC) machining. In the period September 2012 to August 2013, the OEM produced over 4.8 million struts.
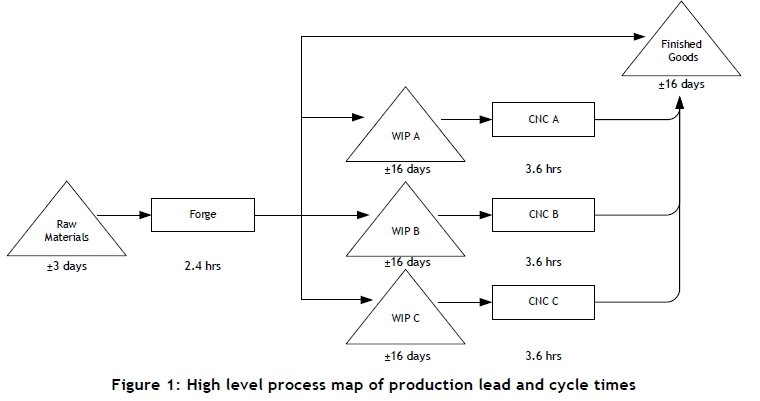
The production process, mapped in Figure 1, shows raw material arriving about three days before use. All struts are made on a single forge, which requires tool changes between runs of the different strut types. Batches are always 2,600 units, but multiple batches can be run before a tool change takes place. The forging process has a throughput time of 2.4 hours per batch. The batches of forged struts are either entered into WIP if further machining is required, or are sent directly to the finished goods area for shipping to the customer. The CNC cells - permanently configured to machine only one of three strut types - are always provided with struts in equal batch sizes regardless of strut type. It takes a CNC cell 3.6 hours to machine a batch of struts. Struts that have been machined are transported to the finished goods warehouse for shipping.
Given that the forge can only make a single strut type at a time, the OEM stockpiles WIP struts by running large batch sizes. These must be large enough to continually supply the CNC cells with material while the forge runs batches of the other strut types. The forge is the constrained resource and bottleneck that determines the OEM's throughput.
The OEM's internal lead time was found to be 35.25 days, with only six hours spent on value-adding activities. The WIP storage area makes up 45 per cent of the total lead time in the production process, and allows the forge and CNC machines to operate independently of one another, resulting in the plant being unsynchronised.
4.2 Production dynamics
The production dynamics that result in the OEM's plant becoming unsynchronised can be separated into two categories: production planning and production practices. Within these categories are various levers, shown in Figure 2, that influence the production process and that will each be explored further.
4.2.1 Production planning
Inventory levels within the production process are driven by a production schedule. Scheduling is closely co-ordinated between the logistics and production departments, with all planning done in a shared MS Excel document.
The logistics department manages forecasted and confirmed customer orders, and formulates a sales and raw material plan by smoothing customer orders over a specific production time period. The logistics department must also manage the complex packing and shipping arrangements for export customers. Exported struts must be sent in full shipping containers to maximise space usage and cost-effectiveness. The finished goods exported from the OEM are only expected to be used in three to four months' time, with the OEM having limited visibility of the supply chain after the goods leave the plant.
The production department's function is to ensure that struts are manufactured at the required pace to meet the sales plan. The production department controls the strut batch sizes and the sequencing of the different strut types on the forge, and must minimise machine downtime and scrap levels.
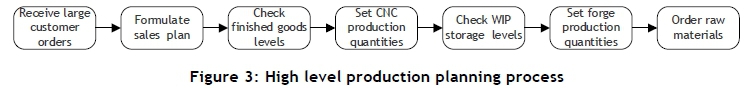
The current production planning process involves evaluating the current level of finished goods against the customer sales plan. To meet the sales plan, production is scheduled backwards through the plant in the production areas, as shown in Figure 3. Production planning is done by adjusting the production quantities for the CNC cells and the forge, until the finished goods and WIP storage levels are sufficient to meet the sales plan for the forthcoming week's production.
In setting the production targets for the forge and CNC machines, the WIP storage levels are visually inspected in the MS Excel document and the sales plan is considered, when the targets are:
1. 21,000 units planned for a production day when no forge die tool changeover will occur,
2. 17,500 units planned for production on a forge die tool changeover day, and
3. 2,400 units for each CNC per shift.
The forge has a capacity of 24,000 struts per day, and the CNC cells 2,520 struts per shift. The current production planning process provides for a three-hour daily allowance of unexpected downtime on the forge. On days in which die changes occur, 6.5 hours of downtime are scheduled with the die changeover expected to take 3.5 hours and the remaining three hours used to adjust the forge setting to produce the required quality. The sequence in which the different strut types are forged is not fixed, and the sequence schedule considers the WIP storage levels.
A fundamental flaw identified in the planning approach is a failure by the OEM to account for the internal lead time for forged struts to reach finished goods. This results in a reactive production approach that is always trying to meet a changing future production target. The struts currently being forged will be used to fill a future unknown order quantity, with the struts currently being shipped not corresponding to the original order from which the struts were placed. This is a result of the decoupling between elements of the process. The success of this system requires high WIP levels.
The production targets set are overly optimistic, exceeding the mean daily output of the forge. As a result, production aims to achieve unrealistic targets, given the constraints on the production system related to scrap levels and machine uptime. The method of only setting two daily production target levels creates push production, unrelated to the customer demand, resulting in further inflated planned forging quantities and over-estimates of raw material requirements.
The current production planning strategy creates erratic WIP levels, as shown in Figure 4, and ties up large amounts of working capital. Inventory levels are too difficult to control, given the slow feedback loops attributed to the plant's long internal lead time.
4.2.2 Customer releases, sales plan, and forging quantities
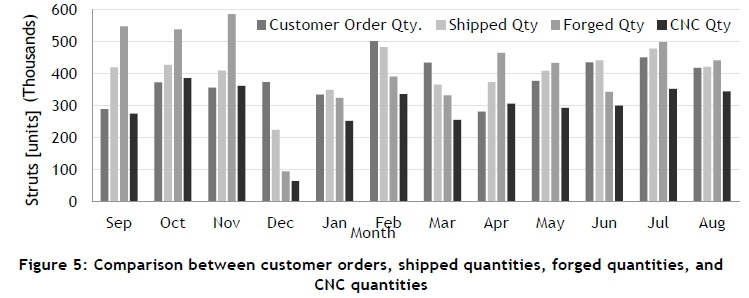
A more thorough understanding of the relationship between the factors of customer orders, the customer sales plan, and forging quantities is needed to determine their impact on overall WIP levels and the variability of production. Figure 5 provides a comparison between the customer orders, the customer sales plan, and the production quantities for all strut types.
The expected trend in Figure 5 is that the customer order and shipped quantities should be about the same as each other, to ensure that the OEM meets its customers' demand requirements. If the shipped quantities are marginally above the required customer order quantities, this will lead to overproduction, as the shipped quantities are used to determine the strut quantities to be forged. Similarly, the forging quantities should be slightly higher than the shipped quantities to allow for a one per cent scrap allowance. CNC quantities are expected to be about 75 per cent of the size of the forging quantity, as not all struts are CNC-machined.
In Figure 5, the expected trend is only observed for the month of August. In all the other months of the year, there is either over- or under-production on the forge, with the shipped quantity exceeding the customer order quantity in nine months of the year. Over the past year, the cumulative sales plan and forging quantities were four and eight per cent respectively above the required total customer order quantity. The forging quantity, above the customer order quantity, equates to 19 days of over-production on the forge. The OEM has no formal process to compensate for over- or under-shipments of struts to the customer from previous orders. The major impact of long-term overselling will inevitably result in the OEM having to use short time, or stopping production, while customers use up the excess stock.
4.2.3 Customer demand
It must be established whether specific customer orders contribute to the erratic demand patterns that affect the OEM's production. Demand at a customer level was explored, as the sales plan is based on customer orders. If customer demand were consistent, it would enable smooth flow and lower WIP levels.
It was found that the local customer consistently placed fixed order sizes, while overseas customers provided highly erratic and infrequent orders. The largest overseas customer had a mean monthly order of 99,000 struts, with a standard deviation of 78,000 struts. Given the large variation in order sizes, the OEM requires high levels of WIP and finished goods to meet the changing customer order requirements.
The OEM is provided with a six-month order forecast from all its customers to plan production. However, the customer forecasts are unreliable, with customer orders only being confirmed days before a new production month. While it is important that the OEM produces as close to customer demand as possible to prevent overproduction and unnecessary WIP levels, the ordering practices of the customers make this difficult to achieve.
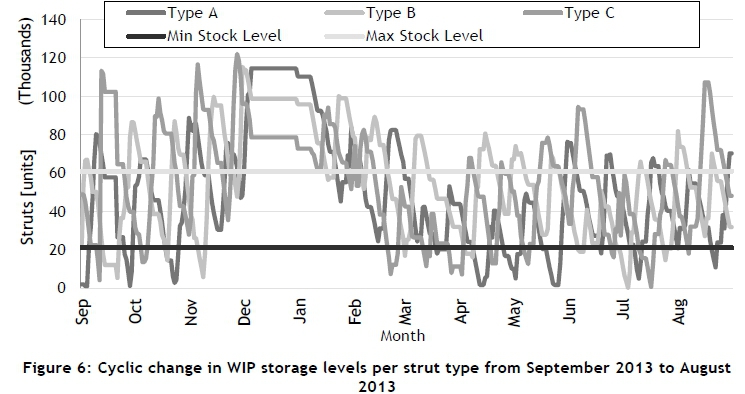
4.2.4 WIP storage
The WIP storage area is currently filled by the 'push' production plan. The forge is scheduled to run large batches of struts resulting in a cyclic rise and fall of WIP storage levels, which have historically reached extremely low levels. The use of an irregular forging sequence of the different strut types results in sharp peaks and troughs of WIP levels that exceed the set maximum and minimum WIP limits, as shown in Figure 6.
The OEM has no formal methods for evaluating its WIP levels. WIP storage levels are determined by visual inspection of the production planning document, with adjustments then made to the planned forging and CNC quantities to try to control WIP levels.
4.2.5 Forge and CNC production
The changing levels of inventory depend on the input and output rates at which inventory is added and removed. Knowing the average rate at which inventory changes in the WIP storage area can improve the planning and control of inventory levels. Table 1 provides descriptors of the average throughput rates of the forge and CNC machines, which determine the flow of inventory through the WIP storage area.
Table 1 shows that the forge averages a 15 per cent lower OEE than that achieved on the CNC machines. Quality levels on the forge are high, with the measures of performance and availability resulting in the lower overall OEE scores on the forge. The lower availability scores on the forge are attributed to tool changeovers and reduced uptime as a result of required changes in the forge settings. The mean changeover time on the forge is 3.8 hours with a standard deviation of 43 minutes. Five to six changeovers are currently performed in a month, resulting in a forge cycle time of 19 days to make all strut types.
The daily scheduling of the CNC machines is not determined by customer demand or the throughput of the forge. Given the constant stockpile of inventory in the WIP storage area, the CNC department continually pulls inventory to keep the CNC machines 'busy' for the shifts.
When running a particular strut type on the forge, all raw materials kept for a specific strut type are forged. This is to deplete raw material supplies so that the particular stock is not held in the limited raw materials storage space for the duration it takes to run all the other strut types.
The impact of this practice is that the plant's bottleneck produces struts that are not needed, and it loses production time that cannot be recovered for a required strut type. The nature of the OEM's business allows it to overproduce: finished goods do not become obsolete, as struts can always be used to fill an order at a later stage, at the expense of increased WIP levels.
It can be concluded that the main factors causing the OEM to be an unsynchronised plant are the following:
1. Production targets are set without considering the plant's actual output limitations of its machinery.
2. Production quantities made on the forge are not linked to the original customer orders.
3. Internal lead times are not accounted for.
4. Irregular customer ordering practices, which are further inflated due to shipping requirements.
5. The forge does not stop producing once customer order requirements have been met.
6. The current high levels of WIP in the factory reduce the OEM's need actively to solve problems associated with the forge's unpredictable uptime.
5 FUTURE STATE
Inconsistencies between production planning and production practices have been established as the key determinants of the OEM's plant not being synchronised. Production planning currently occurs in isolation from the plant's constraints, while production practices lack stability and controls to meet the production plan. A synchronised plant needs to consider the whole production system, which involves aligning production planning and production practices. Achieving a synchronised production line will rely on production planning's ability to buffer customer order variability, and to adjust to the changing production dynamics in machinery availability, performance, and quality levels.
5.1 Synchronisation production line model
This section defines an idealised future state design of a synchronised production line. Idealised design requires the concept to be both technically and operationally feasible if it is to be implemented immediately. The purpose of the future state is to test the impact of changing production strategies.
A synchronised production line within the OEM's plant would have the following features:
• Small batches of a large customer order would be run on the forge, followed by short die changes.
• The planned production output of the forge would be similar to that actually achieved.
• The forge would pull a quantity of raw materials marginally above the order requirements of the customer to account for scrap allowances.
• WIP storage would receive struts in a fixed sequence from the forge, enabling it to cycle through controlled fluctuations in WIP levels.
• Inventory in the WIP storage area would be sufficient to buffer production variability from the forge.
• WIP storage would be seen as a time buffer, given the slower cycle times of the CNC cells. This would prevent overproduction and ensure that the CNC cells move at a pace that prevents them from being idle.
• The CNC cells should only be activated to produce at a balanced production rate, with their use determined by the forge's use.
• The struts shipped from the warehouse would correspond to the original customer order for which they were made.
• The production plan's primary purpose would be to determine a cap of the WIP levels that should be held within the production process. It would form the link between customer orders and the shipping plan, trigger the required forging quantities, and ensure sufficient raw material supplies.
Figure 7 shows the future state model. A description of the numbered stars is given below the figure
The interaction between the OEM, its customers, and suppliers would involve:
1. The customer orders for a month being collected and formulated into a shipping plan that the OEM must meet. The shipping plan would need to schedule smaller quantities of the original orders across the month.
2. The shipping plan being used to formulate the production plan, which would determine the required CNC and forging quantities to be produced.
3. The production plan considering the OEM's lead time and machinery performance constraints, and forming the trigger to run production on the forge, ensuring that struts arrive timeously in finished goods.
4. The forge pulling from raw materials and pushing to finished goods inside the OEM's plant.
5. Shipping being pulled from finished goods according to the scheduled orders in the shipping plan.
To achieve the operating state described in the future state, changes to the OEM's production planning and actual production practices are required. The focus of this research will shift towards production planning to improve the accuracy of its production schedule.
5.2 Production planning
5.2.1 Overview
Production planning must enable the OEM to produce as close to the customers' requirements as possible. It should act as the buffer between variable customer orders and actual production. The planning process should follow this cycle:
1. Building a monthly shipping plan that aims to reduce customer order variability, prior to the plan being used to schedule production on the forge. This is done by adjusting the plan based on previous shipments to the customer, thus accounting for over- or under-supply due to container constraints in a proactive manner, instead of waiting for customer orders to be adjusted in three months once actual orders are received.
2. Scheduling production around the forge, where batch sizes and the number of forge tool changeovers to meet the set shipping targets are calculated.
3. Calculating the total CNC targets for the month and determining when the CNC cells should stop pulling from WIP storage.
4. Tracking a set monthly production plan for the current month, with adjustments made to the production plan for the following month, to compensate for over- or under-production for the current month.
To synchronise the OEM's production line, various MS Excel decision support tools were developed for each of the planning stages. MS Excel was chosen as the tool platform, as production planning staff were already familiar with it, and the tools could easily be integrated into the current planning documents.
To increase the accuracy of the OEM's planning, it was decided that the planning tools should incorporate strut-specific OEE data for the forge and CNC cells. This would enable the quantification of actual manufacturing performance, while facilitating the inclusion of both time and capacity utilisation of the machinery.
Three tools were developed to realise the previously-described planning process and ideal design. Next, the purpose and an overview of the tools developed will be described, including the tools' performance characteristics, and their limitations will be listed.
5.2.2 Shipment planning tool Purpose:
This tool generates a feasible shipping plan, as close to the original customer order as possible, while considering the OEM's customer shipping constraints.
Tool overview:
1. Determines the number of shipping crates required to fill each customer's order, while adjusting the order quantity by the number of struts over- or under-shipped in the previous month.
2. Customer orders with similar shipping destinations are combined, and the number of shipping containers required to meet the combined orders is calculated.
3. The user of the tool is now required to make a decision whether to round up or down the number of shipping containers to be used to meet the customer orders for the current month. 3.1 The user is shown the impact of their decision to round up or down the number of shipping
containers. The tool presents the insufficient or excess shipping crate capacity that needs to be added or removed to fill the set number of shipping containers.
4. An algorithm requires the user to make only a single input to allocate the excess capacity.
5. Calculates the required forging and CNC quantities for the month. The proportion that the shipping plan quantity is above or below the original customer order for the month is shown to the user.
6. Allows the user interactively to configure each of the containers to be shipped.
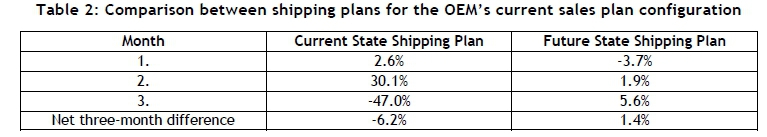
Tool performance:
A comparison between the OEM's current shipping plan and that generated by the shipping tool (future state) was conducted for a three-month period. Table 2 provides a comparison of the proportional difference that the shipping plan is above or below the customer order quantity for the specific month. In Table 2 the performance of the future state shipping tool is evident: the tool is able to get within a few per cent of the required customer order quantity per month, while adhering to all shipping constraints.
Tool limitations:
The tool is unable to recommend when shipping containers should be scheduled through the month, to smooth the demand requirements on the forge.
5.2.3 Forge monthly planning tool
Purpose:
This tool determines how many forge die changeovers can be achieved in a given month. The tool calculates the required batch sizes needed to meet the total monthly shipping plan quantities.
Tool overview:
1. The total shipping quantities for each strut type are used as inputs to determine the forging quantities to be made. The tool adjusts the required forging quantities for scrap and rework allowances on both the forge and the CNC machines, using historical OEE data for each strut
type.
2. Calculates how long the required forging quantities will take to forge, given historical cycle times, performance, and availability of OEE data for each strut type.
3. Determines how much normal production time (no overtime) is available to perform die changes in the current month.
4. The user can now allocate the number of die changes to forge each strut type, having input the expected duration a die changeover will take for each strut type.
5. The tool will notify the user:
5.1 Whether they have over-allocated the possible number of die changeovers that can be performed in a given month;
5.2 About the number of regular production hours expected to be available at the end of the month, after all changeovers and batch quantities have been forged.
5.3 The batch sizes to be forged for each strut type, based on the number of die changes allocated;
5.4 The expected forge production output quantities (targets) for die changeover and full production days. These output values should be used when planning the current production plan, as they are based on the estimated forge changeover time, availability, and performance OEE data for each strut type.
Tool performance:
Table 3 provides a demonstration of the key outputs that the tool generates.
To gauge the accuracy of the tool, the actual production quantities made on the forge for a given month were used as inputs for the tool. For the given month, five tool changeovers were performed in 21 normal working days, with one day of overtime used. Four of the five strut types were forged during the month, totalling 429,653 struts. In running the tool the same number of changeovers and strut production quantities were entered into the tool, with the estimated forge changeover time for each strut type set to 3.5 hours.
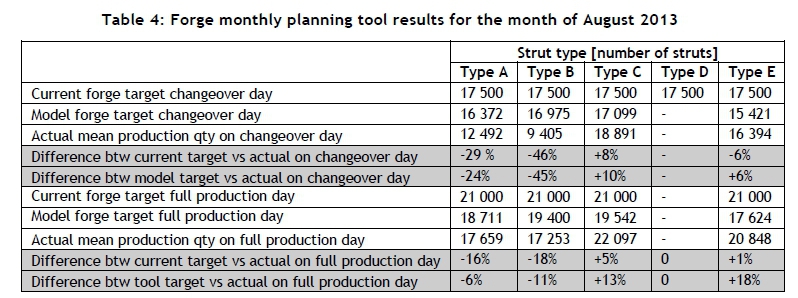
The tool was then run using the average OEE data for the past year, using 21 normal working days available for the month, as typically no overtime is used. The tool produced the results shown in Table 4.
The forge planning tool was able to set targets for a tool changeover day, averaging 13 per cent above the actual number of struts forged. If the standard target of 17,500 for a tool changeover day was set, the target would be, on average, 18 per cent higher than that actually achieved. Currently tool changeovers at the supplier are highly variable; this is evident from strut type B, when only 9,405 struts were produced on a tool changeover day when 17,500 struts were expected. In comparison, the tool enabled targets on tool changeover days to be five per cent more accurate than the current planning method. The tool provides more accurate targets for full productions days, with an average target of 3.5 per cent above that which was actually achieved. This is in comparison with an average target of 7.3 per cent above that which was achieved, had a target of 21,000 been set for all strut types. The major advantage of the tool is its ability to determine specific targets for each strut type, based on the historical OEE performance for each strut type.
Tool limitations:
The accuracy of this tool, and of all subsequent tools, is highly dependent on the OEE data used. It is not known which OEE data time period should be used in the tool when planning production. It is recommended that OEE data with at least a three-month trend is used as, over time, the forge's performance averages towards a trend. As the forge's uptime and changeover time become more consistent, the accuracy of the planning tool will improve.
5.2.4 WIP storage and CNC monthly planning tool
Purpose:
This tool calculates the maximum amount of WIP that should be held within the WIP storage for a particular month. The tool aims to synchronise the production line by controlling how much WIP the CNC cells should pull from the WIP storage area.
Overview:
The tool goes through the following major steps to determine how much WIP should be held in the WIP storage area, and the required production rates of the CNC cells:
1. Adjusts the user's input of the required CNC quantities for each CNC machine according to specific OEE quality data.
2. Determines the total time needed by each CNC cell to machine its required quantity of struts, while considering each cell's OEE availability and performance data. The tool will calculate whether the CNC cell will be idle or will require overtime during the month to meet the required production quantity.
3. The total CNC quantities for the month are separated by the tool into WIP batches. The number of batches depends on the number of planned forge changeovers for each strut type in the month.
4. The WIP storage area is sized, having considered:
4.1 The quantity of struts a CNC cell will process when the forge is producing the same strut at the same time.
4.2 A safety buffer must be kept to cushion production variability caused by both the CNC cells and the forge. The safety buffer is sized, using a desired confidence interval chosen by the user and the production output standard deviations of the CNC cells and the forge.
Tool performance:
Table 5 shows the key outputs that the tool generates. The input data used for these outputs was the mean monthly CNC demand for the past year, with two forge changeovers assumed for each strut type. For the WIP storage area's safety buffer, a confidence level of 95 per cent was selected. The maximum WIP storage buffer sizes in Table 5 should be incorporated into the current production plan.
Tool limitations:
1. The tool is unable to determine the average WIP levels that will be held in the WIP storage area during CNC production.
2. The sizing of the WIP storage area depends on how long it takes the forge to produce the other strut types.
5.3 Fixed forge sequencing
To prevent erratic fluctuations and an accumulation of WIP levels in the WIP storage area, fixed sequencing of struts on the forge should occur. This will reduce production variability and allow WIP inventory to be depleted and restocked to similar levels each time the forge cycles through the different strut types.
To prove the effect that fixed forge sequencing can have on the OEM's WIP levels, a simulation was conducted in the OEM's production planning document. Two fixed sequences, consisting of eight tool changeovers per month, were simulated over a three-month period. The sequences were determined using mixed model scheduling, with proportional demand having been considered. The monthly strut sequences simulated were (by strut type):
1. Scenario 1: A-B-C-D-E-A-B-C
2. Scenario 2: A-B-C-D-B-A-E-C
3. Current planned forge sequence: D-A-C-B-A-E-C-B-A-C-B-A-E-C-B-A-C
For the simulation, the forging quantities from the forge monthly planning tool were used, with each strut type run until it reached the required batch sizes shown in Table 3. Each month was assumed to have 21 normal working days, with forge changeovers assumed to take 3.5 hours. The forge's output on a full production day and die changeover day did not exceed the expected output values calculated in Table 3.
The initial WIP storage buffer sizes were set to the calculated buffer sizes determined by the WIP storage and CNC monthly planning tools. The CNC cells were assumed to produce the daily quantities shown in Table 5. Production on a CNC cell was stopped for a specific month when the CNC cell reached the required monthly demand quantity.
The effects of using a fixed forging sequence are clearly apparent in Figure 8, which shows the changing WIP storage levels for strut type A for the different simulated scenarios. The fixed sequence allows for smaller peaks and troughs in WIP levels, with the fluctuations in WIP levels dampened in comparison with the current planned forge sequence. Scenario 1 provides the lowest variability in WIP levels, with the WIP storage area never being completely depleted of WIP at any time. Scenario 2 resulted in slightly more variability in WIP levels, depleting WIP inventory for strut type A at one stage.
Table 6 provides a summary of the mean WIP levels for each strut type for the scenarios considered. Included in the table are the actual mean WIP levels for the WIP storage area for the three-month period of analysis.
In comparison with the actual WIP levels kept in WIP storage, both fixed sequence scenarios are projected to reduce the cost of WIP on the factory floor by over 20 per cent, while reducing average WIP by over 37,000 struts. The current planned forging sequence projects a 34 per cent rise in WIP over the next three months. It can be concluded that the use of fixed sequencing will help to synchronise the OEM's production line by lowering WIP levels and reducing variability.
5.4 Proactive production strategy
For the OEM to synchronise its production line fully, it has to consider the internal production lead time it takes to produce a strut for a specific customer order. Production for a particular customer order only starts at the beginning of the month in which the customer order must be shipped, resulting in the corresponding orders only arriving in finished goods (FG) in the middle of a current month.
The OEM needs to move away from its current reactive production strategy, where the shipped finished goods quantities do not correspond to the original customer order, contributing to the internal bullwhip effect in the plant. This situation has partly arisen because customers only confirm their required order sizes just days before a new production month. The OEM knows that their customers will order from them every month, but they are uncertain of the total order quantity. There is, however, a certain baseline order quantity that customers will always order, so the OEM can start production without knowing the total order quantity.
If the OEM ran a minimum of eight forge changeovers a month, they could produce the baseline order quantities for strut types A, B, and C without having the confirmed customer orders. The baseline forge quantities could then be produced about 10 days before the new production month, as shown in Figure 9. Once the customer order was confirmed, the OEM would then forge the outstanding order quantities, having forged the first three strut types in the forge sequence of A-B-C-D-E-A-B-C.
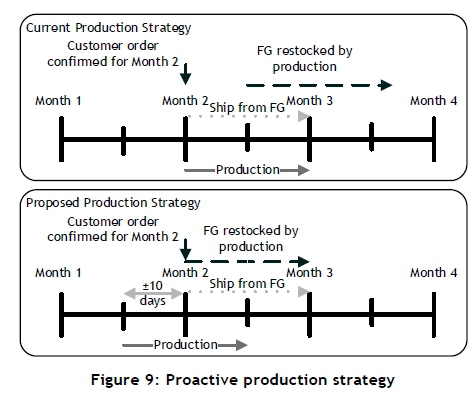
The effect of this approach is that the baseline order quantities would have started arriving in finished goods at the start of the required shipping month, as shown in Figure 9. Thus the proactive production strategy of forging the baseline orders enables the struts that are shipped at the start of a current production month to correspond to the customer order from which they were placed. This strategy would enable the OEM to produce exactly to customer order requirements, while not having to consider its entire production lead time.
For the proactive strategy to work it would require lower customer order variability than currently occurs, with eight tool changeovers easily achievable on the forge. It is acknowledged that there is an element of risk involved in adopting the new proactive production strategy. However, this approach would greatly reduce WIP levels, and enable the shipping of finished goods to correspond to the original customer order.
5.5 Model evaluation
The planning tools allow for better batch-sizing closer to the customers' requirements, with a partial reduction in WIP and finished goods levels immediately achievable. However, a significant reduction in WIP levels can only be achieved once the frequency of tool changeovers on the forge increases. The accuracy of the proposed MS Excel tools is limited to the variability in OEE data. Maintaining a synchronised production line relies on the user of the tools ensuring a smooth production plan, with all tools designed to be sufficiently versatile to adjust to the changing inputs.
6 DISCUSSION AND CONCLUSION
This study has shown how production planning and practices within unsynchronised production can lead to high levels of inventory and long internal lead times, the importance of reducing these having been discussed in the literature review. The causes of unsynchronised production are often entrenched practices within an organisation that were designed to accommodate inefficiencies within the process instead of addressing them.
A more accurate production plan will improve the control and flow of inventory within a plant, enabling different production areas to become more synchronised. The model has shown how the inclusion of OEE data in planning production can enable more realistic production targets to be set and expected output volumes to be anticipated. It has been demonstrated that fixed production sequencing reduces variation in WIP levels, enabling a controlled cyclic rise and fall of inventory levels. To achieve a synchronised production line it is crucial that the internal lead time is accounted for, with the shipped product corresponding to the original customer order.
Although this study is theoretical, and it was not within its scope to implement any of the changes proposed by the model, the benefits of changing thinking around synchronisation are clear. Improving the accuracy of production planning requires no capital expenditure, and can result in substantial financial gains through the reduction in inventory held in a plant.
REFERENCES
[1] M. R. Salman, R. van der Krogt, J. Little,& J. Geraghty, "Applying lean principles to production scheduling," ed: Academia.edu, 2007. [ Links ]
[2] C. Becker & A. Scholl, "A survey on problems and methods in generalized assembly line balancing," European journal of operational research, vol. 168, pp. 694-715, 2006. [ Links ]
[3] T. Ohno, Toyota production system: beyond large-scale production: CRC Press, 1988. [ Links ]
[4] J. Heizer & B. Render, Principles of Operations Management. London: Pearson, 2011. [ Links ]
[5] J. Bicheno & M. Holweg, The new lean toolbox. Cardiff: Picsie books, 2008. [ Links ]
[6] J. P. Womack & D. T. Jones, Lean Thinking: Banish the waste and create in your corporation. London: Simon and Schuster, 1996. [ Links ]
[7] E. M. Goldratt, The goal: a process of ongoing improvement: North River Press, 1992. [ Links ]
[8] S. Krishnan, "Inventory valuation under IFRS and GAAP," Strategic Finance, vol. 93, p. 51, 2012. [ Links ]
[9] D. Kahneman, D. Lovallo, & O. Sibony, "Before you make that big decision," Harvard business review, vol. 89, pp. 50-60, 2011. [ Links ]
[10] D. Friedman, K. Pommerenke, R. Lukose, G. Milam, & B. A. Huberman, "Searching for the sunk cost fallacy," Experimental Economics, vol. 10, pp. 79-104, 2007. [ Links ]
[11] J. K. Liker, The Toyota way. New York: McGraw Hill, 2004. [ Links ]
[12] F. R. Jacobs, R. B. Chase & R. Chase, Operations and supply chain management, 13 ed.: McGraw-Hill Irwin, 2010. [ Links ]
[13] E. Kay, "Buffer stocks in automatic transfer lines," The international journal of production research, vol. 10, pp. 155-165, 1972. [ Links ]
[14] J. Bicheno & M. Holweg, The Lean toolbox: The essential guide to Lean transformation: Picsie Books, 2008. [ Links ]
[15] I. Karjalainen, R. Domingo, R. Alvarez, M. Melodía Pena & R. Calvo, "Materials flow improvement in a lean assembly line: a case study," Assembly Automation, vol. 27, pp. 141-147, 2007. [ Links ]
Submitted by authors 26 Sep 2015
Accepted for publication 9 Jun 2016
Available online 12 Aug 2016
* Corresponding author dieter.hartmann@wits.ac.za
# The author was enrolled for an BScEng (Industrial) degree in the School of Mechanical, Industrial and Aeronautical Engineering, University of the Witwatersrand.
1 Liker uses the powerful analogy of inventory being the water that hides rocks in a lake; it is worth reading for enrichment.

