


Services on Demand
Article
 English (pdf)
 Article in xml format
 Article references
Indicators

Related links
-
 Cited by Google
 -
 Similars in Google
Share

 Permalink
South African Journal of Industrial Engineering
On-line version ISSN 2224-7890
Print version ISSN 1012-277X
S. Afr. J. Ind. Eng. vol.27 n.2 Pretoria Aug. 2016
http://dx.doi.org/10.7166/27-2-1381
FEATURE ARTICLE
Using expanded real options analysis to evaluate capacity expansion decisions under uncertainty in the construction material industry
A.M. Momani*; T.H. Al-Hawari; R.W. Mousa
Department of Industrial Engineering Jordan University of Science and Technology, Jordan
ABSTRACT
Capacity expansion generally requires large capital expenditure on illiquid assets. Therefore, decisions to enlarge capacity must support the organisation's strategic objectives and provide valuable input for the budgeting process. This paper applies an expanded form of Real Options Analysis (ROA) to generate and evaluate capacity expansion strategies under uncertainty in the construction material industry. ROA is applied to different expansion strategies associated with different demand scenarios. Evaluating a wider variety of strategies can reduce risk and sponsor decisions that maximise the firm's value. The case study shows that the execution of a lead expansion strategy with 10-year intervals under a 50 per cent demand satisfaction scenario produces superior results.
OPSOMMING
Die uitbreiding van kapasiteit vereis gewoonlik groot kapitaalbesteding op nie-likiede bates. Besluite om kapasiteit te vergroot moet dus die organisasie se strategiese doelstellings ondersteun en waardevolle insette tot die begrotingsproses lewer. Hierdie artikel pas 'n uitgebreide vorm van ware keuse analise toe om die kapasiteit uitbreidingstrategieë te genereer en te evalueer. Hierdie strategieë is vermoeid met onsekerheid in die boumateriaal industrie. Ware opsies analise (Real Options Analysis) is toegepas op verskillende uitbreidingstrategieë wat met verskillende vraagscenario's verband hou. Deur 'n groter verskeidenheid van strategieë te evalueer kan risiko verminder en besluite lewer wat 'n firma se waarde maksimeer. Die gevallestudie toon dat die uitvoer van 'n uitbreidingstrategie met tien jaar intervalle onderhewig aan 'n 50 per sent vraagbevrediging scenario die beste resultate lewer.
1 INTRODUCTION
The construction sector contributes significantly in scale and share to gross domestic product (GDP), economic growth, and economic development inboth developed and developing countries [1]. Construction provides the necessary infrastructure, residences, and non-residential buildings that define a nation's degree of development. According to the US Census Bureau of Statistics [2], the US construction industry generated revenues of US$962 billion during 2014, of which US$686 billion were contributed by the private sector.
The construction industry is an important customer for manufacturers of steel, cement, pipes, paint, concrete, stirrups, and wires, who are required to meet growing demand by enlarging production capacity. Enlarging capacity requires them to consider numerous uncertainties over an investment planning horizon, including market demand, volatile raw material prices, variations in operational costs, and unstable discount rates [3]. In addition, capacity enlargements compete for limited funds and are often irreversible. Therefore firms must assess the optimal size and timing of such investments [4]; they generally use Net Present Value (NPV) calculations for this purpose [5]. Mittal [6] noted that NPV is a simple model that summarises all of an investment's financial information as one value.
Unfortunately, NPV calculations generate fixed, discrete cash flows unsuited to estimating the effects of unpredictable events when making decisions involving irreversible investments [7]. Real Options Analysis (ROA) overcomes some of these disadvantages by granting managers flexibility to execute, delay, or cancel projects during the investment period. Unlike NPV, ROA incorporates uncertainty by considering changes to investment decisions early in the planning process [8].
This study proposes an expanded form of ROA to generate and evaluate capacity expansion strategies under uncertainty in the construction material industry. It employs Monte Carlo Simulation (MCS) to evaluate and rank a spectrum of capacity expansion decisions and their expected returns, given uncertain demand and material prices. Our method enables managers to identify optimal capacity expansions based on future expectations and risk.
2 LITERATURE REVIEW
2.1 Capacity planning
Long-term expansions of operating capacity require irreversible, lumpy, and protracted investments. They also present the problem that both excess capacity and capacity shortages are undesirable outcomes [9,10]. Extensive earlier studies focusing on capacity planning have employed stochastic programming, integer programming, linear programming, and other optimisation methods. For example, Geng et al. [11] proposed a two-stage stochastic programming model that considers uncertain demand and capacity. They found that profit is more sensitive to variations in capacity than to variations in demand. Ceryan and Koren [10] employed mixed-integer programming to optimise capacity planning under conditions of volatile demand. They identified investment costs, product marginal revenues, demand variability, and planning horizons as factors affecting investment decisions. Chou et al. [12] evaluated reactive and conservative capacity expansion strategies for a semiconductor plant. The reactive strategy added a capacity increment whenever demand exceeded production capacity, without considering the demand realisation during the capacity lifetime. The conservative strategy employed real options through a binomial lattice method in which optimal capacity was determined on the basis of cash flows. Suryani et al. [9,13] employed structural and parametric methods to suggest a dynamic framework for capacity planning. The former implies the use of annual growth rates to forecast demand. The latter depends on relations between industry-specific parameters, such as GDP and demand.
However, such sophisticated programming methods are complex and costly, and stochastic programming occasionally suggests impractical solutions. Therefore, Sodhi and Tang [14] and Mittal [6] suggested the less sophisticated and simpler MCS, which is effective in reporting risks associated with capacity and other business planning. This technique enables the introduction of uncertainty into the system by representing input parameters with probability distributions. No restrictions inhibit the number of input risks in the model. MCS generates a large number of runs, each combining events that might occur for each chosen path. The simulation result is a probability distribution that summarises all outputs in the distribution spectrum [15].
2.2 Real Options Analysis(ROA)
According to Kashani [16], ROA is identified as the ability to exercise financial options on tangible assets. ROA was introduced in 1977by Stewart Myers [17], who coined the term 'real options' in real assets financial valuation under uncertainty and managerial flexibility. Only a few studies focused on ROA, and it was regarded as a strategy tool until the mid-1990s [8,18-21]. Since then, scholars have applied ROA to numerous economic sectors. For example, Ozorio et al. [22] employed ROA to evaluate the switch option of a hypothetical integrated steel plant composed of a blast furnace and a hot laminator. Zhu [23] conducted ROA with least squares MCS to estimate the investment value of a nuclear power generation plant. They found that the tool could value the risk associated with this type of huge investment. Other studies have applied ROA to hydropower energy [6], the oil industry [7], mining projects [4], and agriculture [24].
3 DECISIONS UNDER UNCERTAINTY
Uncertainty is the state of having limited knowledge about present conditions or future outcomes. Several methods suggest the appropriate actions to be undertaken under conditions of uncertainty and risk. These include expected values, Maximin criteria, utility theory, decision trees, influence diagrams, stochastic dominance, mean-standard deviation, and scenario planning [25]. We now describe the two methods used in this study: stochastic dominance and mean-standard deviation.
Stochastic dominance helps to identify the option with the highest monetary value when considering probabilistic distributions and uncertainty [6,7,25]. Stochastic dominance can be identified by plotting the cumulative probability distribution function (CDF) that demonstrates the probability of an option's value being less than a predetermined value. CDFs exhibit first-degree or second-degree stochastic dominance. The former concerns options with uncrossed CDFs. The latter is an option with the most rightward CDF, which poses the least probability of descending below a preset trigger point. Second-degree stochastic dominance concerns intersecting CDFs. When CDFs intersect, the first form of stochastic dominance remains meaningful only to an extent. Assume that the CDFs of two options, A and B, intersect at value c. Before c, A is assumed to be stochastically dominant over B; after c, the latter is assumed to be dominant. To identify absolute stochastic dominance, the area between the two curves is estimated before and after the c value, and the option with the highest area between the two curves is assumed to be stochastically dominant.
Mean-standard deviation is useful when comparing too many alternatives with normal or close-to-normal probability distributions. This method may reduce the number of weak alternatives at the beginning of the decision process. Alternatives are screened by plotting mean values against the standard deviation. Managers prefer to maximise the monetary value by choosing the option with the highest mean, and to minimise the risk by choosing the option with the least standard deviation [25].
4 PROPOSED METHODOLOGY
We propose a four-step method to evaluate capacity expansions under uncertainty in the construction material industry. Step one is to forecast the incremental demand based on the expected growth of the area under construction and on the company's market share. Step two is to employ an expanded ROA to generate capacity expansion strategies. We expand the concept of ROA by applying traditional ROA to different capacity expansion strategies associated with different demand satisfaction scenarios. Step three is to calculate financial indicators and incremental cash flows. Step four is to evaluate capacity expansion strategies, considering anticipated uncertainties. We use MCS and cash flow analysis to evaluate capacity expansion strategies, in addition to probabilistic NPV decision criteria. The subsections below elaborate the details.
4.1 Step one: Forecast the incremental construction material demand
Construction materials are capital goods used in construction. Thus the demand for construction materials is derived from demand in the construction industry. Three types of data are required to forecast incremental construction material demand:
1. Expected growth of the construction sector, measured by annual increases in the area under construction.
2. Consumption norms for each type of construction material per square meter (m2) of the area under construction.
3. The material provider's anticipated market share.
Construction growth is estimated by documenting reliable long-term relations among independent factors that are easier to predict. Previous studies have considered that factors such as economic growth, population, saturation, urbanisation, and investment growth influence construction growth [9,26,27]. Regression analysis determines the best-fitted relations. To incorporate risk and uncertainty, extensive historical data on the chosen independent factors are collected and fitted to derive input probability distributions. These distributions are aided by MCS in the regression function to forecast the probable annual construction area demand. Depending on this forecast, the national demand for every type of construction material can be estimated on the basis of its intensity of use.
4.2 Step two: Generate capacity expansion alternatives
Using expanded ROA, alternative capacity expansion investments are generated in four stages; at each stage, the number and type of choices do not depend on previous choices (Figure 1). Stage 1 is to decide the demand satisfaction levels to be considered. For a given stochastic demand Di, the level of satisfaction dj lies between the upper and lower limits of the demand probability distribution. Each demand satisfaction scenario suggests different capacity requirements and resource allocations. At Stage 2, the material provider decides whether to front-run an expected demand (adopt a lead strategy) or trail it (a lag strategy). In the latter case, the provider should expect to lose sales. At Stage 3, the provider determines the duration of expansion increments, which can span from one year to the entire planning horizon. Stage 4 is to identify feasible real options to be considered (e.g., to execute, defer, cancel, abandon, or pre-empt). This study proposes a pre-emptive lag strategy that enables the material provider to front-run a demand by initiating expansion intervals one year before their due dates. This option differs from the lead strategy, as the management remains risk averse, but new information or circumstances encourage it to take the pre-emptive option.
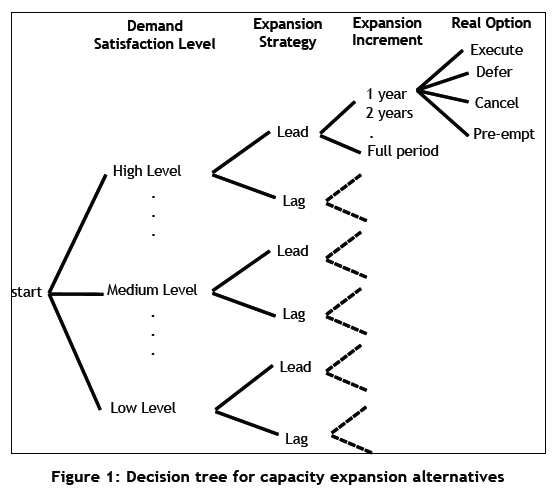
A decision tree generates the number of alternatives determined by the number of choices at each stage. An alternative is a plan for capacity expansion that states the option to be chosen at each stage. For example, if the management chooses to satisfy an intermediate level of demand (50%) under a lag strategy, it may defer the first expansion increment for one year and implement all other expansions at five-year intervals.
4.3 Step three: Estimate financial indicators and cash flows
After generating feasible capacity expansion strategies, the next step is to identify cash flows from each strategy. Incremental cash inflows include increases in sales and the expected terminal value of the enhanced capacity. Incremental cash outflows include the initial investment and increased costs for operating and maintaining the acquired assets [27]. The next subsections elaborate the details.
4.3.1 Estimate annual incremental revenue
The annual incremental revenue is the additional annual cash inflows generated by launching an investment project. It is calculated by multiplying the expected selling price by the minimum value lying between the estimated annual demand and annual production capacity. Equation 1 calculates the total expected annual revenue for all products in year t (Rt) as follows:

Dt,n: Demand for product n during year t
PCt,n: Production capacity for product n at year t
Pt,n: Product n selling price during year t
4.3.2Estimate investment cost
The investment cost is the expected future expenditure associated with each increment of capacity along the planning horizon. It includes the costs of acquiring machinery, land and construction, and development. Machinery acquisition costs include the price of equipment plus delivery, insurance, testing, calibration, and training. Construction costs include design and building costs and fees. Development and pre-acquisition costs include all research and development costs, including preliminary market and cost studies, engineering services, and legal fees. Equation 2 calculates the total expected investment for all products at year t (ICt) as follows:

Mt,n,j: Number of machines for product n at year t associated with satisfying a specified level of demand (dj)
ACt,n: Machinery acquisition costs corresponding to product n at year t
LPt,n: Lost profit for product n at the end of year t.
BCt: Building and construction costs associated with expansion intervals at year t DCt: Development costs associated with expansion intervals at year t
The number of machines (capacity) required to satisfy a specified level of demand for product n at year t is calculated by the following machine fraction equation [29]:

St,n: Standard time per unit produced of product n (h) during year t
dt,n,j: Annual specified demand satisfaction for product n during year t
Et,n: Machine n performance expressed as a percent of standard time during year t
Ht,n: Annual availability per machine of type n (h) during year t
Rt,n: Machine n reliability expressed as a percent of uptime during year t
4.3.3Estimate direct material cost
The direct material cost is the cost of materials and components used to create a product. In relation to the production volume, it is calculated by multiplying the quantity of raw materials required to produce a customer's order (the minimum value lying between the estimated annual demand and annual production capacity) by expected raw material prices. It is governed by two uncertainties: demand and raw material prices. These uncertainties are incorporated into the capacity expansion evaluation by collecting and fitting historical data to find the appropriate probability distribution. Equation 4 calculates the total direct material cost for all products at year t (DMCt) as follows:

Dt,n, PCt,n: As defined before
Wn: Weight per unit of product n
MPt,n: Raw material price per unit weight of product n during year t (including freight and sales taxes)
4.3.4Estimate annual operating costs
The annual operating costs include the additional labour, energy, maintenance, administrative, depreciation, and overhead costs associated with intervals in capacity expansion. The annual labour costs depend on the number of machines installed, for each requires defined numbers of workers and skills. Equation 5 calculates the total labour costs (LCt) during year t as follows:

Mt,n:As defined before
LNn: Number of labour required for machine n
LSn: Annual salary (including benefits) for workers operating machine n
INn: Annual salary increase (percentage)
The annual energy cost for each machine type is calculated by multiplying the expected annual production by the unit standard time, energy consumption rate, and projected energy prices. Equation 6 calculates the total annual energy costs (ECt) for all machine types as follows:

Dt,n, PCt,n, St,n: As defined before
ECOt,n: Energy consumed per machining hour for machine n during year t (Kw/h)
EPt,n: Price of energy per unit consumed ($/Kw)
The annual maintenance cost represents the additional annual expenditures on maintenance and replacement of facilities and machinery at year t. The average cost per machine hour or a percentage of investment can be used to estimate it.
The depreciation cost is the erosion in accounting value of fixed assets over time. Straight line depreciation over an asset's useful life is used to calculate the annual fixed depreciation (DEPt) for buildings and machinery associated with the capacity expansion, as shown in Equation 7.

IV: Investment value for machine n ($) SV: Salvage value for machine n ($) LS: Life span for machine n (years)
4.3.5 Estimate net cash flows
Net cash flows of capacity expansion strategies are estimated by combining estimates of cash inflows and outflows associated with all expansion intervals for each year of the planning horizon. Future cash flows must be discounted at an appropriate rate, and be restated as present values to incorporate the time value of money. The project's expected NPV is the summed present values of all future cash flows from the investment. Equation 8 demonstrates the NPV calculation of each expansion strategy. We use MCS to generate stochastic NPV by drawing a large number of simulated values from the probability distributions of uncertain inputs.

t: Year index
Rt, ICt, DMCt, DEPt: As defined before
OCt: Operating costs include labour, energy, maintenance, and overhead at year t
Taxt: Predefined tax on net cash flow at year t
r: Risk neutral discount rate
4.4 Step four: Evaluate capacity expansion alternatives
With net cash flow and stochastic NPV for each capacity expansion strategy compiled, the next step is to evaluate and rank alternatives to optimally allocate capital and maximise firm value. High-demand satisfaction scenarios and lead expansion strategies are generally associated with high investment and production costs,and with greater customer satisfaction and fewer lost sales. In contrast, low-demand satisfaction scenarios and lag expansion strategies are generally associated with low investment and production costs, but they might not satisfy customer demand and might forfeit market share. Thus the management's objective is to identify the optimal capacity expansion strategy that maximises NPV while minimising associated risks or uncertainty. Finally, the sensitivity analysis is used to examine how robust the choice of an alternative expansion option is in the face of changes in the input values used in the analysis. This can be carried out by setting the expected NPVs as the resulting variable and changing each of its precedence variables, such as investment costs, operating costs, revenues, tax rate, depreciation, and so forth. By tracing back all of these input variables, we can change each one by a present amount and see the effect on the resulting NPVs and the promoted investment options. The most sensitive input variables that might affect the evaluation results are reconsidered for more accurate investigation and estimation.
4.5 Benefits and limitations
Traditional methods to evaluate investments, such as NPV, do not promote inclusive investment decisions when projects are burdened with degrees of uncertainty that demand financial flexibility. The proposed methodology provides a systematic, learnable, and repeatable step-by-step procedure for evaluating capacity expansion strategies under uncertainty in the construction materials industry. It expands the concept of ROA by applying traditional ROA to different capacity expansion strategies associated with different demand satisfaction scenarios. Evaluating a wider variety of strategies can reduce risk, enhance managerial flexibility, and sponsor decisions that maximise the firm's value. The proposed methodology enables the company's managers to enumerate the rewards and risks of multiple strategies during uncertainty and take appropriate action. Constructing reliable statistical relations by employing more predictable independent variables (e.g., economic growth) enhances the long-term forecasting of uncertain demand for construction materials. MCS and stochastic evaluation methods facilitate a more informed choice among investment opportunities, based on expected returns and the degree of uncertainty associated with different options. One the other side, the main disadvantage of this methodology is its reliance on quantitative data and on the existence of reliable probability distributions, which can be a time-consuming task - and such data are sometimes difficult to obtain. Moreover, although the assumptions about investment costs, operating costs, selling price, and discount rate help to simplify and apply the model, it can lead to an inappropriate and unrealistic display of the investment options if not estimated and defined properly and carefully.
5 CASE STUDY
This section demonstrates the application of the proposed methodology by 'Alpha Company', a construction material manufacturer in Northern Jordan. Its identity is concealed to protect the confidentiality of financial data. Alpha Company produces stirrups, single wires, double-twisted wires, and nails. Each product has separate manufacturing processes and machines. Increased market demand forces Alpha Company to expand capacity to sustain its market share and maximise firm value. Its share of the local market is 20 per cent for nails and wires and 15 per cent for stirrups. Market shares are expected to hold through the 20-year planning horizon. Alpha Company's preliminary analysis indicates that the facility has sufficient production capacity over the planning horizon for all products except stirrups and single steel wires. The following subsections employ MCS and expanded ROA to present and assess alternative capacity expansion investments for both products, considering anticipated uncertainties in demand and raw material prices.
5.1 Step one: Forecast the incremental construction material demand
Because a strong intersectional connection links basic industries with construction and building materials, we use economic growth measures such as GDP per capita (GDPPc) to forecast growth in construction. Any country's construction growth can be volatile, but GDPPc exhibits relatively stable growth rates with less volatility, making it more reliable for long-term forecasts. The next subsections explain our procedure to forecast Alpha Company's demand for construction materials.
5.1.1Estimating annual GDPPc across the planning horizon
The expected annual GDDPc is estimated using the following equation:

GRt: the GDPPc growth rate at year t (percentage)
Country-specific GDPPc growth data are available from the World Bank's economic development indicators databank [30]. Data are available for Jordan from 1980 onwards, a time-span conducive to robust forecasts. We fitted historical data to derive a lognormal probability distribution for Jordanian GDPPc growth. The mean is 4.93, and the standard deviation 3.57. We then used MCS to sample random variables within this distribution and calculated expected stochastic GDPPc for these values as per Equation 9. We repeated this process from the first to the final year of investment, producing a set of probability distributions for expected GDPPc covering the planning horizon.
5.1.2Estimating expected annual construction area
Regression fits the relation between the dependent parameter- expected annual construction area - and the independent parameter - expected annual GDPPc. Data for Jordanian construction are from the Jordanian Department of Statistics [31]. Construction area statistics during 2000-2012 are subdivided into residential and non-residential. The coefficient of determination (R2) indicates the goodness of fit on a Microsoft Excel spreadsheet. For residential and non-residential construction, the natural logarithm relation yielded the most promising results, with multiple determination coefficients of 96 per cent and 76 per cent respectively (Equations 10 and 11). Probability distributions for expected GDPPc over the planning horizon are used as inputs for MCS to generate new probability distributions for expected residential and non-residential construction over the planning horizon, based on these regressions.


RCA: Residential construction area
NRCA: Non-residential construction area
5.1.3 Estimating annual construction material demand
We used the resulting forecasts for both residential and non-residential construction to calculate the local market demand, based on the typical intensity of use. Questionnaires and interviews with contractors and builders collected data for the quantities of steel products required for every 100 m2 of the area under construction. The expected local market demand was then multiplied by the facility's market share to determine each facility's market demand over the planning horizon.
5.2 Step two: Generate capacity expansion alternatives
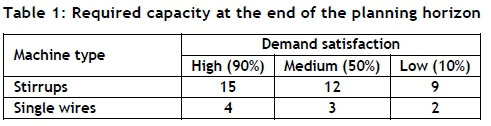
We generated 72 capacity expansion alternatives by considering three demand satisfaction scenarios: high (90%), medium (50%), and low (10%). We investigated two capacity expansion strategies (lead and lag) and expansion intervals of 3, 5, 10, and 20 years. We examined four real options: execute, defer, cancel, and pre-empt. For each capacity expansion strategy, we estimated the required capacity over the project's planning horizon using Equation 3, the machine fraction equation. Table 1 presents the required capacity at the end of the planning horizon (2035) for different demand satisfaction scenarios.
The next subsections demonstrate lead and lag capacity expansion strategies, capacity increment plans, and the proposed real options.
5.2.1Lead and lag capacity expansion strategies
For each demand satisfaction scenario, we evaluated lead strategies that employ different intervals between expansions (3, 5, 10, and 20 years) in the capacity incremental plans. The lag strategy proposes capacity increments similar to the lead strategy, but without a 20-year lag plan. Although the planned capacity increments have the same target capacity at the end of the year 2035, the intervals and the size of increments differ among alternatives.
5.2.2ROA
ROA introduces flexibility into evaluations of capacity expansions. As indicated above, we consider options to execute, defer, cancel, or pre-empt. Options to execute examine the uncertain environment with immediate execution of sequential capacity expansions without modification. Options to defer enable postponing the initial investment increment by one year. Machinery and workers are assigned extra shifts and overtime at a 50 per cent increase in salaries. Options to cancel enable the management to demonstrate the effect of cancelling the first investment increment, where the investment is allowed for the next planning intervals. Options to pre-empt are available only under the lag strategy, which enables the management to front-run the demand. The effects of pre-empting the first step by one year on each lag capacity expansion strategy are considered.
5.3 Step three: Estimate financial indicators and cash flows
We estimated incremental revenues, direct material costs, investment costs, operating costs, and net cash flows for each capacity expansion strategy, based on the methodology and equations in Section 4.3. We calculated the annual incremental revenue for each product by multiplying its expected selling price by the minimum value lying between the estimated annual demand and annual production capacity. We assumed that the initial selling price of single wires (US$2.6/roll) would simultaneously rise with Jordan's inflation rate. Stirrups are sold in metric tons, and we assumed that their price would track raw material's prices plus an 8.3 per cent mark-up. Two uncertainties govern direct material costs: demand and raw material prices. Historical data for wire rod steel prices are from the World Bank's Global Economic Monitoring Commodities dataset [32] and were tested using a distribution identifier. Data follow a three-parameter Weibull distribution. The threshold parameter is 198.8, the shape parameter is 0.812, and the scale parameter is 135.92.
After collecting the necessary inputs and using MCS, we combined stochastic estimates of cash inflows and outflows and discounted at a 10 per cent risk-neutral rate to calculate NPV for each investment opportunity. MCS was performed via the XLsim Microsoft Excel add-In. We performed 10,000 runs to assure reliable results. Table 2 presents the means and standard deviations of expected NPVs for different capacity expansion alternatives under different demand satisfaction scenarios.
5.4.1 High-demand satisfaction scenario
The high-demand satisfaction scenario requires 15 stirrups machines and four single steel wire drawing machines by the end of the planning horizon. We first used the mean standard deviation approach to determine alternatives that maximise the expected (mean) NPV while minimising the associated risk (standard deviation). These alternatives are presumed to lie on the efficient frontier. The mean-standard deviation scatter plot - after omitting options with negative values - appears in Figure 2. The symbols E, D, C, and P represent real options to execute, defer, cancel, and pre-empt, respectively.
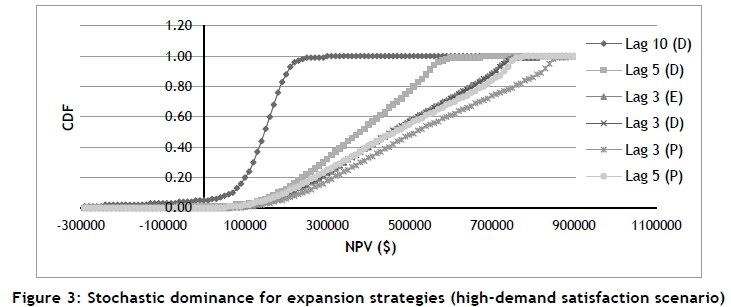
Under a high-demand satisfaction scenario, the lag strategy generally indicates better results than the lead strategy. Regardless of the capacity expansion strategy, the high-demand satisfaction scenario prefers expansion alternatives with shorter capacity intervals (three years). The lead expansion strategy offers shorter intervals and reduces investment and production costs. In the lag strategy, shorter intervals reduce lost sales via faster responses to shortages in planned production capacity. The efficient frontier includes the following alternatives: the deferral option and a lag expansion strategy with ten-year, five-year, and three-year intervals, and the pre-empt option and a lag expansion strategy with three-year and five-year intervals. The efficient frontier gives more flexibility in choosing the appropriate investment strategy. At one extreme, the pre-empt option and lag expansion strategy with three-year intervals offers a high expected NPV and high risk. At the other extreme, the defer option and lag expansion strategy with 10-year intervals offers low expected NPV and low risk. Managers' risk aversion determines their choice.
However, efficient frontier alternatives could be further evaluated using stochastic dominance. Figure 3 demonstrates stochastic dominance for the CDFs. It appears that the pre-empt option and lag expansion strategy with three-year intervals exhibits first-degree stochastic dominance over all other alternatives. For any NPV, this alternative offers the smallest probability of declining below that NPV level.
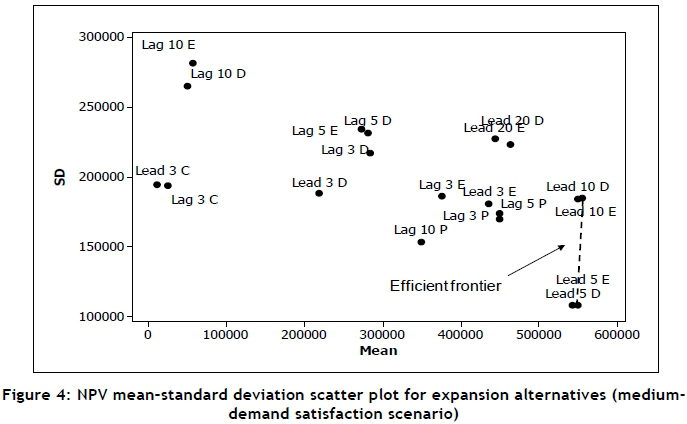
5.4.2 Medium-demand satisfaction
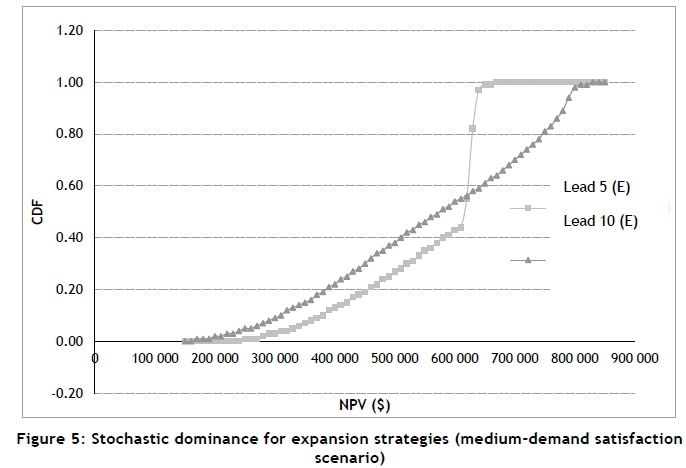
This demand satisfaction scenario requires 12 stirrups machines and three single steel wire drawing machines by the end of the planning horizon. Figure 4 illustrates the NPV mean-standard deviation scatter plot for options with positive NPVs. For a medium-demand satisfaction scenario, results from the lead strategy generally surpass results from the lag strategy. However, the lead strategy produces better results with moderate capacity intervals (5 and 10 years), and the lag strategy rewards shorter intervals (3 years). The efficient frontier includes the following alternatives: the execute option, and the lead expansion strategy with 10-year and 5-year intervals. Again, the choice between alternatives depends on management's risk aversion. We prepared the NPV stochastic dominance plot for these two capacity increment plans, as shown in Figure 5. Comparing the extent to which one alternative dominates the other reveals that the execute option and lead expansion strategy with 10-year intervals has second-degree stochastic dominance over the other capacity increment plan.
5.4.3 Low-demand satisfaction
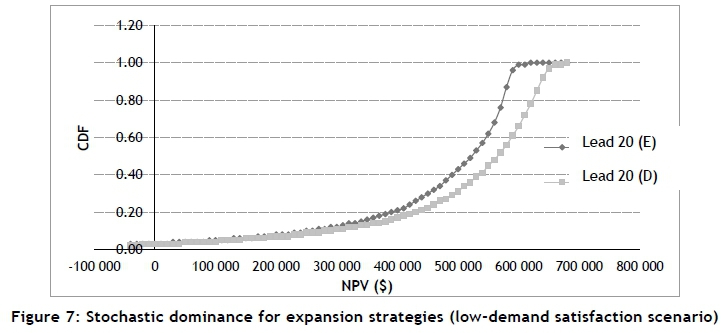
The low-demand satisfaction scenario suggests nine stirrups machines and two single steel wire drawing machines by the end of the planning horizon. The mean-standard deviation scatter plot for options with positive NPVs appears in Figure 6. For this demand satisfaction scenario, the lead and lag strategies indicate competitive results only for long capacity intervals: 20-year intervals for the lead strategy under both execute and deferral options, and 10-year intervals for the lag strategy under the pre-empt option. Three alternatives share the efficient frontier: the deferral option and lead expansion strategy with 20-year intervals, the execute option and lead expansion strategy with 20-year intervals, and the pre-empt option and lag expansion strategy with 10-year intervals. The latter two alternatives yield identical results. We further used stochastic dominance to evaluate efficient frontier alternatives. Figure 7 demonstrates the first-degree stochastic dominance of the first alternative: the deferral option and lead expansion strategy with 20-year intervals.
5.5 Results and discussion
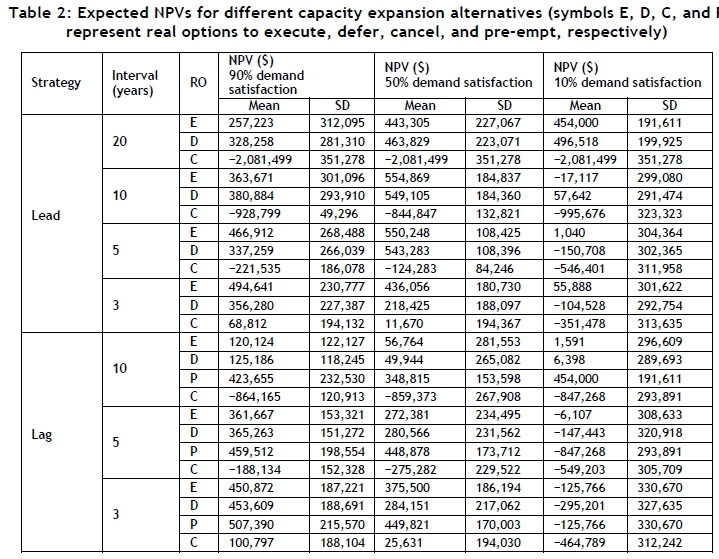
Table 3 summarises the results of our evaluation. The three alternatives show comparable results. However, the execute option with lead expansions of 10-year intervals at 50 per cent demand satisfaction has the highest NPV mean and the least standard deviation. This alternative therefore represents the most attractive investment opportunity among those considered. No stochastic dominance was required. The capacity expansion requirements for this strategy are estimated over the project's planning horizon using Equation 3, the machine fraction equation. Table 4 shows the expansion schedule for this strategy.
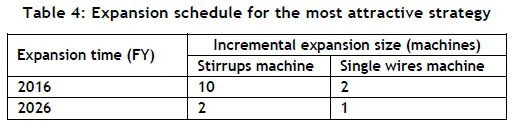
Further examination of the expected NPVs in Table 2 reveals that, for the base case (execute option), the lead expansion strategy produces the best results under a medium-demand satisfaction scenario with moderate expansion intervals (ten and five years). The lag expansion strategy shows the best results under a high-demand satisfaction scenario with brief expansion intervals (three years). This result arises because the strategy permits trade-offs between investment and production costs and lost sales.
Applying the expanded ROA to the base case reveals that the deferral option is preferable to execute for all full-lead and full-lag alternatives, irrespective of demand satisfaction scenarios. For most other alternatives, the execute option yields better results. In addition, the pre-empt option under a lag strategy provides results superior to those provided by execute and defer options, irrespective of demand satisfaction scenarios and capacity increment size. This result is obtained because the pre-empt option reduces the risk of losing sales that is inherent in a lag strategy. Capacity expansion alternatives with longer durations between intervals exhibit the greatest improvement. Finally, the cancel option yields the worst results because of its high expected sales losses.
6 CONCLUSION
This study outlined an expanded model of ROA to generate and evaluate capacity expansion alternatives in a case study involving Jordan's material construction industry. It proposed and validated a multi-step methodology that explains multiple uncertainties in capacity planning. Our conclusions are as follows:
• The expanded ROA model permits an even more general level of managerial flexibility than traditional ROA models, as it enables decision-makers to generate and evaluate a wider variety of capacity expansion alternatives. Considering a greater range of alternatives reduces the associated risk and enhances the quality of the final decision.
• The proposed stochastic model employed MCS to examine all possible scenarios and calculate all possible outcomes. Thus reliable input parameters assure predictable outcomes.
• Stochastic evaluation facilitates a more informed choice between investment opportunities based on expected returns and the degree of uncertainty associated with different options. The efficient frontier under the mean-standard deviation approach gives more flexibility in choosing the appropriate investment, based on the managers' risk aversion.
• In the case study, the most attractive capacity expansion alternatives indicate a robust behaviour and offer the best return, regardless of the uncertainties considered. This result stems from the ability to trade-off between investment and production costs and lost sales.
The limitations of this study suggest directions for future research. First, although we have suggested long-term relations with independent factors, such as economic growth, to forecast stochastic growth of areas under construction, systematic research needs to collect appropriate input parameters and develop reliable probability distributions. This is necessary because the quality of the final decisions depends on the accuracy of the parameters and distributions. Second, for simplicity, we have assumed that all probability distributions in our model are independent. In practice, values of some distributions depend upon the values of others. This dependence should be investigated and incorporated into future research. Finally, future scholars should examine the effect of flexible time between capacity expansion intervals and compound real options on the evaluation process and the capacity expansion decision.
REFERENCES
[1] Agung, I.M. & Wibowo, M.M. 2009. The contribution of the construction industry to the economy of Indonesia: A systematic approach. Discussion Paper, Construction Management, Civil Engineering Department, Diponegoro University, Indonesia. [ Links ]
[2] US Census Bureau. 2015. Construction spending. Retrieved from http://www.census.gov. Accessed on 2 March 2015. [ Links ]
[3] Julka, N., Baines, T., Tjahjonob, B., Lendermanna, P. & Vitanovb, V. 2007. A review of multi-factor capacity expansion models for manufacturing plants: Searching for a holistic decision aid. International Journal of Production Economics, 106(2), pp 607-621. [ Links ]
[4] Auger, F. & Guzman, J. 2010. How rational are investment decisions in the copper industry? Resources Policy, 35(4), pp 292-300. [ Links ]
[5] Ross, S., Westerfield, R. & Jaffe, J. 2012. Corporate finance. 10thedition, McGraw-Hill Education. [ Links ]
[6] Mittal, G. 2004. Real options approach to capacity planning under uncertainty. Master's Thesis, Massachusetts Institute of Technology. [ Links ]
[7] Babajide, A. 2007. Real options analysis as a decision tool in oil field developments. Master's Thesis, Massachusetts Institute of Technology. [ Links ]
[8] Dixit, A. & Pindyck, R. 1994. Investment under uncertainty. Princeton University Press. [ Links ]
[9] Suryani, E., Chou, S.Y., Hartono, R. & Chen, C.H. 2010. Demand scenario analysis and planned capacity expansion: A system dynamics framework.Simulation Modeling Practice and Theory,18(6), pp 732-751. [ Links ]
[10] Ceryan, O. & Koren, Y. 2009. Manufacturing capacity planning strategies. CIRP Annals - Manufacturing Technology, 58(1), pp 403-406. [ Links ]
[11] Geng, N., Jiang, Z. & Chen, F. 2009. Stochastic programming based capacity planning for semiconductor wafer fab with uncertain demand and capacity. European Journal of Operational Research, 198(3), pp 899-908. [ Links ]
[12] Chou, Y.C., Cheng, T., Yang, F.C. & Liang, Y.Y. 2007. Evaluating alternative capacity strategies in semiconductor manufacturing under uncertain demand and price scenarios. International Journal of Production Economics, 105(2), pp 591-606. [ Links ]
[13] Suryani, E., Chou, S.Y. & Chen, C.H. 2010. Air passenger demand forecasting and passenger terminal capacity expansion: A system dynamics framework. Expert Systems with Applications, 37(3), pp 2324-2339. [ Links ]
[14] Sodhi, M. & Tang, C. 2009. Modeling supply-chain planning under demand uncertainty using stochastic programming: A survey motivated by asset-liability management. International Journal of Production Economics, 121(2), pp 728-738. [ Links ]
[15] Vithayasrichareon, P. & MacGill, I. 2012. A Monte Carlo based decision-support tool for assessing generation portfolios in future carbon constrained electricity industries. Energy Policy, 41, pp 374-392. [ Links ]
[16] Kashani, H. 2012. A real options model for the financial valuation of infrastructure systems under uncertainty. Dissertation, Georgia Institute of Technology. [ Links ]
[17] Myers, S.C. 1977. Determinants of corporate borrowing. Journal of Financial Economics, 5(2), pp 147-175. [ Links ]
[18] Ingersoll Jr., J.E. & Ross, S. 1992. Waiting to invest: Investment and uncertainty. The Journal of Business, 65, pp 1-29. [ Links ]
[19] Luehrman, T.A. 1998. Investment opportunities as real options: Getting started on the numbers. Harvard Business Review, 76, pp 51-67. [ Links ]
[20] Amram, M. & Kulatilaka, N. 1999. Real options: Managing strategic investment in an uncertain world. Harvard Business School Press. [ Links ]
[21] De Neufville, R. & Neely, J.E. 2001. Hybrid real options valuation of risky product development projects. International Journal of Technology, Policy and Management, 1(1), pp 29-46. [ Links ]
[22] Ozorio, L., Bastian-Pinto, C., Baidya, T.& Brandão, L. 2013. Investment decision in integrated steel plants under uncertainty. International Review of Financial Analysis, 27, pp 55-64. [ Links ]
[23] Zhu, L. 2012.A simulation based real options approach for the investment evaluation of nuclear power. Computers & Industrial Engineering, 63(3), pp 585-593. [ Links ]
[24] Deng, Y. 2006. Investment decision analysis of Alberta cattle industry: A real options approach. Master's Thesis, University of Alberta. [ Links ]
[25] Goodwin, P. & Wright, G. 2009. Decision analysis for management judgment.4thedition, John Wiley & Sons. [ Links ]
[26] Huang, T., Shi, F., Tanikawa, H., Fei, J. & Han, J. 2013. Materials demand and environmental impact of buildings construction and demolition in China based on dynamic material flow analysis,resources conservation and recycling. Simulation Modeling Practice and Theory, 72, pp 91-101. [ Links ]
[27] Yin, X. & Chen, W. 2013. Trends and development of steel demand in China: A bottom-up analysis. Resources Policy, 38(4), pp 407-415. [ Links ]
[28] Baker, H.K. 2011. Capital budgeting valuation: Financial analysis for today's investment projects. John Wiley & Sons. [ Links ]
[29] Tompkins, J., White, J., Bozer, Y. & Tanchoco, J. 2010. Facilities planning. 4thedition, John Wiley & Sons. [ Links ]
[30] World Databank. 2015. World development indicators. Retrieved from http://databank.worldbank.org. Accessed on 2 March 2015. [ Links ]
[31] Jordanian Department of Statistics. 2015. Jordan figures: Constructions. Retrieved from http://web.dos.gov.jo/?lang=en. Accessed on 2 March 2015. [ Links ]
[32] World Databank. 2015. Global economic monitor commodities. Retrieved from http://databank.worldbank.org. Accessed on 2 March 2015. [ Links ]
Submitted by authors 17 Sep 2015
Accepted for publication 28 Apr 2016
Available online 12 Aug 2016
* Corresponding author ammomani@just.edu.jo

