


Services on Demand
Article
 English (pdf)
 Article in xml format
 Article references
Indicators

Related links
-
 Cited by Google
 -
 Similars in Google
Share

 Permalink
South African Journal of Industrial Engineering
On-line version ISSN 2224-7890
Print version ISSN 1012-277X
S. Afr. J. Ind. Eng. vol.27 n.1 Pretoria May. 2016
http://dx.doi.org/10.7166/27-1-969
CASE STUDIES
Reduction of production cycle time by optimising production and non-production components of time in the metalworking industry: A case study
V. Spasojević BrkićI, *; M. KlarinII; S. StanisavljevII; A. BrkićIII; Z. SajfertII
IUniversity of Belgrade, Faculty of Mechanical Engineering Kraljice Marije 16, 11000 Belgrade, Serbia
IIUniversity of Novi Sad, Technical faculty "Mihajlo Pupin" Djure Djakovica bb, 23000 Zrenjanin, Serbia
IIIUniversity of Belgrade, Innovation Center, Faculty of Mechanical Engineering Kraljice Marije 16, 11000 Belgrade, Serbia
ABSTRACT
The production cycle (PC) time, as a very important economic indicator of freezing current assets, involves the time needed to manufacture a unit or a series of units, from putting them into production until they are put into storage; and yet it is rarely discussed in the literature, even though it should be also analysed and be made as short as possible. The goal of this article is to survey and control the methodology of reducing the PC time of components in the metalworking industry, grouped by factor analysis into the factors of production and non-production components, observed by a modified method of current observations, and viewed as a process whose effectiveness was monitored using control charts. The survey is based on data collected through 1,576 observations in a Serbian company that manufactures electrical and electronic equipment for motor vehicles. The 2012 results, when compared with those of 2011, indicate that the PC time is significantly reduced by 93 minutes, or by 28.53 per cent, and the manufacturing time by 46 minutes, or by 19.17 per cent. The results furnish empirical findings that provide insights into a number of managerial issues concerning investment decisions in product-specific cycle time improvements and reductions, together with process redesigns.
OPSOMMING
Die produksiesiklustyd, 'n baie belangrike ekonomiese aanwyser vir die vries van bestaande bates, behels die tyd benodig om 'n eenheid (of 'n reeks eenhede) te vervaardig, van die begin van produksie tot die stoor van die eenheid. Tog word die produksie-siklustyd selde in die literatuur bespreek. Hierdie artikel ondersoek die opname- en beheermetode van die produksiesiklustyd van komponente in die metaalwerkindustrie, met die doel om dit te verkort. Komponente word gegroepeer deur middel van faktor-ontleding in produksie en nie-produksie komponente, dit word waargeneem deur 'n aangepaste huidige waarnemingsmetode, en hanteer as 'n proses waarvan die effektiwiteit met beheerkaarte gemonitor is. Die opname is gebaseer op 1576 waarnemings by 'n Serwiese vervaardiger van elektriese en elektroniese voertuig-onderdele. Die 2012 resultate, wanneer dit met dié van 2011 vergelyk word, dui aan dat die produksiesiklustyd met 93 minute, of te wel 28.53 persent, verminder het. Die vervaardigingstyd is met 46 minute, dit is 19.17 persent, verkort. Die resultate toon empiriese bevindings wat insig in etlike bestuurskwessies, rakende beleggingsbesluite in produkspesifieke siklustyd verbeteringe en prosesherontwerpe, gee.
1 INTRODUCTION
Thinking in terms of product life cycles is one of the challenges facing manufacturers today. In today's competitive global environment, customers demand products that are highly differentiated, low-cost, and high-quality. So manufacturers must offer a wide variety of products in a cost-effective manner, with quick responses to changes in product designs and volumes. Life cycle assessment is a very important issue, and must be elaborated in many directions in the next decade: new databases should be developed, new impact assessment methods should be designed, and methods for uncertainty analysis should be improved [1].
With short set-up times, short production cycles - with small lots and inventories - become economical [2]. To ensure rational production and adherence to time schedules in production planning, corresponding technical-technological calculations are needed to provide machine operating modes, the time duration of machine operations, and other activities in the manufacturing process. But process planning is still conventionally done manually from scratch by experts who retrieve and manipulate a great deal of information from many sources, including established standards, machine capabilities, tooling inventories, stock availability, and existing practice. Unfortunately, the lack of life cycle data for manufacturing processes is the main problem in the process of planning improvement [18], due to fact that gathering data for a cycle analysis is extremely resource- and time-intensive [6].
In contrast, capacities utilisation levels even today are successfully monitored using the work sampling method [3,4,5,6,7]. The production cycle (PC) time, as another even much more important economic indicator of freezing current assets, involves the time needed to make a unit or a series of units, from putting them into production until they are stored, and yet it is rarely discussed in literature, although it should also be analysed and made as short as possible. The PC time components can be also monitored using the work sampling method, but with a restricted realm of use, and with only three components of PC time that are monitored - the machine is in operation, the machine is in preparation, or the machine is idle - so that it is not very helpful to shorten PC time. Both capacities and PC indicators are actually influenced by a series of organisational-technical, mutually interconnected factors that impact the cycle time components related to the machine capacity utilisation and production cycle of a certain product. The goal therefore is, in general, to reduce the total production cycle time, especially the elements associated with different types of stoppage, and the optimisation of lead time and machine time within the sphere of machine capacity utilisation. Additionally, the optimisation of time for transport, control, and packing is important for the production cycle. A reduced cycle time can be translated into increased customer satisfaction. Quick response companies are able to launch new products earlier, penetrate new markets faster, meet changing demand, and make rapid and timely deliveries. Quick response companies can also offer their customers lower costs because they have streamlined processes with low inventory and less obsolete stock.
The goal of this article is to survey and control the methodology of PC time reduction by optimising time components in the metalworking industry, grouped by factor analysis into the factors of production and non-production components, which can be monitored later as the processes are observed through control charts. Our empirical findings will provide insights into a number of managerial issues concerning investment decisions in product-specific cycle time improvements and reductions, together with process redesigns. The issues raised are of special importance in transitional economies and industries, described in detail in Lekovic et al. (2014).
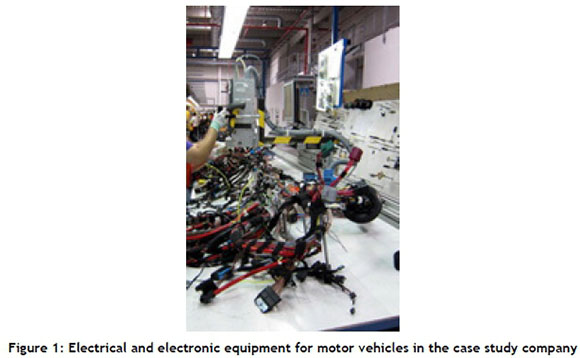
Our survey is based on real data collected in a metalworking factory located in Zrenjanin, Serbia, manufacturing electrical and electronic equipment for motor vehicles, as can be seen in Figure 1. The company was established in 2007, and has more than 2,000 employees. Their products are installed in Fiat vehicles that are produced in Serbia or exported to Germany. Scanning for the study was carried out through current observations for one month each in two consecutive years (2011 and 2012). The reason for this was that production and productivity are also related to production dynamics, which are planned at the operational level on a daily, weekly, or monthly basis. The parts observed were cables number 20, 21 and 30. In September 2011, 47 PCs were scanned with 932 observations, while in September 2012 that number came to 30 PCs with 644 observations.
Follwing this introduction, Section 2 - using the analysis of previous research - points to the need for a more objective, justified, and consistent model. Section 3 presents the methodology for PC time reduction by optimising production and non-production components of time in the metalworking industry, based on the application of factor analysis and control charts, and gives its results. Section 4 discusses the shortening of the PC, and offers its conclusions.
2 LITERATURE REVIEW
In the past, in both theory and practice, increased attention was focused on the level of machine capacity utilisation because machines were more costly and thus had a greater impact on production efficiency. A special contribution here was made by Tippett [5], who first applied his method of work sampling in the textile industry. Despite its shortcomings, this method is still often used in production practice and is found in all industrial engineering text-books [8]. Mathematical models to address the issue of investing in reduced setups began to appear in the mid-1980s. Porteus [2] introduced the first-known of such models, which dealt with the problem of selecting the appropriate level of investment in setup cost reductions, while various authors have proposed variations or extensions of this model, considering either a single product or multiple products. The indispensible modification of the work sampling method presented by Klarin et al. [9] aims to explain and justify both the necessity and the importance of using the shift level of the utilisation of capacity as the stochastic variable in determining the total level of capacity utilisation in the production process, using the method of work sampling on a sample of 74 Serbian companies. The conclusion drawn is that the shift level of capacity utilisation as the stochastic variable in work sampling is the model that solves the problem of determining the total level of capacity utilisation conveniently and with accurate results. On the other hand, on the basis of the model presented by Klarin et al. [9], Elnekave and Gilad [10] propose a digital video-based approach to enhance work measurement and analysis by facilitating the generation of rapid time standards. This approach serves as a computerised tool for remote work measurement, with the ability to generate time standards rapidly. Affisco et al. [11] investigated, in a context of supplier-customer relationships, how joint investment decisions in process quality improvements and setup cost reductions result in total system savings, due to a larger decrease in supplier replacement costs, supplier setup costs, and customer inspection costs than the increase of investment costs in quality improvements and setup reductions.
It is evident that today the more significant problem - one that is completely different from that of capacities - is monitoring and influencing the production cycle (the period from the item's entry into the production process to the receipt of a finished product and its packing). Yet discussion of this problem is found far less in the literature.
The importance of the production cycle is emphasised by Agrawal et al. [12], who present an approach to production planning through targeting minimal product cycle times. A number of works consider the impact of machine breakdown on production cycle time [13, 14], while Kun-Jen et al. [15] propose an inventory model linked with production cycle optimisation. Rappold and Yoho [16] explore a production policy in which the length of the production cycle is kept between lower and upper limits, while Taleizadeh et al. [17] determine the optimal cycle length of each product through minimising the cost function. As can be seen, contemporary procedures in PC optimisation, which are often special cases with extensive mathematical calculations or arbitrary and sometimes subjective methods in everyday use in factories, require models that are more objective, justifiable, and consistently as simple as possible, and that are adequate for application in everyday practice.
3 METHODOLOGY FOR REDUCING PC BY OPTIMISING PRODUCTION AND NON-PRODUCTION TIME COMPONENTS IN THE METALWORKING INDUSTRY
Klarin et al. [9] have presented a modified work sampling method for establishing the level of capacity utilisation, and have found that the level of capacity utilisation as a stochastic variable in work sampling is the model that neatly resolves the problem of determining the total level of capacity with accurate results. A similar approach to establishing the level of capacity utilisation can be employed in conditions of balanced line production, or when there are components of large-scale production as well as short production cycles [18].
This article starts from the assumption that an additionally modified method of current observations can be applied not only when observing capacity utilisation, but also for PC time -although the impact of stochastic factors in observing PC is much stronger than in capacity utilisation. In observing PC, new cycle time components emerge, such as control time and transport time, while the components are grouped by factor analysis. Factor analysis offers a tool for analysing the structure of mutual dependence between a larger number of variables, forming groups of correlated variables called factors. These groups, or factors, possess by definition a high degree of interdependence; so they are assumed to be data dimensions [19]. Thus the basic function of factor analysis is to summarise data contained in the original variable quantities into new variables (i.e., factors) with a minimal loss of information. Also, it is assumed that the PC time components will not behave according to binomial distribution, as in capacity observations, but according to normal distribution. In observing PC, scanning will not be performed by conventional current observations method, as in capacity observations, but by observing work items.
The basic principles of work sampling involve identifying and recording the tasks that people perform at a sufficiently large number of randomly-occurring sample points [20]. The use of such sampling, together with its associated statistical distributions and equations, to provide an accurate and valid representation of the wider population of the object in question, has already been extensively demonstrated in both the field of work sampling and broader statistical theory [17]. Work sampling is most suitable for determining (1) machine utilisation, (2) allowances for unavoidable delays, and (3) work standards for direct and indirect work; but, with some modifications arising from our results, it can also be used in PC time utilisation. Thus, in this case, the modified method of current observations will enable us to determine the participation of cycle time components against the total length of PC and manufacturing time.
3.1 PC time optimisation: The 2011 sample
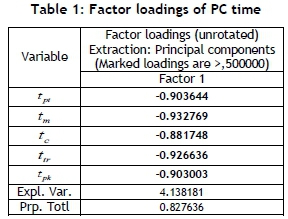
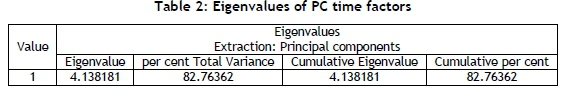
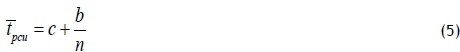
Self-report data are collected using mini portable computers (personal digital assistants [PDAs]) as proposed by Robinson [20]. The PC time - tpcis divided into a larger number of components, namely production time - tpand non-production time - tnp, while production time is then further divided into technological time - tt-, with set-up time tptand manufacturing time tm. Also, non-technological time - tntis composed of time of control - tc-, transportation - ttr- and packaging -tpk. Non-production time is classified according to various causes of stoppages in production, the most general and common of which are the lack of raw materials - tmr, organisational factors - to, ttl- stoppage due to tools or machine breakdown - tb, and other problems - tto. The proposed division was checked by the factor analysis method. Factor loadings of PC time made up of technological time - tt, with set-up time tptand manufacturing time tm, also non-technological time - tntcomposed of time of control - tc-, transportation - ttr- and packaging - tpkare shown in Table 1, and eigenvalues are shown in Table 2.
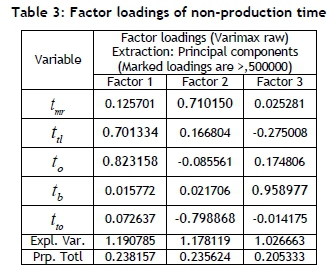
Factor loadings of non-production time composed of the lack of raw materials - tmr, organisational factors - to, machine breakdown - tb, stoppage due to tools - ttland other problems - ttoare shown in Table 3, and eigenvalues of the components in Table 4.
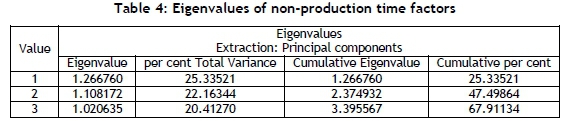
It proved that the division of a variable into a number of factors did not occur in the case of production time, and that there is a tendency to group variables logically; while in non-production time there are three variables per factor, meaning that there was no need to perform a reliability analysis. The sampled levels of PC time have a normal distribution, since χ2 = 3.070404 and Xj2= 55.76, e.g. χ2 <χj2, which holds true for cycle time components, as shown in Table 5 for an example of manufacturing time.
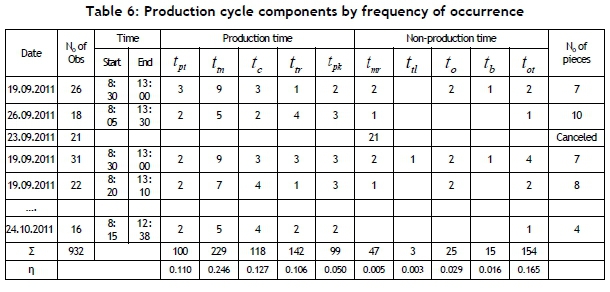
The utilisation level of individual PC components is further calculated according to the principles of the current observations method so that, for example, the time level of manufacturing time - tmis obtained by dividing the sum of that observation by the total number according to Table 1; therefore tm= 0.246. In PCs, the time is affected by a larger number of stochastic factors than in capacity observations, where the application of the current observations method is common; so the interpretation of the results according to Table 6 would be inadequate for PC analysis and time reduction.
Each PC component's real time is obtained by calculations that apply the formula and use data from Tables 6 and 7, where i = date of monitoring:

Based on Table 7, it is evident that the first cycle has a higher frequency than the second (based on Table 6), so the length of time tptis, in contrast, larger in the second cycle and amounts to 36 minutes, compared with the time length of 32 minutes in the first cycle.
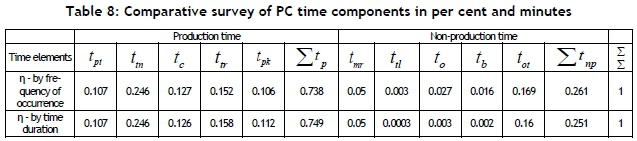
A comparison of the PC scanning results presented in Tables 6 and 7 indicates that the cycle time components differ in duration, while the total production and non-production time is almost equal (shown in Table 8). Differences in individual time components resulted from the action of stochastic factors that are present in production. The total PC time duration for the same number of units in a series is increased as the number of units in a series increases, but decreases if observed per unit of product (pieces). Consequently, the number of units in a series is an important impact factor that has to be taken into account. Table 8 also shows that our sample is large and representative.
The results for PC components' trends per minute and level are given in Figures 2, 3, 4 and 5, where the observation of cycle time is shown on the control charts because the cycle is one among the processes. The 3σ limit is normally used in work sampling to set the upper and lower limits of control.
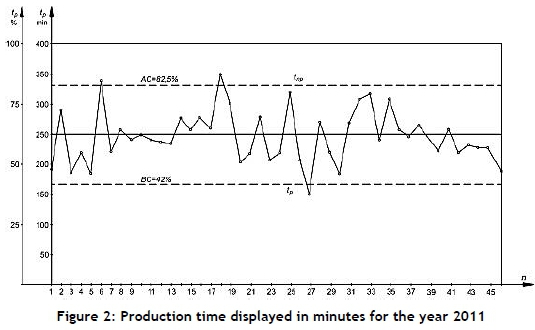
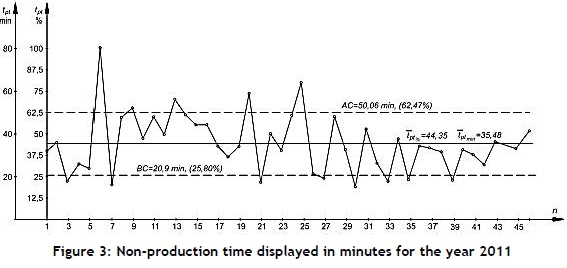
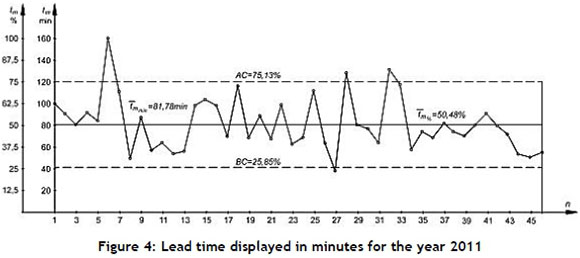
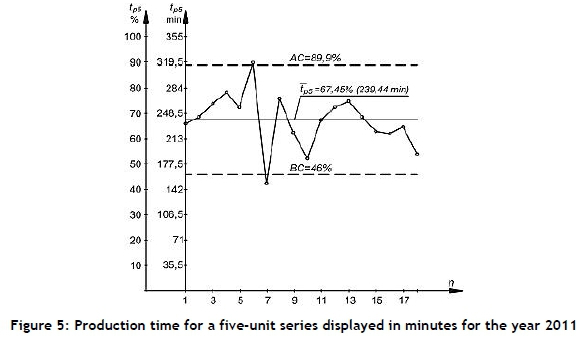
Figure 2 shows production time, whose mean value equals 249 minutes or 62.25 per cent of the total maximum time of PC length, whereas control limits comprise 42 per cent to 82.5 per cent of time. Analogously, Figure 3 shows that the mean value of non-production time is 35.48 minutes, at 44 per cent, while the limits are at 25.80 and 62.47 per cent.
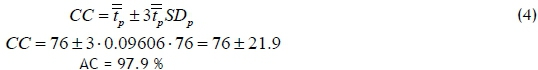
Figure 4 shows data for lead time tm from Table 2, obtained by summarising the maximum duration of 162 minutes in cycle No. 6 at 100 per cent. It is evident from Figure 4 that the process is almost completely mastered, that only one point more is out of control limits, and one point only insignificantly. The mean value is  = 81.78min , i.e. 50.48 per cent with control limits AC = 75.13 per cent and BC = 25.85 per cent.
The results of the production time observations for five-unit series are given in Figure 5. The results are reduced to the highest PC value for five pieces, i.e. to the cycle No. 46 in Table 7 with 355 minutes duration. It is noticeable from Figure 5 that the mean value of production time for the five-unit series and for 18 PCs is tp5= 67.45 per cent (239.44 minutes) at AC = 88.9 per cent and BC = 46 per cent, and that the process is very well controlled. Table 9 displays the number of PCs and the number of units in production series.
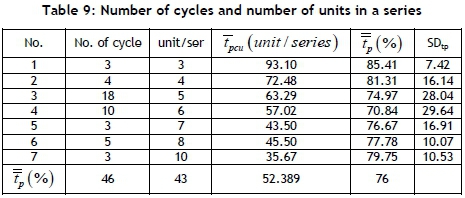
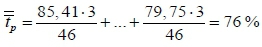
The trends of PC time mean values  ( %) by cycles (groups) with an identical number of units in a series (in percent) and the PC mean values per unit in a series
  are given in the diagram in Figure 6. The mean value for all groups is obtained using the formula:
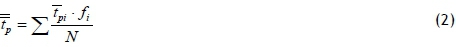
where f is the number of PCs with an identical number of units in a series.
for a non-stratified set of data from Table 1, using the formula:
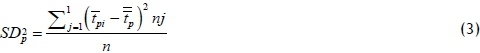
where n is the number of cycles in a group and n is the total number of cycles.
It is obvious from the diagram in Figure 6 that, mathematically viewed, the process is mastered, because all the points of  lie within the control limits
  . The trend of
  can be approximated by the function:

where n is the number of units. The mean value of cycle time per number of units in a series equals:

whereas the mean value of cycle time per number of cycles is:
3.2 PC time optimisation: The 2012 sample
The experiment was conducted in identical conditions one year later, in September 2012. The results are represented only diagrammatically due to the volume of data. The reduction was done by 30 cycles with 644 observations. The PC time ranged from 178 to 331 minutes.
In the year 2012, after perceiving the shortcomings and factors producing adverse effects on the PC time in 2011, one small-sized machine was purchased to be included in production, so that a significant reduction in PC time occurred, on average, from 326 minutes to 233 minutes This resulted in the reduction of all PC time components as well as of production and non-production time. Production time dropped from 244 minutes to 194 minutes, while non-production time dropped from 82 minutes to 39 minutes, with the increased percentage of production time share amounting to 83.26 per cent in 2012, compared with 74.26 per cent in 2011. This indicates that a larger reduction of PC time was obtained in cycle time components that were influenced more by the human factor. The trends of PC time components and production and non-production time are represented by the diagram in Figure 7, with data given in percentages.
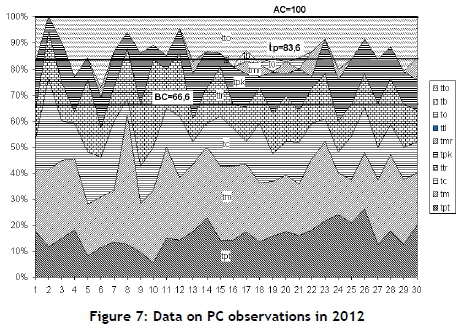
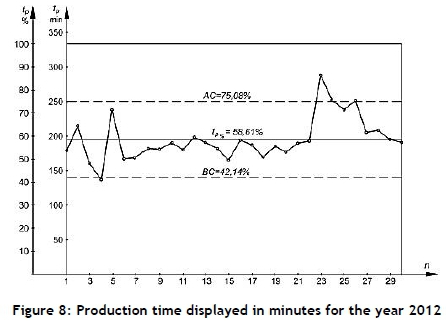
It is obvious from Figure 7 that the process is mastered in full, because none of the values of tpis located out of control limits. If trends of tpare represented in minutes and reduced to percentages, then the demonstration of the process control via control limits generates the diagram in Figure 8, where the mean value is  = 58.61 % or 194 minutes, SD tpmin = 31 minutes or 9.37 % and AC = 75.08 % and BC = 42.14 %, with only one point of cycle no. 23 out of AC, while the point of cycle no. 4 is insignificantly out of the BC limit.
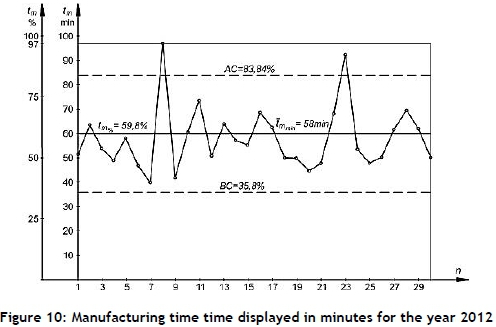
The trends of the most significant PC components represented in an identical manner, set-up time tptiand technical-technological (major) time tm, also generate more favourable trends than those in 2011. The process for set-up time tpthas only five points out of KG (Figure 9), whereas
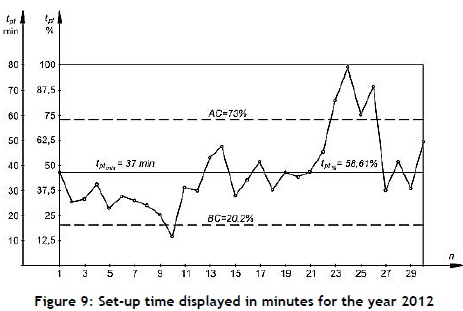
the one in 2011 had as many as 13. The processot differ from that in 2011, because two points each are out of KG. Short setup time is a for manufacturing time tm(Figure 10) in 2012 is almost completely mastered, and does nn essential element for the effective implementation of many lean pillars, i.e., JIT and Kanban [3].
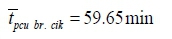
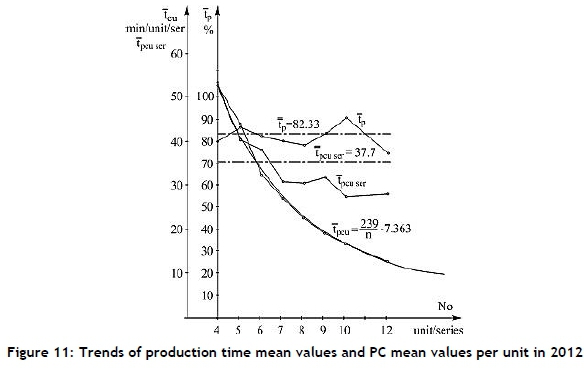
It should be noted that this is a consequence of deterministic factors related to the machine operating mode, so that the machine utilisation capacity with optimum calculations for operating mode increases by eliminating bottlenecks, while all other PC time components are affected by a number of factors that are human-related, and they are stochastic in character. Observing the trends of value reduced to the number of units in a series and number of series, it is obvious that cycle time dropped drastically per piece and series (Figure 11). Mean values of cycle time per number of units in a series amount to  = 31.27 min , while mean value of cycle time per number of cycles equal
  = 37 . 7min. Comparing these with the 2011 data, we can see that the length of time reduction for
  was by 21.95 1 minutes and for
  by 21.12 minutes.
These are relevantly large reductions that resulted from the fact that the factory is new, so that improvements can be made during the manufacturing process.
4 CONCLUSION
In this survey, it has been shown that a modified method of work sampling, with time components gouped by factor analysis, is applicable not only in the domain of capacity utilisation observations, but also in investigating PC in a metalworking industry with small-sized series, using small alterations. The specificity of the proposed method refers to machine utilisation observations that are not performed by shifts and days using current observations of machines, but through PC time components monitoring the items of work. The PC trends can be thus observed as a process, while the efficiency of the process can be observed through control charts. The application of the method in production practice indicates that, in organised production conditions with a higher PC time level (0.5-1), for a sufficient number of PCs they range according to normal distribution (whereas in capacity utilisation observations they range by binomial distribution) and within control limits determined by 3 SDs. Oscillations and mean values for the levels of cycle time components and stoppages allow for the comparison of production by flow time or in similar enterprises, thus enabling the reduction of PC time. This survey, and the control of methodology for PC reduction by optimising time components in the metalworking industry, grouped by factor analysis into the factors of production and non-production components, monitored by a modified method of current observations, and monitored as a process whose efficiency was observed through control charts on the sample of 1,576 observations in a metalworking factory in Serbia that manufactured vehicle components, show that PC was significantly reduced in 2012 by 93 minutes or 28.53 per cent, compared with 2011, while production time was shortened by 46 minutes or 19.17 per cent.
The insights we obtained from randomly-generated problems appear to agree with the shared wisdom of manufacturing practice in general. It is concluded that this experimental investigation has proved that, in the practice of small- and medium-sized enterprises that are engaged in serial production, it is possible to apply a very simple but sufficently accurate methodology to establish production cycle time components, and to later to optimise PC duration. The results provide empirical results that offer insights into a number of managerial issues concerning investment decisions in product-specific cycle time improvements and reductions, together with process redesigns.
Proposals for further investigation include the application and control of this method in other types of production, such as assembly processes and processes in the textile industry. Further analysis should be also oriented to the issue of transport time, as well as further division of time components of other stoppages, to isolate the most significant ones. We are currently exploring such extensions of this method. Also, an interesting possiblility for future research, as proposed by Marsudi and Shafeek [21], could be an analysis of the influence of working conditions on PC time.
REFERENCES
[1] Jeroen, B.G., Reinout, H., Gjalt, H., Alessandra, Z., Paolo, M., Roberto, B., Tomas, E. & Tomas, R. 2010. Life cycle assessment: Past, present, and future, Environmental Science & Technology, 1, pp. 90-96. [ Links ]
[2] Moustapha, D., Jose, M.C. & Aaron, L.N. 2013. Shortening cycle times in multi-product, capacitated production environments through quality level improvements and setup reduction, European Journal of Operational Research, 3, pp. 526-535. [ Links ]
[3] Ramani, K., Ramanujan, D., Bernstein, W. Z., Zhao, F., Sutherland, J., Handwerker, C., ... & Thurston, D. 2010. Integrated sustainable life cycle design: A review, Journal of Mechanical Design, 132(9), pp. 091004-1-091004-15. [ Links ]
[4] Bohm, M. R., Haapala, K. R., Poppa, K., Stone, R. B., & Tumer, I. Y. 2010. Integrating life cycle assessment into the conceptual phase of design using a design repository, Journal of Mechanical Design, 132(9), pp. 091005-1-091005-9. [ Links ]
[5] Barnes, R. 1957. Work sampling. 2nd edition. New York: John Wiley & Sons, Inc. [ Links ]
[6] Maynard, H.B. 1971. Industrial engineering handbook. 3rd edition. Pittsburgh, PA: McGraw-Hill. [ Links ]
[7] Joseph, J.M. 1980. Selection of work sampling observation times: Part I - Stratified sampling, A I I E Transactions, 1, pp. 23-31. [ Links ]
[8] Richardson, W.J. & Eleanor, S.P. 1982. Work sampling: Handbook of industrial engineering. Salvendi, G. (ed.). New York: John Wiley & Sons, Inc. [ Links ]
[9] Klarin, M.M., Cvijanovic, M.J. & Spasojevic-Brkic, K.V. 2000. The shift level of the utilization of capacity as the stochastic variable in work sampling, International Journal of Production Research, 38(12), pp. 2643-2651. [ Links ]
[10] Elnekave, M. & Gilad, I. 2006. Rapid video-based analysis system for advanced work measurement, International Journal of Production Research, 44(2), pp. 271-290. [ Links ]
[11] John, A., Javad, P. & Farrokh, N. 2002. Quality improvement and setup reduction in the joint economic lot size model, European Journal of Operational Research, 142(3), pp. 497-508. [ Links ]
[12] Agrawal, A., Minis, I. & Nagi, R. 2000. Cycle time reduction by improved MRP-based production planning, International Journal of Production Research, 38(18), pp. 4823-4841. [ Links ]
[13] Tzu-Hsien, L. 2009. Optimal production run length and maintenance schedule for a deteriorating production system, The International Journal of Advanced Manufacturing Technology, 43(9-10), pp. 959-963. [ Links ]
[14] Giri, B.C. & Yun, W.Y. 2005. Optimal lot sizing for an unreliable production system under partial backlogging and at most two failures in a production cycle, International Journal of Production Economics, 65(2), pp. 229-243. [ Links ]
[15] Kun-Jen, C., Kuo-Lung, H. & Shaw-Ping, L. 2009. The optimal production cycle time in an integrated production - inventory model for decaying raw materials, Applied mathematical Modeling, 33(1), pp. 1-10. [ Links ]
[16] Rappold, J. & Yoho, K.D. 2008. A model for level-loading production in the process industries when demand is stochastic, Production Planning & Control, 19(7), pp. 686-701. [ Links ]
[17] Taleizadeh, A.A., Sadjadi, S.J. & Akhavan Niaki, S.T. 2011. Multiproduct EPQ model with single machine, backordering and immediate rework process, European Journal of Industrial Engineering, 5(4),pp. 388-411. [ Links ]
[18] Klarin, M.M., Milanovic, D.D., Spasojevic-Brkic, K.V., Misita, M. & Jovovic, A. 2010. A method to assess capacity utilization in short cycle functional layouts, Proceedings of the Institution of Mechanical Engineers, Part E: Journal of Process Mechanical Engineering, 224(1), pp. 49-58. [ Links ]
[19] Joseph, F.H. Jr., William, C.B., Barry, J.B. & Rolph, E.A. 2010. Multivariate data analysis. 7th edition. New Jersey: Prentice-Hall Inc. [ Links ]
[20] Robinson, M.A. 2009. Work sampling: Methodological advances and new applications, Human Factors and Ergonomics in Manufacturing & Service Industries, 20(1), pp. 42-60. [ Links ]
[21] Marsudi M. & Shafeek H. 2014. Cycle time analysis of tipping trailer frame: A case study in a heavy equipment industry, South African Journal of Industrial Engineering, 25(1), pp. 176-188. [ Links ]
Submitted by authors 12 Jun 2014
Accepted for publication 13 Feb 2016
Available online 10 /May 2016
This work was supported by the Serbian Ministry of Education, Science and Technological Development [Grants numbers TR 35017, EI6761].
* Corresponding author vspasojevic@mas.bg.ac.rs

