


Services on Demand
Article
 English (pdf)
 Article in xml format
 Article references
Indicators

Related links
-
 Cited by Google
 -
 Similars in Google
Share

 Permalink
South African Journal of Industrial Engineering
On-line version ISSN 2224-7890
Print version ISSN 1012-277X
S. Afr. J. Ind. Eng. vol.27 n.1 Pretoria May. 2016
http://dx.doi.org/10.7166/27-1-1192
GENERAL ARTICLES
Artificial intelligence applied to assigned merchandise location in retail sales systems
O. Cruz-DominguezI, II, *; R. Santos-MayorgaII
IDepartment of Industrial Engineering Postgraduate, CIATEC, A.C, León, Guanajuato, México
IIIndustrial Engineering Area, Zacatecas Polytechnic University, México
ABSTRACT
This paper presents an option for improving the process of assigning storage locations for merchandise in a warehouse. A disadvantage of policies in the literature is that the merchandise is assigned allocation only according to the volume of sales and the rotation it presents. However, in some cases it is necessary to deal with other aspects such as family group membership, the physical characteristics of the products, and their sales pattern to design an integral policy. This paper presents an alternative to the aforementioned process using Flexsim®, artificial neural networks, and genetic algorithms.
OPSOMMING
'n Metode om die toekenningsproses van stoorplekke vir goedere in 'n pakhuis te verbeter, word voorgehou. 'n Nadeel van die bestaande beleide in die literatuur is dat die goedere slegs toegeken word op grond van die verkoopvolume en die omset wat dit verteenwoordig. In sommige gevalle is dit egter nodig om ander aspekte, soos familie groeplidmaatskap, die fisiese eienskappe van die produkte en hulle verkoopspatroon, te oorweeg om 'n integrale beleid te formuleer. Hierdie artikel beskryf 'n alternatief vir die voorafgenoemde proses deur van Flexsim®, kunstmatige neurale netwerke en genetiese algoritmes gerbuik te maak.
1 INTRODUCTION
The high competitiveness and speed of the business environment makes it vital that enterprises continuously and effectively optimise the design of their business systems in the shortest time possible. These conditions, in the case of the existing systems in retail distribution companies, force them to be designed or redesigned to respond quickly to the client. Generally, the factors to consider in this analysis are guaranteed easy and efficient access to the merchandise, proper use of storage locations throughout the warehouse, generation of shorter routes, and order throughput in reasonable time [1].
In this research, assigning product location in a retail sales warehouse system is addressed. The literature in this field includes four kinds of storage allocation policies. In random storage, the merchandise allocation is randomly selected from all possible empty locations [2]. In the next policy, the selection of vacant positions is biased towards those that are closer in time and / or distance to the input / output point [3]. The two remaining policies are grouped under the concept of dedicated storage. 'Fixed location' assigns each product to a warehouse, using product characteristics such as sales volume, weight, or measure [4]. The fourth policy divides products into classes that are stored in dedicated areas of the warehouse, with random storage within a specific area [5]. The aim of this study is to improve the retail store's internal operational logistics by identifying the best product allocations, seeking to respond to the demand behaviour [2]. This policy considers other relevant factors, such as family membership, sales patterns, and products' physical characteristics.
According to Caron et al. [6], adopting allocation methods based on sales volume requires a more 'intensive information' approach that might not be available - for example, when the order frequency is changing in a dynamic environment. In cases like the one analysed here, small businesses usually do not invest enough to improve their processes, and this limits their ability to generate information banks like those that big companies have. This in turn creates a barrier to their achieving competitive success [7].
The approach described in this article is based on the customer process analysis of a spare parts distributor in Mexico that handles over 50,000 Stock-Keeping Units (SKUs) distributed throughout a warehouse. This study considers the simulation coupling of neural networks and genetic algorithms to assign merchandise locations in small businesses stores that do not generate data banks. In the literature there have been individual studies of the use of the techniques mentioned. For example, Petersen and Aase [8] used a simulation model to evaluate several picking, storage, and routing policies in a manual order fulfillment system. Muppani and Adil [9] developed a simulated annealing algorithm to solve an integer programming model for class formation and storage assignment. Ene and Öztürk [10] developed a genetic algorithm to form optimal batches and routes for the order picker. Hsu, Chen and Chen [11] developed an order batching approach based on genetic algorithms to deal with any kind of batch structure and any kind of warehouse layout. Tsai, Liou and Huang [12] solved a batch picking model using a multiple-GA method for generating optimal batch picking plans.
This article is organised as follows: in section 2 the methodological framework used in the research is presented; in section 3 the results of the coupling of the techniques mentioned above are shown; in section 4 the obtained results are discussed; and section 5 presents the conclusions.
2 METHODOLOGICAL FRAMEWORK
2.1 Method
In Figure 1 the sequence of the tools used in this research is presented. Initially, it is necessary to create a database performing several simulation runs using Flexsim®, with a model accurately representing the analysed service system. The database is used for different artificial neural networks (ANNs) that enable the identification of consumption patterns, association rules, or cyclic behaviour in clients / items. For the analysis and interpretation, the simulation and neural networks results are compared. Afterwards the cluster configuration given by the neural networks is subjected to optimisation, applying a genetic algorithm. The results produced by the flow corrections and inventory management can be placed back into the database for a more robust constitution.

2.2 Construction of the simulation model
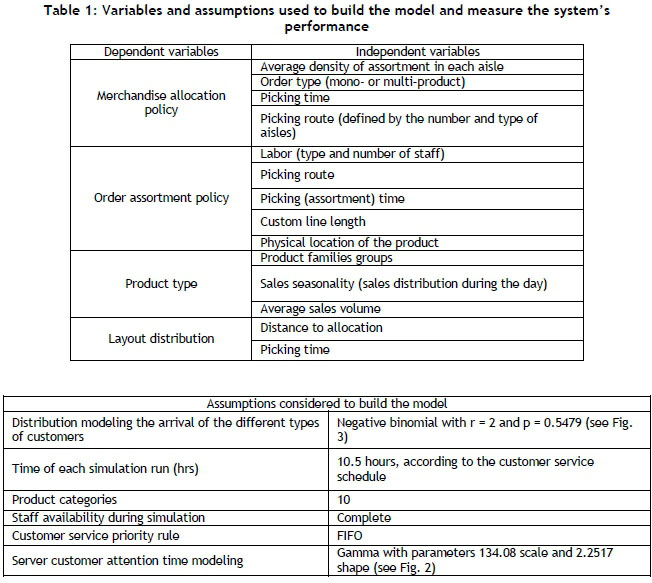
For the construction of the simulation model, the methodology proposed by Coss [13] was used, adapting its phases to the needs of the project. In this model all process steps related to customer service, the variables, and the assumptions shown in Table 1 were considered.
2.2.1 Validation of the simulation model
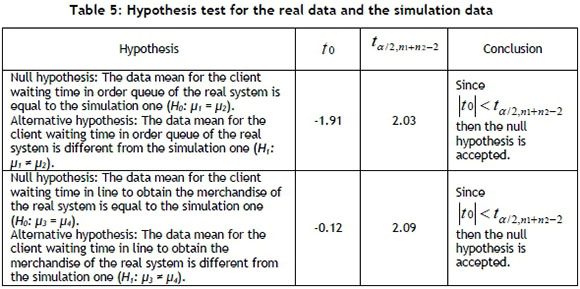
The results produced by the system under study and by the model were compared to validate the simulation model. In agreement with Sargent [14], the model runs were performed under the same conditions and used the same inputs as those occurring in the real system to see if the results in the variables of interest were consistent. Since the picking times are directly related to the product search and picking route [2], the 'client waiting time in order queue' and the 'client waiting time to obtain the merchandise' variables were considered to be relevant to the model validation.
To compare the above-mentioned waiting times, a hypothesis test using Minitab® was carried out, first checking the normality of the data. The data used in the hypothesis test and the results obtained are shown in Tables 2 and 3.


After checking the data normality, applying the Shapiro-Wilk test [15], the data obtained from the real system and that from the simulation were compared. The variances equality was verified by performing a standard deviation test using Minitab®. The results are shown in Table 4.

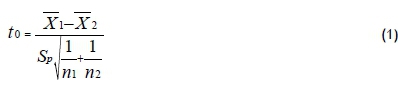
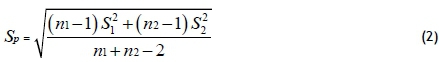
Based on Pulido and De la Vara [16], if equal variances are assumed, the statistic test and the rejection criteria used to determine whether two population means are equal are obtained through equations (1), (2) and (3).
t-Ratio:
where:
And the rejection criterion is

Since the hypotheses of equal means in both tests are accepted, it can be stated that the model represents the enterprise reality with a good level of confidence, and the model operation is validated.
2.3 Pattern recognition using neural networks
The database generated by the simulator represents the actual system characteristics. In each simulation run, an n x p data matrix is obtained, where n represents the measured objects and p the measurements made for each object. According to De Koster et al. [4] and Roodbergen [17], the relevant variables considered as predictors to allocate items optimally in a warehouse are: order type (mono- and multi-product), picking route, product family, and average sales rate.
The multilayer perception network of neurons is the algorithm used in this study to establish the weight of the input variables, based on a transfer function, yielding a product allocation consistent with the features of the predictor variables. A classical neural network consists of several layers of neurons: a) a layer representing the transmitted variables; b) one or more hidden layers performing the network specific treatment; c) a layer that provides the results [18]. The neural network stores information in a string of interconnections through synaptic weights. The artificial neural network learning rule should be considered for the creation of a neural model, adjusting the weights that initially take random values and are uniformly distributed. The architecture of different types of ANN, using the corresponding Matlab® module, was explored to find the right design for the analysed problem. The structure of the artificial neural system that was used is shown in Figure 4.

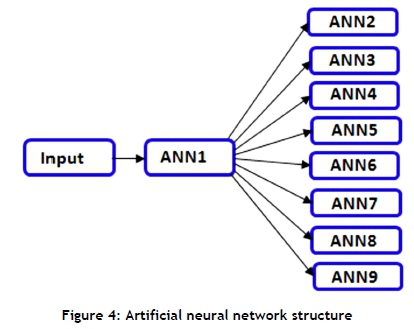
The ANN1 receives the input data and gives the product allocation a specific aisle; the other networks assign the product to a cluster. A cluster can be defined as a physical concentration of products that share common characteristics such as family membership - for example, the cluster of pistons. Using equations (4) and (5), the number of neurons for the ANN1 layers was calculated.
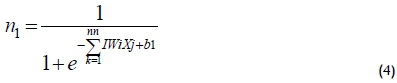
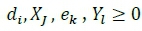
The chosen activation function was sigmoidal, n1- hidden layer value, - hidden layers initial weights bi - hidden layer polarisation values, Xj - inputs and YWl number of neurons.

n2 is the calculation for the second layer, LWj - second layer j final weights, b2 - output layer polarisation values and on is the number of output neurons. The feed-forward connection architecture was chosen for the ANN1, 13 neurons in the first hidden layer, and six in the second hidden layer, with sigmoidal transfer functions in both layers and a quasi-Newton training algorithm.
Using equation (6), the number of neurons for the remaining ANNs (ANN2 to ANN9) was calculated.
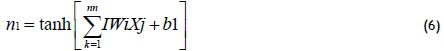
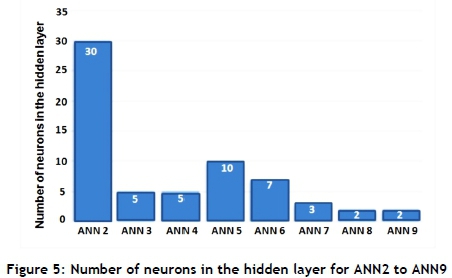
The activation function is the hyperbolic tangent, ni - hidden layer value, IWi - hidden layer i initial weights, bi hidden layer polarisation values, and nn - number of neurons. For the rest of the neural networks, the Levenberg-Marquardt back propagation training algorithm and neural networks with feed-forward connections were used. The hidden layer number of neurons for each ANN is shown in Figure 5.
The aim is to optimise the cluster configuration using genetic algorithms (GA), minimising the total distance travelled in a defined time period, and considering the sales in all clusters. Thus the problem of finding a way to place a set of rectangular clusters of different sizes within larger rectangles (aisles), minimising the distance travelled to fill the customer orders, is analysed. This is an NP-complete problem, since the allocation patterns increase exponentially with the number of clusters. The number of clusters for the discussed case is 20, so the size of the solution search space is of the order of 1018, resulting from all possible permutations. A natural way to represent the search space problem for cluster arrangement is to assign an integer to each rectangle, so that each of the population individuals is formed with permutations of integers [19]. The order in which the numbers appear in the string represents their positions in the warehouse.
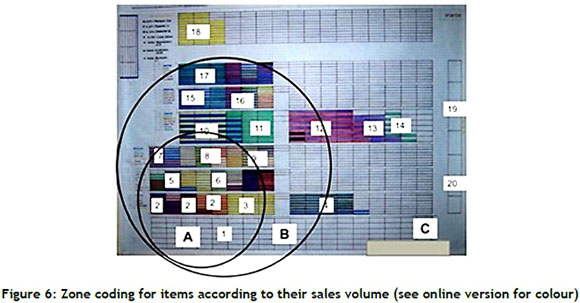
A case with 20 clusters with diverse dimensions depending on sales volume is analysed. The aim is to optimise the allocation of the clusters in the shelves that form the aisles of the warehouse. An individual numbered (1, 2, 3, 5, 6, 7, 8, 9, 10, 11, 15, 16, 17, 4, 12, 13, 14, 18, 19 20) could be a solution. This means that cluster 1 is the first to be placed near the region of study, followed by 2, 3, 5, 6, and so on. Once the cluster placement sequence is known, we proceed to determine how many of them can be grouped by their high sales turnover (A zone in Figure 6), middle (B), and low (C). This classification will be used to create the GA objective function, which will be evaluated by the picking distance travelled to fulfill the orders, considering the sales volume and cluster position (see equation 7). The inclusion of a cluster in a given zone is evaluated depending on whether its centroid is within or outside the boundary of each zone.
The following equation represents the GA objective function:

Where:
g - Cluster length, p- Number of simple and double shelves, q - cluster number in a specific aisle, di - Distance (m) to the cluster centroid i , - Picking frequency to a specific cluster j, Ci, Ck - feasible / Not feasible cluster position i, 6k - Distance (m) to the cluster centroid k and Yi - Picking frequency of a group of common parts.
The objective function minimizes the total distance travelled in a period of time. This function is a combination of the distance in mono- and multi-product picking, multiplied by the number of times travelled to fulfill from certain locations, and considering whether the event is feasible or not. The augend represents one product and the addend multiproduct picking events, the ΣΣ - all possible combinations that may occur from storage shelves (first Σ) and clusters (second Σ). The initial value of 1 in the first Σ establishes that the product(s) are supplied from any existing racks in the warehouse. The first constraint establishes that only feasible clusters placed in the shelves are considered in the total travelled distance. It is presented as occurrence limited to binary value, since only feasible events will have a value of 1, and the feasibility will be generated if the sum of the distance from the clusters located in certain shelves is less than the total distance to those shelves. The second constraint eliminates negative values.
To achieve objective function optimisation, the following genetic operators were considered:
• The selection operator - The fittest individual's selection is done through the roulette [20].
• The crossover operator - The partially-matched crossover (PMX) [21] was selected. In this crossing, the operator randomly selects two crossover points from the parent's chromosomes to produce the offspring. The two crossover points give a matching selection that is used to effect a cross-through position exchange operation. Taking the studied company's situation as an example: two chains p1 (17, 4, 14, 15... 18, 9, 16, 5, 11, 19) and p2 (19, 20, 8, 13... 4, 9, 1, 17, 3, 2); and if the randomly-selected substring from p1 to be inserted in p2 substring is (16, 5, 11, 19), this substring establishes a relationship with (1, 17, 3, 2) that occupies the same positions in p2. Then the operation sequence transforms p2 into (19, 20, 8, 13™ 16, 5, 11, 19) from which the duplications are deleted. In the last step the blanks are filled with numbers not included in the chain.
• Mutation and adaptation operator - The distance travelled over a period of time, based on the sales volume to optimise the clusters position, was established as the basis for calculating the adjustment or adaptation. The mutation used in the experiments is called 'order-based mutation' [22], and permutes the positions of two genes from the same individual.
3 RESULTS
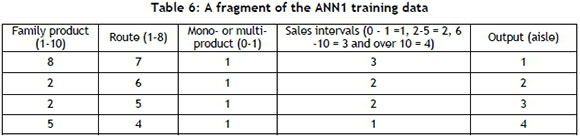
The data considered for the ANN1 training are: the data simulation runs, family membership, route range, types of orders (mono or multi), sales volume and the desired allocation. In Table 6 a fragment of the used data is shown.
Figures 7 and 8 show the comparison of the values obtained in the training, validation, testing, and performance of the ANN1. The performance is measured using the mean square error, which is achieved at time 259 without over-training the neural network.


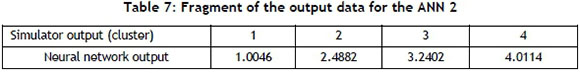
Once an item is assigned to an aisle, the neural network that will place it in a cluster only requires the predictor variables, family membership, and sales volume. Table 7 shows the assigned cluster allocation obtained from the simulator and ANN2. Note that the results produced by the simulator and ANN2 are similar.
Now the most relevant results obtained by coupling the genetic algorithms metaheuristic with the ANN are described. All the trials were performed on a PC with 2.13 GHz, 3 gigabytes of RAM, Intel core i3®, Windows 7®, MATLAB® version 2011. To establish the suitability of the results obtained, a bank of five different sales scenarios was designed for each variable. For the experimentation, the actual number of clusters (20), and the length and physical structure of the warehouse were considered. A particular encoding (crossover and mutation) was selected and the genetic algorithm was applied to find a better adaptation of the picking distance. Due to the random nature of the AG, it was decided to repeat the experiment 10 times, and the average of the obtained values was taken as the result. The parameters used in the experiments were: crossover probability - 0.9, number of generations - 500, population size - 10, and mutation probability - 0.1. When cluster configurations resulted in greater picking distance, the less fit individuals were replaced.
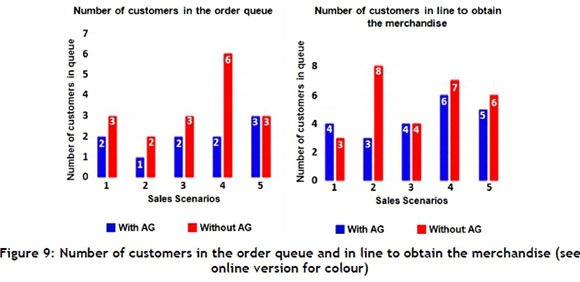
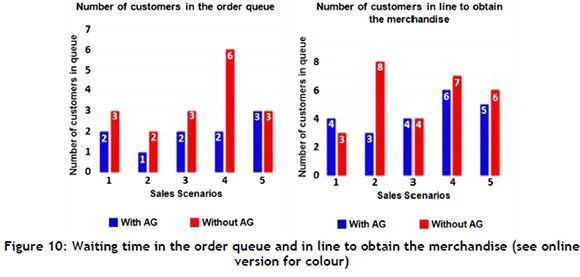
Figure 9 shows the behaviour of the variables 'number of customers in the order queue' and 'number of customers in line to obtain the merchandise'. The blue bars represent the optimised case. Note that there is significant difference when compared with the red bars, which represent the behaviour of the variables without the application of AG difference. Figure 10 shows the same behaviour for the waiting time variable.
4 DISCUSSION
The results obtained in this study indicate that an artificial neural system with a defined structure can be trained to assign a product to a category, belonging to a warehouse zone, as an expert would do it. It is also shown that pattern recognition can be applied as a technique to implement an intelligent product allocation in warehouses of retail companies that do not produce sufficient data. This approach adapts itself to the dynamic behavior of real retail systems, where a location may no longer be relevant with time, and may require another change due to its increased volume sales. Furthermore, recognition of the predictor variables that identify a certain item as a member of a predefined class (cluster) is fundamental. Choosing other variables, omitting some, or considering more could result in the assigning of allocations that do not correspond to the actual dynamics of the system and that affect its overall performance.
This approach raises an important range of applications, such as the possibility of automating areas of reception areas, or placing products in locations where they will be stored, manufactured, etc. The coupling of genetic algorithms for the physical evaluation of allocations in a warehouse converts the static mapping that artificial neural networks perform into an iterative / sequential system.
This makes it possible that, for well-studied time intervals defined by the users, neural networks can be synchronized using a function that will minimize material handling costs by relocating clusters according to the merchandise volume sales.
5 CONCLUSION
The use of metaheuristics has become an alternative way to solve industrial engineering problems, especially in algorithms that require the fulfillment of assumptions that often are difficult to meet in reality (balancing resources, indivisibility, assigning only one agent to a single task, etc.). In this paper we have presented a methodology that provides relevant solutions to a typical combinatorial optimisation problem, which is to assign locations to items in a warehouse. The objective function referred to in the simulation model considers that this allocation should ensure quick and efficient access to the merchandise. The application of the proposed method in the studied company showed a solution to a typical fit problem, where a set of predictor variables are compared against a searched response variable. The use of a system of neural networks and genetic algorithms that not only considers the allocation based on certain inputs, but also generalises and optimises the estimation of the outputs to inputs that were not used in the training phase is proposed. This system is designed to minimise picking distances, based on an intelligent product allocation when arriving from the suppliers.
REFERENCES
[1] Hsieh, L. & Tsai, L. 2005. The optimum design of a warehouse system on order picking efficiency, The International Journal of Advanced Manufacturing Technology, 28(5-6), pp 626-637. [ Links ]
[2] Tompkins J.A. & White J.A. 2010. Facilities planning, 4th edition, John Wiley & Sons. [ Links ]
[3] Malmborg, C.J. 2012. Application of storage consolidation intervals to approximate random storage transactions times with closest open location load dispatching, The International Journal of Production Research, 50(24), pp 7242-7255. [ Links ]
[4] De Koster, R., Le-Duc, T. & Roodbergen, K.J. 2007. Design and control of warehouse order picking: A literature review, European Journal of Operational Research, 182(2), pp 481-501. [ Links ]
[5] Glock, C. & Grosse, E. 2012. Storage policies and order picking strategies in U-shaped order-picking systems with a movable base, The International Journal of Production Research, 50(16), pp 4344-4357. [ Links ]
[6] Caron, F., Marchet, G. & Perego, A. 1998. Routing policies and COI-based storage policies in picker-to part systems, The International Journal of Production Research, 36(3), pp 713-732. [ Links ]
[7] Estrada, R., Garcia, D. & Sanchez, V. 2009. Competitive success determinant factors in PYMES: An empirical study in México, Venezuelan Management Journal, 14(46), pp 169-182. [ Links ]
[8] Petersen, C. & Aase, G. 2004. A comparison of picking, storage and routing policies in manual order picking. The International Journal of Production Economics, 92 (1), pp 11-19. [ Links ]
[9] Muppani, V. & Adil, G. 2008. Efficient formation of storage classes for warehouse storage location assignment: A simulated annealing approach. Omega, 36 (4), pp 609-618. [ Links ]
[10] Ene, S. & Öztürk, N. 2012. Storage location assignment and order picking optimization in the automotive industry. The International Journal of Advanced Manufacturing Technology, 60, pp 787-797. [ Links ]
[11] Hsu, C., Chen, K. & Chen, M. 2005. Batching orders in warehouses by minimizing travel distance with genetic algorithms. Computers in Industry, 56 (2), pp 169-178. [ Links ]
[12] Tsai, C., Liou, J. & Huang, T. 2008. Using a multiple-GA method to solve the batch picking problem: Considering travel distance and order due time. The International Journal of Production Research, 46 (22), pp 6533-6555. [ Links ]
[13] Coss, R. 1998. Simulation, a practical approach, 2nd edition, Limusa. [ Links ]
[14] Sargent, R. 2007. Verification and validation of simulation models. Proceedings of the 2007 winter simulation conference, S. G. Henderson, B. Biller, M.-H. Hsieh, J. Shortle, J. D. Tew, and R. R. Barton (eds). [ Links ]
[15] Vidmar, G., Blagus, R., Vidmar, G., Strelec, L. & Stehlik, M. 2011. Business indicators of healthcare quality: Outlier detection in small samples. Applied Stochastic Models in Business and Industry, Wiley Online Library. [ Links ]
[16] Pulido, H. & De la Vara, R. 2008. Analysis and design of experiments, 2nd edition, McGraw-Hill. [ Links ]
[17] Roodbergen, K. 2001. Layout and routing methods for warehouses, PhD thesis, RSM Erasmus University, The Netherlands. [ Links ]
[18] Ahmed, S., Rahman, M. & Islam S. 2014. House rent estimation in Dhaca City by multi-layer perceptron neural network, The International Journal of u- and e-service, Science and Technology, 7 (4), pp 287-300. [ Links ]
[19] Gómez, A., De la Fuente, D. & Priore P. 2000. Solving the strip-packing problem by genetic algorithms metaheuristic, Bulletin of Statistics and Operations Research, 16 (2), pp 12-16. [ Links ]
[20] Goldberg, D. 1989. Genetic algorithms in search, optimization, and machine learning, 1st edition, Addison-Wesley Professional. [ Links ]
[21] Sivanandam, S. & Deepa S. 2008. Introduction to genetic algorithms, 1st edition, Springer Berlin Heidelberg. [ Links ]
[22] Davis, L. 1991. Handbook of genetic algorithms, 1st edition, Van Nostrand Reinhold. [ Links ]
Submitted by authors 2 Mar 2015
Accepted for publication 6 Dec 2015
Available online 10 May 2016
* Corresponding author ocruzpicyt@ciatec.mx

