


Services on Demand
Article
 English (pdf)
 Article in xml format
 Article references
Indicators

Related links
-
 Cited by Google
 -
 Similars in Google
Share

 Permalink
South African Journal of Industrial Engineering
On-line version ISSN 2224-7890
Print version ISSN 1012-277X
S. Afr. J. Ind. Eng. vol.27 n.1 Pretoria May. 2016
http://dx.doi.org/10.7166/27-1-486
GENERAL ARTICLES
Improving forecasts for better decision-making
R. Siriram*
Department of Mechanical, Industrial and Aeronautical Engineering University of the Witwatersrand Johannesburg, South Africa
ABSTRACT
Improving the forecasting process may enable managers to make better decisions. In this paper, the forecasting process includes three factors: [A] forecasting input factors, [B] competitive advantage factors, and [C] forecasting effectiveness factors. It is proposed that a deeper understanding of the links between [A], [B] and [C] will lead to improvements in forecasting and better decision-making. The objective of this paper is to develop a model that will allow managers to improve forecasting by better understanding the links in the model. Structural equation modelling (SEM) is used to test the model. Twenty-two hypotheses are tested, of which 18 are accepted.
OPSOMMING
Die verbetering van die voorspellingsproses mag bestuurders daartoe in staat stel om beter besluite te neem. Die voorspellingsproses wat in hierdie artikel bespreek word sluit drie faktore in, naamlik [A] voorspellingsinsetfaktore, [B] mededing-endevoordeelfaktore en [C] voorspellingseffektiwiteitsfaktore. Dit word voorgestel dat 'n dieper verstaan van die skakels tussen [A], [B] en [C] tot verbeteringe in voorspel en beter besluitneming sal lei. Die doel van dié artikel is om 'n model, wat bestuurders sal toelaat om voorspelling te verbeter deur die skakel in die model, te ontwikkel. Strukturele vergelykingmodellering word gebruik om die model te toets. Twee-en-twintig hipoteses word getoets, waarvan daar agtien aanvaar word.
1 INTRODUCTION
This paper makes a contribution to knowledge in respect of understanding the links in the forecasting process. An understanding of these links may lead to improvements in forecasting, which in turn will enable managers to make better decisions. Much research has been done on forecasting input factors such as support systems [51], the design features of forecasting support systems [21], judgmental and interactive forecasting [35], incorporation of event information to manage information integration [60], and the process involved in using a forecasting support system [26], [27]. These researchers suggest that a better understanding of the forecasting process rests on certain factors that are necessary to improve forecasting and the overall decision-making process.
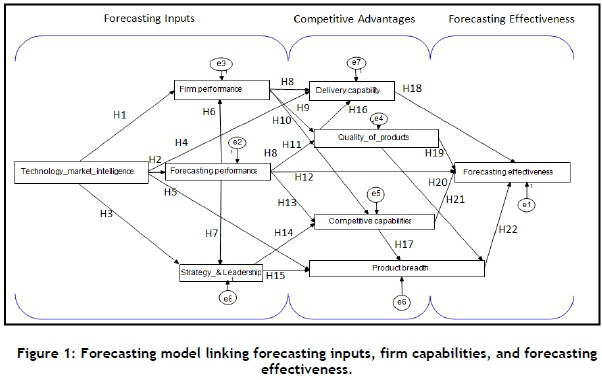
In this paper, these factors include [A] forecasting input factors, [B] competitive advantage factors, and [C] forecasting effectiveness. The links to [A], [B] and [C] are shown in Figure 1 and discussed in section 2. The central question posed is: Can overall [C] forecasting effectiveness be improved by linking [A] forecasting input factors to [B] competitive advantage factors? A forecasting model is developed that links [A], [B] and [C] as follows:
• [A] forecasting input factors such as early involvement (which in this paper includes technology and market intelligence), strategy and leadership, forecasting performance, and firm performance [35] suggests that forecasting performance relates to the reliability and value of the information supplied and the ability to drive firm performance, linked to:
• [B] competitive advantage (which in this paper include delivery capability, quality of products, competitive capabilities, and product breadth), linked to:
• [C] forecasting effectiveness (which in this paper includes factors such as accuracy and bias, responsiveness, uncertainty, and estimation).
Before understanding the concepts involved in [A] forecasting input factors and developing links to [B] competitive advantage and [C] forecasting effectiveness, it is necessary to see what has already been done. Many researchers have contributed to mathematical forecasting, including Ayres [5], Bass [6], Christensen [13, 14], Mahajan, Muller and Bass [36], Martino [38, 39], Oliver and Yang [42], Olson and Choi [43], Porter [45], Siriram and Snaddon [49], Young and Ord [65], and Young [67]. In addition Anderson et al. [2] give a comprehensive citation of various methods used. However, authors such as Smith and Mentzer [50] say that in worst cases, poor forecasting can contribute to major financial losses. Tidd et al. [55] refer to a 1986 report on forecasting by Schnaars and Berenson, showing, in an assessment of the accuracy of forecasts in respect of growth markets since the 1960s, that the list of failures is as long as the list of successes. Others such as Ferrara and Van Dijk [20] commented on forecasting the business cycle through major recessions. Moreover, Stekler [52] suggests that more research is required to understand better the forecasting process. Clearly much work has been done on forecasting; but a better understanding of the forecasting process is necessary to enable managers to make more accurate decisions.
As a result, authors such as Coates et al. [16] question the goals of forecasting. They argue that most forecasts focus on the accuracy of forecasts. This should not be the intention of forecasting; rather, forecasting should be used to define a set of alternatives or trends from which the forecaster can choose. That is, it may be better to understand the impact of forecasting on firm behaviour rather than spend too much effort on getting the numbers right. Other authors such as Rogers [46] argue that it is more important to look for general trends than to focus on the accuracy of mathematical forecasts. Yoo and Moon [66] suggest that, instead of trying to choose the best single method, one should combine methods from different results, which would result in improving forecasts. This view is supported by Wang and Lan [58], who suggest a combined forecast process to obtain improved forecasts. Varho and Tapio [57] also suggest combining qualitative and quantitative techniques to obtain improved forecasts. In addition, Lawrence [32] points out that future research in forecasting should focus on understanding the business needs of forecasting. Moreover, Smith and Mentzer [50], Goodwin et al. [26, 27], Fildes et al. [23], and Winklhofer and Diamantopoulos [62] propose improving forecasting effectiveness by understanding the different links in the forecasting process. More recently, Becker [7] argues that managers must apply some discriminatory procedure when selecting a preferred forecasting model. Chang [10] suggests that the forecasting process is complex, subject to many influences. While findings vary, the message is a call for a deeper understanding of forecasting. Thus obtaining a better understanding of the forecasting process and of the links ([A] forecasting input factors, [B] competitive advantage factors, and [C] forecasting effectiveness) is required.
2 LITERATURE SURVEY AND HYPOTHESIS DEVELOPMENT
From the literature survey, forecasting may be broadly grouped into three factors. Factor one includes [A] forecasting input factors - that is, having the necessary forecasting support systems so that the necessary building blocks of forecasting are in place. Forecasting input factors include the inputs from appropriate technology and marketing intelligence and support from the firms' leadership, ensuring that forecasting is recognised at a strategic level. Factor two includes [B] competitive advantage (that is, links from forecasting input factors that lead to competitive advantage); and factor three includes [C] forecasting effectiveness (that is, forecasting is viewed as a tool that decision-makers can rely upon and actively use at an operational level). Figure 1 is a graphical representation of the three categories.
In this paper, factor one, [A] forecasting input factors, may include factors such as a) technology and market intelligence, b) strategy and leadership, c) forecasting performance, and d) firm performance.
• First, considering a) technology and market intelligence, researchers such as Takayama et al. [54] and Watanabe et al. [59] favour technology and marketing knowledge as a driver for product growth. Savioz and Blum [48] show how the technology and market links with business strategy to anticipate technological trends. Other authors argue that early involvement is necessary in driving forecasting. Molina-Castillo et al. [41] refer to authors such as Millson and Wilemon [40], Chiu et al. [12] and Pauwels et al. [44]. Others such as Cormican and O'Sullivan [17] favour product innovativeness or growth. It may therefore be concluded that early involvement in technology and market intelligence is important.
• Next, considering b) strategy and leadership, Makridakis [37] and Faucheux [19] see forecasting as significant for strategy and planning, Cormican and O'Sullivan [17] have shown the impact of strategy and market intelligence on product growth.
• Next, considering c) forecasting performance, Lim and O'Connor [35] argue that forecasting performance needs to be reliable and to demonstrate value in terms of the information supplied, and be a valuable input in driving firm performance. Smith and Mentzer [50] show the influence of systems and procedures on forecasting performance.
• Finally, considering d) firm performance, Gourville [28] and Russell and Taylor [47] show links to firm performance. It may therefore be concluded that input factors (a,b,c,d) are the necessary building blocks for category two, [B] competitive advantage.
In relation to factor two, [B] competitive advantage, authors such as Tracey et al. [56] have linked early involvement in strategy and technology formulation to competitive advantage and firm performance. Tracey et al. [56] refer to competitive advantage as those factors that include delivery capability, quality of products, competitive capabilities, and product breadth. Some examples of links from forecasting input factors to competitive advantage include links to marketing, operations, and purchasing [8]; and links from sales to production [24]. In addition, Da Silveira [18] shows how products and markets link to drive competitive advantage. Furthermore, Leslie and Holloway [34] show how marketing, product growth, and sales link to purchasing, products, manufacturing engineering, and operations and planning. Given such research evidence, [A] forecasting input factors may be linked to [B] competitive advantage.
On factor three, improving [C] forecasting effectiveness, authors such as Winklhofer and Diamantopoulos [63] and Fildes and Hastings [24] show how factors such as accuracy and bias, responsiveness, uncertainty, and estimation improve forecasting effectiveness. Building on this foundation, Fildes et al. [22] argue that there are major shortcomings with forecasting, and that using judgmental adjustments will only improve forecasting effectiveness. Fildes et al. [21, 23] and Asimakopolos and Dix [4] discuss how the effectiveness of forecasting can be improved through the necessary support systems, which in this paper include both [A] forecasting input factors and [B] competitive advantage. As a result of this vast array of network involvement within the firm and with other firms, Chakravorti [15] sees difficulties arising largely from network characteristics. Thus a deeper understanding of links from the forecasting input factors to competitive advantage may assist firms in improving their forecasting effectiveness.
From the literature survey, relevant constructs were developed. These include factor one [A] forecasting input factors consisting of technology and market intelligence [17], firm performance [9], forecasting performance [62], and the firms' strategy and leadership [17]; factor two, competitive advantages [56]; and factor three, forecasting effectiveness [63].
In this paper, a model linking [A] forecasting input factors (technology and market intelligence, firm performance, forecasting performance, and strategy and leadership) to [B] competitive capabilities (delivery capabilities, quality of products, competitive capabilities, and product breadth) to improving overall [C] forecasting effectiveness is developed. Each of the factors in the model is discussed next.
1.1 [A] Forecasting input factors
Since the firm is vulnerable to outside influence from a vast array of ideas [11], a more collaborative approach facilitating a better understanding of market influences is necessary [31], [30], [33]. In summary, [A] forecasting input factors are likely to include factors such as, technology and market intelligence, firm performance, forecasting performance, and strategy and leadership. Forecasting technology and market intelligence are seen as inputs to drive firm performance, forecasting performance, and strategy and leadership. Forecasting performance includes factors such as our ability to forecast sales, the confidence of our decision-makers in sales forecasting, and our sales forecasting capabilities compared with those of our competitors. The strategic and leadership effects of forecasting focus on how firms have adopted a strategic view of the forecasting processes. The following hypotheses are therefore proposed:
H1: Technology and market intelligence positively affects firm performance.
H2: Technology and market intelligence positively affects forecasting performance.
H3: Technology and market intelligence positively affects strategy and leadership.
Having linked technology and market intelligence, links to [B] competitive advantage (delivery capability, quality of products, competitive pricing and product breadth) are discussed next.
1.2 [B] Firm competitive advantage
Competitive advantage is seen to include at least delivery capability, quality of products, competitive pricing, and product breadth. Leslie and Holloway [34] draw links from sales to manufacturing. So the following hypotheses are proposed:
H4: Technology and market intelligence positively affects delivery capability. H5: Technology and market intelligence positively affects product line breadth. H6: Forecasting performance positively affects firm performance. H7: Forecasting performance positively affects strategy and leadership.
Next, firm performance, forecasting performance, and strategy and leadership link to [B] competitive advantage (delivery capability, quality of products, competitive capabilities, and product breadth) are considered. Thus hypotheses H8 to H17 are proposed:
H8: Firm performance positively affects delivery capability.
H9: Firm performance positively affects quality of products.
H10: Firm performance positively affects competitive capabilities.
H11: Forecasting performance positively affects quality of products.
H12: Forecasting performance positively affects forecasting effectiveness
H13: Forecasting performance positively affects competitive capabilities.
H14: Strategy and leadership positively affects competitive capabilities.
H15: Strategy and leadership positively affects product breadth.
H16: Quality of products positively affects delivery capability.
H17: Competitive capabilities positively affect product breadth.
Next, links from firm [B] competitive advantage to [C] forecasting effectiveness are discussed.
1.3 [C] Forecasting effectiveness
Tracey et al. [56] link competitive advantage to firm performance. Others such as Russell and Taylor [47] include customer demand factors such as scheduling, inventory, production, facility layout, workforce, distribution, and purchasing as competitive advantage. Others such as Molina-Castillo [41] give various other measures, linking competitive advantage to overall firm performance. Thus in this paper competitive advantage includes factors such as delivery capability, quality of products, competitive capabilities, and product breadth. As a result of being able to derive better competitive advantage, links to forecasting effectiveness are established. Thus the following hypotheses are proposed:
H18: Delivery capability positively affects forecasting effectiveness.
H19: Quality of products positively affects forecasting effectiveness.
H20: Forecasting performance positively affects forecasting effectiveness.
H21 : Competitive capabilities positively affect forecasting effectiveness.
H22: Product breadth positively affects forecasting effectiveness.
In total, 22 hypotheses are proposed, linking [A] forecasting input factors (technology and market intelligence, firm performance, forecasting performance, and strategy and leadership) to firm [B] competitive advantage (delivery capability, quality of products, competitive capabilities, and product breadth) and [C] forecasting effectiveness. These hypotheses show how [A], [B] and [C] are linked.
Having discussed the hypotheses, the research methodology is discussed next.
2 RESEARCH METHODOLOGY
2.1 Data collection and sample
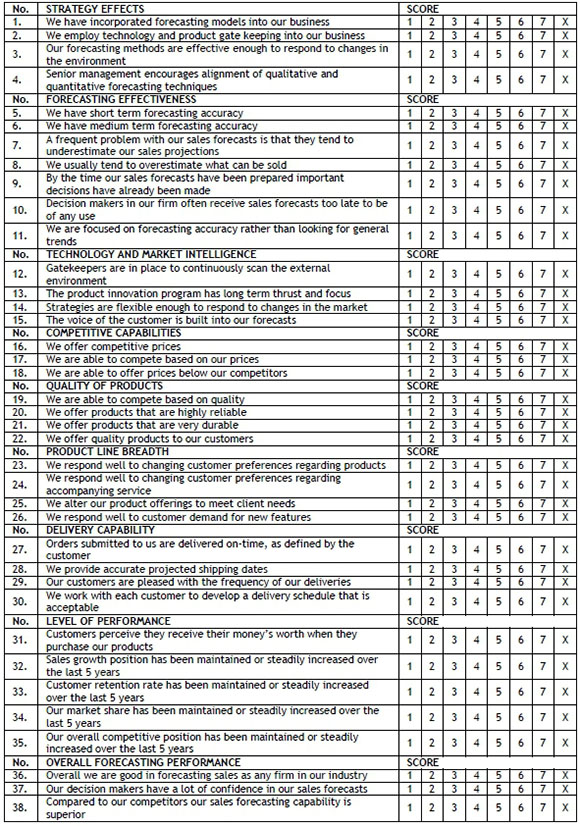
The research consisted of a survey process. The research instrument was developed through an extensive literature survey. The industries selected included electronics and electrical, information and communications technology, fast-moving consumer goods (FMCG), and logistics and financial industries. Firms participating in the research were chosen from lists of germane publications; the selection was based on firms that were willing to participate in the research and firms who were using forecasting as a business tool. This resulted in a total sample size of 475 firms. The instrument consisted of 38 questions, all of which were used in the final study after testing. The majority of the questions consisted of 7-point Likert scales, although some forced ranking questions were also used.
The responses ranged from 1-7, and in each case 1-7 was defined. The response X = Not relevant/Do not know was also made available.
Initially a pre-test was conducted. This consisted of a sample of 20 respondents who were selected to test the survey's overall clarity, structure, relevance and wording. The pre-test was then followed by a pilot test, which consisted of a sample size of 32. Cronbach alpha tests were performed for the pilot group. Cronbach alpha values below 0.75 were removed from the analysis [29]. The instrument was modified and distributed to the main group. The normal procedures for exploratory research were followed: initial electronic contact was made through email; thereafter the instrument was made available through a website, which included a document summarising the objectives of the research. The website largely improved the facilitation of responses. Several personalised follow-up emails were sent over a two-month period. Of the 475 questionnaires distributed, 175 completed questionnaires were returned; of these, 12 where unusable and were removed, leaving 163 useable questionnaires, representing a response rate of 34.3%.
2.2 Analysis of results
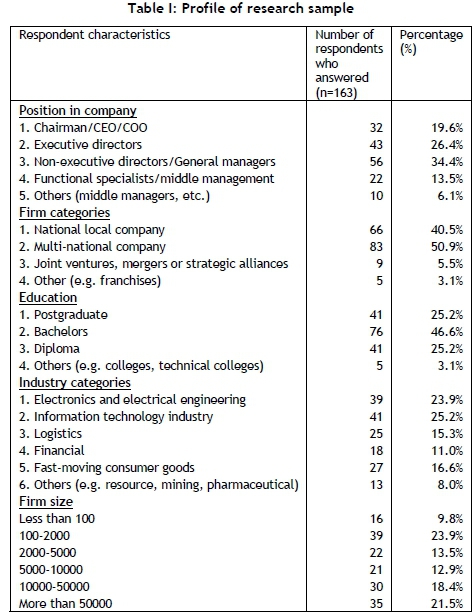
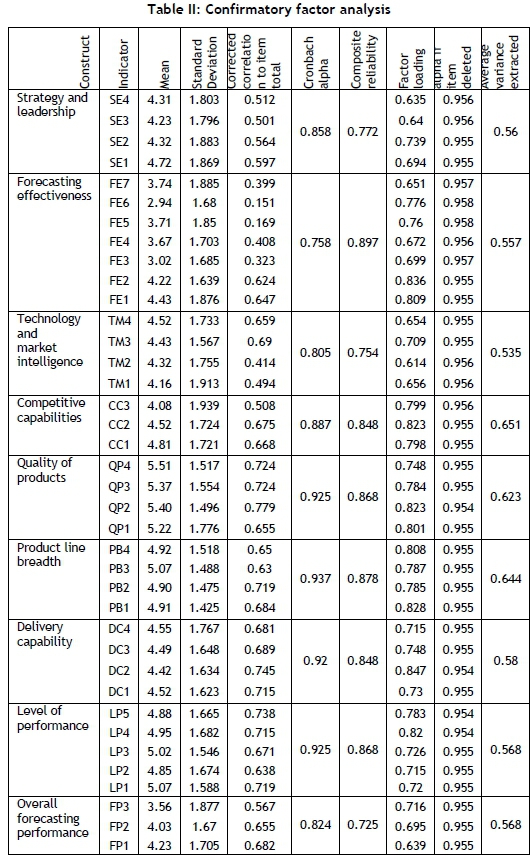
Table I summarises the demographic characteristics of the respondents. The sample was checked for sample representivity. Chi-squared distribution analyses revealed no significant differences between our sample and the population from which it was drawn in terms of industry distribution, number of employees, and firm size. Table II gives the confirmatory factory analysis.
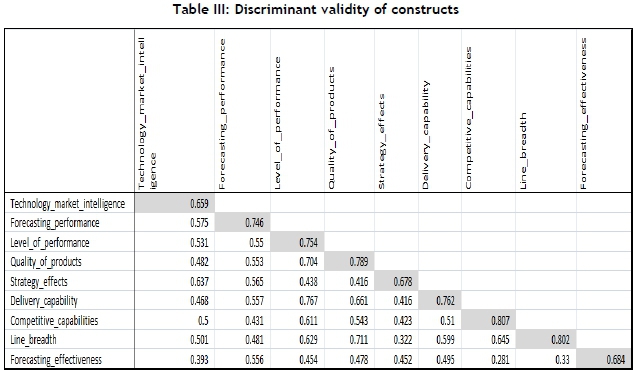
In addition, the discriminant validity of the instrument was verified by comparing the average variance extracted for each latent construct to the square of the correlation between this construct and every other construct used in the research. The result is shown in Table III, confirming the discriminant validity: the square of the average variance extracted for each construct is greater than the levels of correlation involving the construct. The results of the inter-construct correlations also show that each construct shares larger variance with its own measures than with other measures.
First, as suggested by Anderson and Gerbing [1], the 99 per cent confidence intervals around the correlation parameter estimated between all possible pairs of scales, and established that none of these intervals included one. Second, the square of the correlation between any two constructs was less than the average extracted estimates. Overall, the results show an adequate level of reliability and validity.
2.3 The structural model
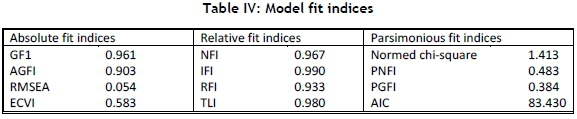
Structural equation modelling was used to test the investigative framework. The model was developed using AMOS 17.0. For the model fit indices the methodologies given by Hair et al. [29], Yang and Su [64], and Williams and Hazer [61] were used. For structural equation modelling, 163 responses were received, which is acceptable (> 5* no. of distinct parameters, 5*29=145 [29]). The model has a chi-squared value of 25.430 and 18 degrees of freedom. The chi-squared statistical significance level of 0.114 is above the minimum level of 0.05 and more conservative levels of 0.10. This indicates that the model is a good fit. Table IV shows the model fit indices. The normed chi-square (X2 / df) has a value of 1.413. This falls well within the recommended levels of 1.0 to 2.0 [30]. The goodness of fit index (GFI) of 0.961 is also quite high; adjusting for model parsimony, the adjusted goodness of fit index (AGFI) value is 0.903, which is acceptable. The incremental fit indices - the Tucker-Lewis index (TLI) and the normed fit index (NFI) - are 0.980 and 0.967 respectively, and are above the recommended levels of 0.90; the RMSEA at 0.054 is below the suggested threshold value of 0.08.
3 DISCUSSION OF RESULTS
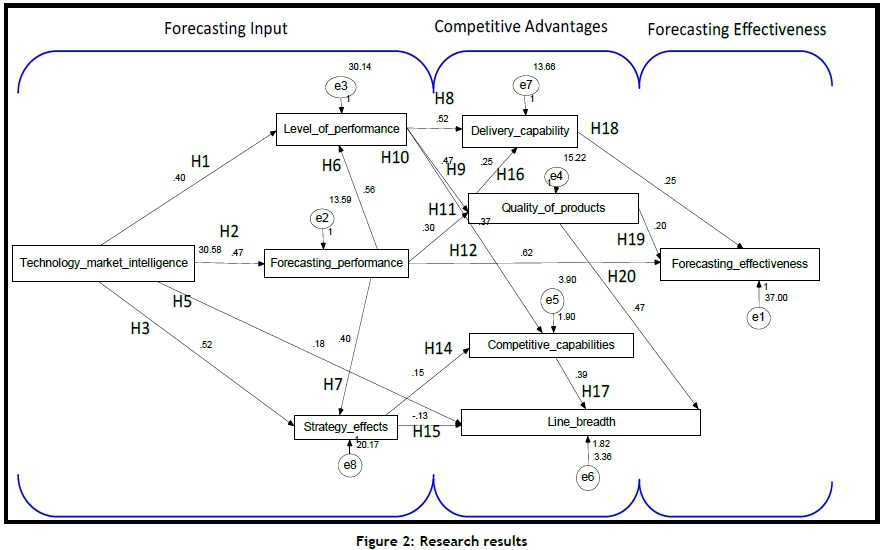
The main objective of the study is to investigate how forecasts may be improved for better decision-making. The central question posed is, Can overall forecasting effectiveness be improved by linking [A] forecasting input factors to [B] competitive advantage factors? Using the investigative model (Figure 1 and Figure 2), factors in forecasting [A], [B] and [C] are studied to understand the linkages better. The research results provide a strong overall validation of the investigative framework, given the model fit indices in Table IV. The structural model is shown in Figure 2, showing each of the hypotheses. Table V shows how each of the 22 hypotheses is either supported or not supported.
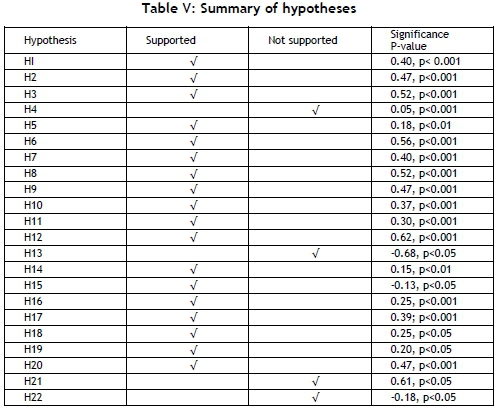
Of the 22 hypotheses, 18 out were supported. Hypotheses H4, H13, H21 and H22 were not supported. It is proposed that other constructs be investigated to understand better how these hypotheses might influence the forecasting investigative framework. From this study it is evident that forecasting effectiveness may be improved through ensuring that certain forecasting building blocks are in place.
4 LIMITATIONS OF THE RESEARCH
While the study analysed firms in the electronics and electrical, information technology, fast-moving consumers goods. and financial industry sectors, the research could be extended to investigate the relationship between industry sectors as well as relationships between national, multi-national, and small-to-medium enterprises (SMEs). The research could also be extended to compare forecasting effectiveness between different countries. Other factors that could assist in improving the effectiveness of forecasting, such as IT systems, could also be investigated. Comparing forecasting effectiveness with firm size and firm maturity may also lead to interesting research.
5 FURTHER RESEARCH
Further research could involve the following:
1. Compare the relationships between different industry sectors.
2. Expand the research to other countries, and compare the differences between categories.
3. Investigate other drivers to improve the effectiveness of forecasting and how forecasting can improve firm performance. These drivers could include organisational learning, relationship management, and the firm's culture and climate.
4. Investigate other constructs - for example, the four hypotheses that could not be proved. These were H4: technology and market intelligence to delivery capability, H13: forecasting performance and competitive capabilities, H21: competitive capabilities and forecasting effectiveness, and H22: product breadth to forecasting effectiveness.
6 CONCLUSION
The research looked at the factors driving forecasting effectiveness. Several linkages were found to forecasting effectiveness. Using the model developed in this research, several hypotheses were formed. The research shows that, given the correct focus of forecasting within the firm and the correct alignment of [A] forecasting input factors (technology and market intelligence, forecasting performance, strategy and leadership, and firm performance) to [B] firm competitive advantage (delivery capabilities, quality of products, competitive pricing, and product line breadth), [C] forecasting effectiveness may be improved. In terms of the central question posed - Can overall forecasting effectiveness be improved by linking forecasting input factors to competitive advantage? - the research evidence indicates that overall forecasting effectiveness may be improved by links in the forecasting model, with 18 out of 22 hypotheses supported. Furthermore, the model fit indices indicate that the model fit is within acceptable norms.
REFERENCES
[1] Anderson, J.C. & Gerbing, D.W. 1988. Structural equation modeling in practice: a review recommended two-step approach, Psychological Bulletin, 103(3), pp. 411-423. [ Links ]
[2] Anderson, R.T., Daim, T.U. & Kim, J. 2008. Technology forecasting for wireless communication, Technovation, 28, pp. 602-614. [ Links ]
[3] Armstrong, J.S. & Overton, T.S. 1977. Estimating non-response bias in mail surveys. Journal of Marketing Research, 14(30), pp. 61-83. [ Links ]
[4] Asimakopoulos, S. & Dix, A. 2013. Forecasting support systems technologies-in-practise: A model of adoption and use for product forecasting. International Journal of Forecasting, 29, pp. 322-336. [ Links ]
[5] Ayres, R.U. 1999. What have we learned? Technological Forecasting and Social Change, 62(1), pp. 9-12. [ Links ]
[6] Bass, F.M. 2004. A new product growth for model consumer durables, Management Science, 50(2), pp. 1825-1832. [ Links ]
[7] Becker, R., Clements, A.E., Doolan, M.B. & Huran, A.S. 2015. Selecting volatility forecasting models for portfolio allocation purposes, International Journal of Forecasting, 31, pp. 849-861. [ Links ]
[8] Bregman, R.L. 1995. Integrating marketing, operations, and purchasing to create value, Omega, International Journal of Management Science, 23(2), pp. 159-172. [ Links ]
[9] Calantone, R.J., Cavusgil, S.T. & Zhao, Y. 2002. Learning orientation, firm innovation capability, and firm performance, Industrial Marketing Management, 31(6), pp. 515-524. [ Links ]
[10] Chang, S. 2015. A structured scenario approach to multi-screen ecosystem forecasting in Korean communications market, Technological Forecasting and Social Change, 94, pp. 1-20. [ Links ]
[11] Chesbrough, H. 2003. Open-innovation. Boston, MA: Harvard Business School Press. [ Links ]
[12] Chiu, Y., Chen, B., Shyu, J.Z. & Tzeng, G. 2006. An evaluation model of new product launch strategy, Technovation, 26(11), pp. 1244-1252. [ Links ]
[13] Christensen, C.M. 1992a. Exploring the limits of technology S-curve Part 1: Component technologies, Production and Operations Management, 1(4), pp. 334-357. [ Links ]
[14] Christensen, C.M. 1992b. Exploring the limits of technology S-curve part II: Architectural technologies, Production and Operations Management, 1(4), pp. 358-366. [ Links ]
[15] Chakravorti, B. 2004. The new rules for bringing innovations to market, Harvard Business Review, March, pp. 27-35. [ Links ]
[16] Coates, J.F., Mahaffie, J.B. & Hines, A. 1994. Technological forecasting, Technological Forecasting and Social Change, 47, pp. 23-33. [ Links ]
[17] Cormican, K. & O'Sullivan, D. 2004. Auditing best practice for effective product innovation management, Technovation, 24, pp. 819-829. [ Links ]
[18] Da Silveira, G.J.C. 2005. Market Priorities, manufacturing configuration, and business performance: An empirical analysis of the order-winners framework, Journal of Operations Management, 23, pp. 662-675. [ Links ]
[19] Faucheux, C. 1996. Comments on "Forecasting: its role and value for planning and strategy" by Spyros Makridakis, International Journal of Forecasting, 12, pp. 539-554. [ Links ]
[20] Ferrara, L. & Van Dijk, D. 2014. Forecasting the business cycle, International Journal of Forecasting, 30, pp. 517-519. [ Links ]
[21] Fildes, R., Goodwin, P. & Lawrence, M. 2006. The design features of forecasting support systems and their effectiveness, Decision Support Systems, 42 (1), pp. 351-361. [ Links ]
[22] Fildes, R., Goodwin, P., Lawrence, M. & Nikolopoulos, K. 2009. Effective forecasting and judgmental adjustments: an empirical evaluation and strategies for improvement in supply-chain planning, International Journal of Forecasting, 25, pp. 3-23. [ Links ]
[23] Fildes, R. & Goodwin, P. 2013. Forecasting support systems: What we know, what we need to know. International Journal of Forecasting, 29, pp. 290-294. [ Links ]
[24] Fildes, R. & Hastings, R. 1994. The organization and improvement of marketing forecasting, The Journal of the Operations Research Society, 45(1), pp. 1-16. [ Links ]
[25] Fornell, C. & Larker, D.F. 1981. Evaluating structural equation models with unobservable variables and measurement error, Journal of Marketing Research, 18(1), pp. 39-50. [ Links ]
[26] Goodwin, P., Fildes, R., Lawrence, M. & Nikolopoulos, K. 2007. The process of using a forecasting support system, International Journal of Forecasting, (23), pp. 391-404. [ Links ]
[27] Goodwin , P., Fildes, R., Lawrence, M. & Stephens, G. 2011. Restrictiveness and guidance in support systems, Omega, International Journal of Management Science, 39, pp. 242-253. [ Links ]
[28] Gourville, J.T. 2006. Eager sellers and stoney buyers, Harvard Business Review, June, pp. 16-23. [ Links ]
[29] Hair, J.F. Jr., Anderson, R.E., Tatham, R.L. & Black, W.C. 1998. Multivariate data analysis. Prentice hall, 5th edition. [ Links ]
[30] Kaminski, P.C., de Oliveira, A.C. & Lopes, T.M. 2008. Knowledge transfer in product development process: A case study in small and medium enterprises (SMEs) of the metal-mechanic sector from São Paulo, Brazil, Technovation, 28(1-2), pp. 29-36. [ Links ]
[31] Keizer, J., Dijstra, L. & Halman, J.I.M. 2002. Explaining innovative efforts of SMEs? An exploratory survey among SMEs in the mechanical and electrical sector in the Netherlands, Technovation, 22, pp. 1-13. [ Links ]
[32] Lawrence, M. 2000. What does it take to achieve adoption in sales forecasting?, International Journal of Forecasting, 16, pp. 147-148. [ Links ]
[33] Le Blanc, L.J., Nash, R., Gallagher, D., Gonda, K. & Kakizaki, F. 1997. A comparison of US and Japanese technology management and innovation. International Journal of Technology Management, 13(5-6), pp. 601-614. [ Links ]
[34] Leslie, M. & Holloway, C.A. 2006. The sales learning curve, Harvard Business Review, July-August, pp. 4-12. [ Links ]
[35] Lim, J.S. & O'Connor, M. 1996. Judgmental forecasting with interactive forecasting support systems, Decision Support Systems, 16, pp. 339-357. [ Links ]
[36] Mahajan, V., Muller, E. & Bass, F.M. 1990. New product diffusion models in marketing: A review and directions for research, Journal of Marketing, 54, pp. 1-26 [ Links ]
[37] Makridakis, S. 1990. Forecasting: Planning strategy for the 21st century. New York: Free Press. [ Links ]
[38] Martino, J.P. 1993. Technological forecasting for decision-making. New York: McGraw-Hill. [ Links ]
[39] Martino, J.P. 1999. Thirty years of change and stability, Technological Forecasting and Social Change, 62(1), pp. 13-18. [ Links ]
[40] Milson, M.R. & Wilemon, D. 2006. Driving new product success in the electrical equipment manufacturing industry, Technovation, 26(11), pp. 1268-1286. [ Links ]
[41] Molina-Castillo, F. & Munuera-Aleman, J. 2009. New product performance indicators: Time horizon and importance attributed by managers, Technovation, 29, pp. 714-724. [ Links ]
[42] Oliver, R.M. & Yang, H.J. 1988. Saturation models: A brief survey and critique, Journal of Forecasting, 7, pp. 215-223. [ Links ]
[43] Olson, J. & Choi, S. 1985. A product diffusion incorporating repeat purchases, Technological Forecasting and Social Change, 27, pp. 385-397. [ Links ]
[44] Pauwels, K., Silva-Risso, J., Srinivasan, S. & Hanssens, D. 2004. New product sales promotions, and firm value: The case of the automobile industry, Journal of Marketing, 68(4), pp. 142-156. [ Links ]
[45] Porter, A.L. 1999. Tech forecasting: An empirical perspective. Technological Forecasting and Social Change, 62(1), pp. 19-28. [ Links ]
[46] Rogers, E.M. 1983. Diffusion of innovation, 4th edition. New York: Free Press:. [ Links ]
[47] Russell, R.S. & Taylor, B.W. 2003. Operations management, 4th edition. Prentice Hall. [ Links ]
[48] Savioz, P. & Blum, M. 2002, Strategic tool for SMEs: How the opportunity landscape interacts with business strategy to anticipate technological trends, Technovation, 22, pp. 91-100. [ Links ]
[49] Siriram, R. & Snaddon, D.R. 2010. Forecasting new product sales, South African Journal of Industrial Engineering, 21, pp. 123-135. [ Links ]
[50] Smith, C.D. & Mentzer, J.T. 2010. Forecasting task-technology fit: The influence of individuals, Systems and Procedures on Forecast Performance, 26, pp. 144-161. [ Links ]
[51] Spithourakis, G.P., Petropoulos, F. & Nikolopoulos, K. 2015, Amplifying the learning effects via a forecasting and foresight support system, International Journal of Forecasting, 31, pp. 20-32. [ Links ]
[52] Stekler, H.O. 2015. Forecasting - yesterday, today and tomorrow, International Journal of Forecasting, 31, pp. 96-98. [ Links ]
[53] Takayama, M. & Watanabe, C. 2002. Myth of market needs and technology seeds as a source of product innovation: An analysis of pharmaceutical new product development in an anti-hypertensive product innovation, Technovation, 22, pp. 353-362. [ Links ]
[54] Takayama, M., Watanabe, C. & Griffy-Brown, C. 2002. Remaining innovative without sacrificing stability: An analysis of strategies in the Japanese pharmaceutical industry that enable firms to overcome inertia resulting from successful market penetration of new product development, Technovation, 22, pp. 747-759. [ Links ]
[55] Tidd, J., Bessant, J. & Pavitt K. 2001. Paths: Exploiting technological trajectories, in: Managing innovation. Vol. 3, Chichester: Wiley. [ Links ]
[56] Tracey, M., Vonderembse, M.A. & Lim, J. 1999. Manufacturing technology and strategy formulation: Keys to enhancing competitiveness and improving performance, Journal of Operations Management, 17, pp. 411-428. [ Links ]
[57] Varho, V. & Tapio, P. 2013. Combining the qualitative and quantitative with O2 scenario technique - The case of transport and climate, Technological Forecasting and Social Change, 80(4), pp. 611-630 [ Links ]
[58] Wang, M. & Lan, W. 2007. Combined forecast process: Combining scenario analysis with the technological substitution model, Technological Forecasting and Social Change, 74, pp. 357-378. [ Links ]
[59] Watanabe, C., Lei, S. & Ouchi, N. 2009. Fusing indigenous technology development and market learning for greater functional development: An empirical analysis of the growth trajectory of Canon printers, Technovation, 29, pp. 265-283. [ Links ]
[60] Webby, R., O'Connor, M. & Edmundson, B. 2005. Forecasting support systems for the incorporation of event information: An empirical investigation, International Journal of Forecasting, 21, pp. 411-423. [ Links ]
[61] Williams, L.J. & Hazer, J.T. 1986. Antecedents and consequences of satisfaction and commitment in turnover models: A real analysis using latent variable structural equation models, Journal of Applied Psychology, 71(2), pp. 219-231. [ Links ]
[62] Winklhofer, H.M. & Diamantopoulos, A. 2002, Managerial evaluation of sales forecasting effectiveness: A MIMIC modelling approach, International Journal of Research in Marketing, 19, pp. 151-166. [ Links ]
[63] Winklhofer, H. & Diamantopoulos A. 2003. A model of export sales forecasting behavior and performance: Development and testing, International Journal of Forecasting, 19(2), pp.271-285. [ Links ]
[64] Yang, C. & Su, Yi-Fen. 2008. The impact of ERP Implementation on corporate SCM performance: From an operational and information integration perspective. Proceedings of the 2008 IEEE IEEM Conference, 9781-4244-2630-0/08, pp. 1668-1672. [ Links ]
[65] Young, P. & Ord, J.K. 1989. Model selection and estimation for technological growth curves, International Journal of Forecasting, 5, pp. 501-513. [ Links ]
[66] Yoo, S.H. & Moon, H.S. 2006. An estimation of the future demand for portable internet service in Korea, Technological Forecasting and Social Change, 73(5), p. 575-587. [ Links ]
[67] Young, P. 1993, Technological growth curves: A competition of forecasting models, Technological Forecasting and Social Change, 44, pp. 375-389. [ Links ]
Submitted by authors 16 Nov 2012
Accepted for publication 5 Nov 2015
Available online 10 /May 2016
* Contact details: raj@alpha-concepts.com
APPENDIX: RESEARCH QUESTIONNAIRE (SCREENER QUESTIONS NOT SHOWN)
For questions 1 to 38 please select the most appropriate choice. Where 1 = Least likely, 7=Most likely and X= Do not know

