Servicios Personalizados
Articulo
Indicadores
Links relacionados
-
 Citado por Google
 -
 Similares en Google
Compartir
South African Journal of Industrial Engineering
versión On-line ISSN 2224-7890
versión impresa ISSN 1012-277X
S. Afr. J. Ind. Eng. vol.27 no.1 Pretoria may. 2016
http://dx.doi.org/10.7166/27-1-982
GENERAL ARTICLES
The design and implementation of a garbage truck fleet management system
C.H. ChenI, II, *; Y.T. YangI; C.S. ChangI; C.M. HsiehI; T.S. KuanI; K.R. LoI
ITelecommunication Laboratories Chungwa Telecom Co., Ltd. Taiwan, Republic of China
IIDepartment of Information Management and Finance National Chiao Tung University Hsinchu, Taiwan, Republic of China
ABSTRACT
In recent years, the improvement of cloud computing and mobile computing techniques has led to the availability of a variety of mobile applications ('apps') in the app store. For instance, a garbage truck app that can provide the immediate location of a garbage truck, the location of collection points, and forecasted arrival times of garbage trucks would be useful for mobile users. Since the power consumption of apps on mobile devices if of concern to mobile users, an optimised power-saving mechanism for updating messages, which is based on location information, for a proposed garbage truck fleet management system (GTFMS) is proposed and implemented in this paper. The GTFMS is a three-component system that includes the on-board units on garbage trucks, a fleet management system, and a garbage truck app. In this study, an arrival time forecasting method is designed and implemented in the fleet management system, so that the garbage truck app can retrieve the forecasted arrival time via web services. A message updating event is then triggered that reports the location of garbage truck and the forecasted arrival time. In experiments conducted on case studies, the results showed that the mean accuracy of predicted arrival time by the proposed method is about 81.45 per cent. As for power consumption, the cost of traditional mobile apps is 2,880 times that of the mechanism proposed in this study. Consequently, the GTFMS can provide the precise forecasted arrival time of garbage trucks to mobile users, while consuming less power.
OPSOMMING
Die verbetering van wolkverwerking en mobiele verwerkings-tegnieke het gelei tot die beskikbaarheid van 'n groot verskeidenheid mobiele toepassings. 'n Voorbeeld hiervan is 'n toepassing wat die onmiddellike ligging van 'n vullistrok, die ligging van vullis versamelpunte en die voorspelde aankomstye van die vullistrokke aan die gebruiker verskaf. Die energieverbruik van die toepassings is ook van belang en 'n geoptimeerde energie-besparingsmeganisme vir die opdateer van boodskappe (wat inligting rakende die vullistrok se ligging bevat) word in hierdie artikel ontwerp en geïmplementeer. 'n Opdateringsboodskap rapporteer die vullistrok se ligging en voorspelde aankomstyd. Gevallestudies toon dat die gemiddelde akkuraatheid van die voorspelde aankomstyd 81.45% is. Die energieverbruik van die toepassing is 2880 keer minder as dié van 'n tradisionele mobiele toepassing. Gevolglik kan die voorgestelde vullistrokvlootbestuur-stelsel 'n baie akkurate aankomstyd voorspelling aan gebruikers gee terwyl dit min energie verbuik.
1 INTRODUCTION
In recent years, the improvement of cloud computing and mobile computing techniques has led to the availability of a variety of mobile applications in the app store [1-3]. Furthermore, several mobile applications of intelligent transportation systems (ITS), which include bus apps [4], public bicycle systems [5], mass rapid transit systems [6], and railway apps [7], have been developed and implemented to provide convenient transport services for residents. These applications can provide dynamic vehicle information, arrival time information, railway guides, and route planning via mobile device. These mobile apps can also provide residents with an active alarm and notification, such as an arrival alarm.
Similarly, governments might want residents to have the convenience of being able to access information about garbage removal, such as the location of collection points, the location of garbage trucks, and waiting times for garbage trucks on a particular day or route. Therefore, this study proposes that a garbage truck app should be designed to provide mobile users with the immediate location of garbage trucks, the location of collection points, and the forecasted arrival times of garbage trucks. When designing and implementing of a garbage truck app (GTA), providing the immediate location of garbage trucks and their forecasted arrival time is an important aspect. Several studies used data-mining techniques (e.g., linear regression [8], k-nearest neighbour [9], support vector machine [10], artificial neural network [11]) to analyse the historical traffic information in order to forecast arrival times. A periodic message updating mechanism is then designed and implemented for the mobile app, which can request and update messages every cycle time [12-14]. However, the computation costs of this mechanism may be wasted when no messages need to be updated. In addition, the power consumption of mobile apps is often a concern to mobile users; therefore, an optimised power-saving mechanism for updating messages, which is based on location information, is required to analyse the location of garbage trucks and forecast their arrival time, and in turn reduce computation costs.
This study proposes a garbage truck fleet management system (GTFMS) that includes on-board units (OBUs) on garbage trucks, a fleet management system (FMS), and a GTA with an optimised power-saving mechanism for updating messages, based on location information. The OBUs are equipped with a global positioning system (GPS) module and cellular network modules to provide immediate arrival detection data and send the location of the garbage trucks to the FMS via a General Packet Radio Service (GPRS), Universal Mobile Telecommunications System (UMTS), or Long Term Evolution (LTE). The FMS can combine an arrival time forecasting method based on data-mining techniques and analyse the location of a garbage truck to provide a forecasted arrival time. Residents can then use the GTA via a mobile device to request the location of a garbage truck and its forecasted arrival time before they take out their garbage. Moreover, the GTA can save power by updating messages with location information and the forecasted arrival time.
The remainder of the paper is as follows. Section 2 presents and discusses the various techniques of message updating, traffic information forecasting, and cloud computing. Section 3 presents the design of the GTFMS, and Section 4 proposes an optimised power-saving mechanism for updating messages. The implementation and evaluation of the GTFMS are presented in Section 5. Conclusions are given in Section 6.
2 LITERATURE REVIEW
The research on relevant technology required for this study is categorised into the following elements: (1) a message updating mechanism; (2) an arrival time forecasting method; and (3) cloud computing.
2.1 Message updating mechanism
Some studies have proposed the analysis of optimal cycle times for a message updating mechanism, take the frequency of event arrivals into account [12-14]. For instance, Chen et al. [13] proposed a power-saving positioning algorithm to update the location information of mobile devices for a campus guidance system, which considered a mobile position method to save power. Although the computation cost of this method is lower than using GPS, the received signal strength indicator may be sent to a server every second in order to update the location [13]. Cheng et al. [14] extended the positioning algorithm and determined the optimal cycle time using communication behaviour (i.e., call arrival time and call holding time) to reduce computation costs. For another case, Lin et al. [12] analysed the optimal cycle time with lower computation costs for crawling news events using communication behaviour (i.e., event inter-arrival time). However, the computation procedures of these methods may still be performed with a fixed-cycle time when no messages need to be updated. Therefore, a data-driven [15] mechanism for updating messages using location information is more suitable for mobile applications of ITS.
2.2 Arrival time forecasting method
To forecast arrival times, several studies used data mining techniques (e.g., linear regression [8], k-nearest neighbour [9], artificial neural network [11]) to analyse historical traffic information and obtain the forecasted arrival time. Liu et al. [9] used the k-nearest neighbour method to analyse the previous arrival time, dwell time, and delay time in order to predict bus arrival times. Although the results showed that the mean relative errors of using the k-nearest neighbour method are lower than using the artificial neural network [9,11], the power consumption and time complexity of the k-nearest neighbour method are higher with big data in runtime. Furthermore, the values of weighting in the artificial neural network cannot be explained. Chen et al. [8] proposed a linear regression method that has 97.91 per cent accuracy for traffic information prediction. Therefore, this study proposed a weighted multiple linear regression method based on explainable linear regression to forecast arrival time for the GTA.
2.3 Cloud computing
For cloud computing and parallel computing, Hadoop has been a popular platform in recent years. Hadoop can combine MapReduce, HBase, Hive, and Pig to store and process big data. Furthermore, MapReduce can handle the data distribution, parallelisation, fault tolerance, and load balancing needed to support the divide-and-conquer technique. With this abstraction model, users do not tackle the complexity of distributed systems and can focus on the business intelligence design [16].
First, the programmer has to define the 'Map' functions and 'Reduce' functions, which are both defined with key/value pairs. The Map function takes an input pair and produces a set of intermediate key/value pairs. The Map function is then applied in cloud computing to every item in the input datasets. After that, the MapReduce framework collects all pairs with the same intermediate key from all lists and groups them together, thus creating one group for each of the different intermediate keys. The Reduce function is then applied in cloud computing to each group; it returns all the responses, which are collected as the desired result list. Among the various benefits of using MapReduce over conventional data processing techniques, these are the most important factors [16]:
1. For programmers, MapReduce is easy to use without having prior experience with distributed systems.
2. It enables the scaling of applications across large clusters of cheap computers to solve a problem.
3. It can automatically handle failures to support fault tolerance.
For instance, a 'Map' function (shown in Figure 1) and a 'Reduce' function (shown in Figure 2) are designed to analyse the number of occurrences of each word in a large corpus. In the 'Map' function, the corpus ID is defined as a key, and the contents of this corpus are defined as a value. In addition, this 'Map' function can parse these contents to get each word in this corpus and to generate key/value pairs for the 'Reduce' function. In this case, a word can be defined as a key, and the value of this key can be defined as 1 when the word occurs once. The 'Reduce' function can then summarise the values of each key. Finally, the the number of occurrences of each word in the corpus can be calculated rapidly in a distributed system [17].


In this study, a large collection of vehicle records needed to be analysed in order to provide the forecasted arrival time to mobile users rapidly. Therefore, a distributed system based on cloud computing techniques was required. The tools called Hadoop, MapReduce, and Hive were used to analyse historical traffic information and the immediate location of a garbage truck in order to forecast its arrival time.
3 DESIGN OF THE GARBAGE TRUCK FLEET MANAGEMENT SYSTEM
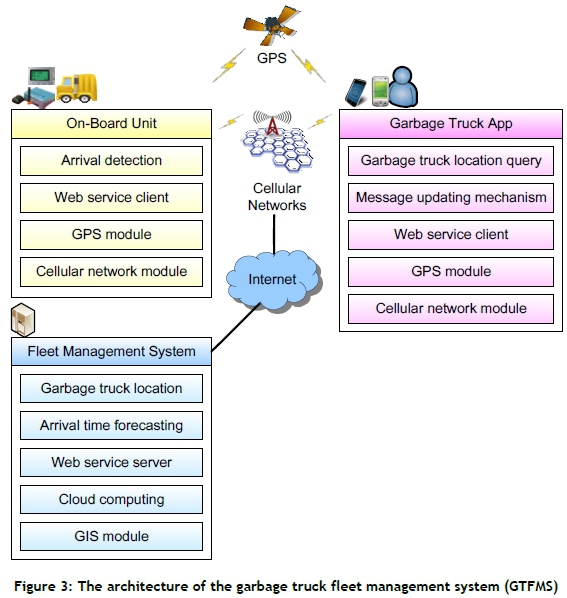
The GTFMS is a three-component system that includes the OBUs on garbage trucks, an FMS, and a GTA (shown in Figure 3). These components are presented in the sections that follow.
3.1 On-board units (OBUs) on garbage trucks
The OBUs on garbage trucks include arrival detection, a web service client, a GPS module, and a cellular network module. The location of garbage trucks can be determined by the GPS module and be sent periodically to the FMS via cellular networks (e.g., GPRS, UMTS, or LTE). The OBU can analyse and compare the location of the garbage trucks with the locations of collection points in the local database, in order to detect the garbage truck's arrival time. When an OBU arrives at each collection point, it sends the arrival message and arrival time to the FMS via a web service client for fleet management.
3.2 Fleet management system
The FMS includes garbage truck location information, an arrival time forecasting method, a web service server, a cloud computing technique, and a GIS module. The FMS can record the immediate location of each garbage truck and the arrival time of the garbage truck at each collection point. The arrival time forecasting method can analyse the historical data of travel time between each pair of collection points to generate weighted multiple linear regression models. For big data processing, the associative laws of addition and multiplication in the weighted multiple linear regression model are considered to be implemented as MapReduce models in the Hadoop platform. The current travel time can then be adopted in those weighted multiple linear regression models to obtain the forecasted arrival time via the GTA.
3.3 3.3 Garbage truck app
The GTA includes a garbage truck location query, a message updating mechanism, a web service client, a GPS module, and a cellular network module. Residents can use the GTA and input an address to query the locations of collection points and garbage trucks via a web service client. Residents can also input their geolocation from the GPS module to query the locations of collection points and garbage trucks. Furthermore, the GTA can support the module of a 'my favourite' list to record and list the locations of collection points and route IDs in common use. The message updating mechanism can be triggered to update the current arrival time for a resident's decision support.
4 OPTIMISED POWER-SAVING MECHANISM FOR UPDATING MESSAGES
The proposed optimised power-saving mechanism for updating messages, which is based on location information, includes six steps:
1. Query the locations of collection points;
2. Add the collection points and route ID to a 'my favourite' list;
3. Get the mean arrival time of the garbage truck to the collection point using historical data;
4. Get the forecasted arrival time x minutes before the mean arrival time of the garbage truck at the collection point;
5. Compute the travel time of the garbage truck before it arrives at the collection point; and
6. Generate an alarm and notification when the garbage truck arrives (shown in Figure 4).
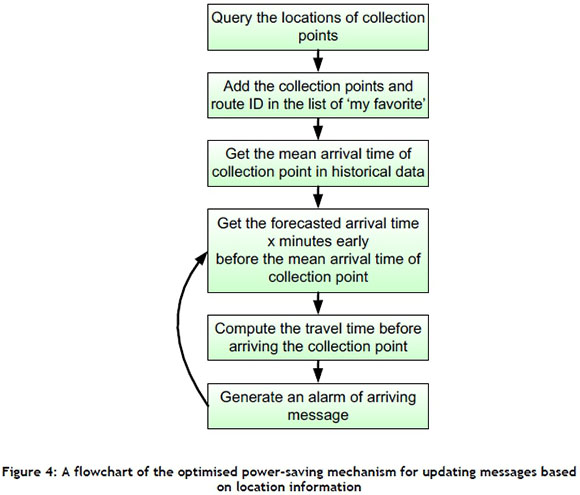
Residents can use the GTA to select their favourite collection point and add it to their 'my favourite' list. When the collection point is considered, the GTA will get the mean arrival time of that point using historical data via the web service client. The GTA can then automatically get the forecasted arrival time t minutes before the mean arrival time of the garbage truck at the collection point. The travel time of the garbage truck before it arrives at the collection point is periodically estimated by using an interpolation method. An alarm is generated when the garbage truck arrives at the collection point.
The details of the arrival time forecasting method and the optimised power-saving mechanism for updating messages are presented next.
4.1 Arrival time forecasting method
An arrival time forecasting method based on weighted multiple linear regression models considers the travel time between the locations of collection points and the target collection point, in order to predict the arrival time of the garbage truck at the target collection point. Two stages, pre-deployment and runtime, are in the proposed arrival time forecasting method.
4.1.1 Pre-deployment stage
In the pre-deployment stage, the parameters in weighted multiple linear regression models are trained using historical data. The set of travel times between the locations of the last k collection points in front of the last n-th collection point (i.e., the (i-n)-th collection point) is considered when the i-th collection point is the target collection point. There are m records in the historicaldata and k weighted multiple linear regression models  and the travel time from the (i-n-j)-th collection point to the (i-n)-th collection point on the r -th route is defined as
  (shown in Equation 1). The forecasted travel time from the (i-n)-th collection point to the i-th collection point is
  (shown in Equation 2). Each parameter and model can be trained and stored in the FMS in the pre-deployment stage. The notation used in this paper is summarised in Table 1.

where

and

where

4.1.2Runtime stage
In the runtime stage, the forecasted travel time from the (i-n)-th collection point to the i-th collection point can be estimated as  according to the set of travel times
 between the locations of the last k collection points in front of the last n-th collection point (shown in Equation 2).
4.1.3A case study
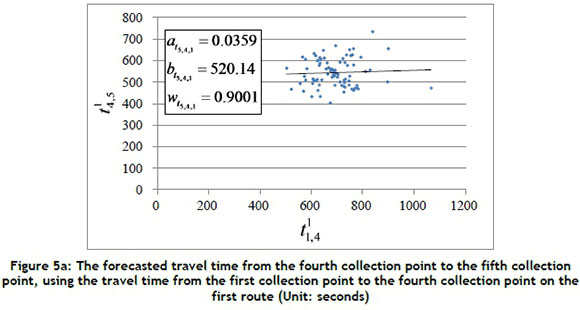
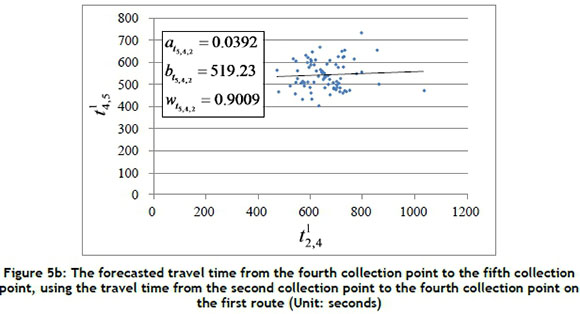
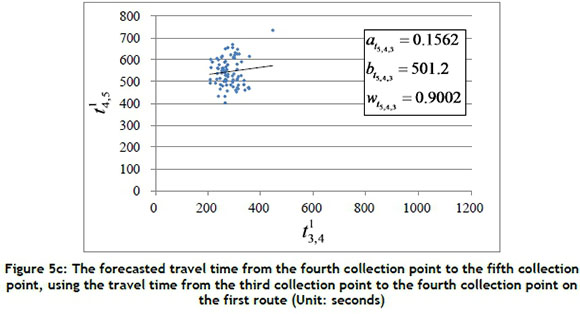
In this subsection, a case study of arrival time estimation for a specific collection point is given to explain Equations 1 and 2. Figure 5 shows the forecasted travel time  from the fourth collection point to the fifth collection point, using the set of travel times
  between the locations of the three collection points before the last collection point on the first route (i.e., i = 5; n = 1; k = 3; γ= 1). In this case, the travel time of each road segment between collection points from the 1st of April to the 31st of October 2014 was collected to calculate the values of
  , and
, and  using Equation 1. For instance, the travel time
  (i.e., r = 1) from the first collection point to the fourth collection point on the first route was 564 seconds on the 1st of April 2014, and the travel time
  from the fourth collection point to the fifth collection point on the first route was 618 seconds on the same run. The travel time can then be presented as a blue dot in Figure 5a; there are 82 blue dots (i.e., m = 82) in this case. The values of
  , and
, and  can be calculated using Equation 1 as 0.0359, 520.14, and 0.9001 respectively. Each linear regression model
  can be generated and adopted to forecast the travel time in the runtime stage. When the set of travel times
 was collected as
  on the 1st of November 2014, the travel time
  was forecasted using Equation 2 as 544.587 seconds.
4.2 Optimised power-saving mechanism of message updating
For an optimised power-saving mechanism when updating messages, residents can use the GTA to select their favourite collection points and set the alarm time period x before the garbage truck arrives at the collection point. The message updating procedure will then be triggered x minutes before the mean arrival time of the garbage truck at the collection point. After performing the message updating procedure and getting the forecasted arrival time of the resident's favourite collection point, the dynamic location of the garbage truck and the travel time to arrive at the collection point can be periodically estimated by using an interpolation method.
4.2.1 The analysis of availability rate
For the analysis of the availability rate, this study assumes that the distribution of arrival time of the ;i-th collection point on the g -th route is a normal distribution  with arrival time
  , mean arrival time
  , and standard deviation
  . In addition, the function g(z) is aGauss error function that can be expressed as
  by Taylor series [18]. The availability rate can be estimated as
  , with an alarm time period
  (shown in Equation 3).
4.2.2 A case study
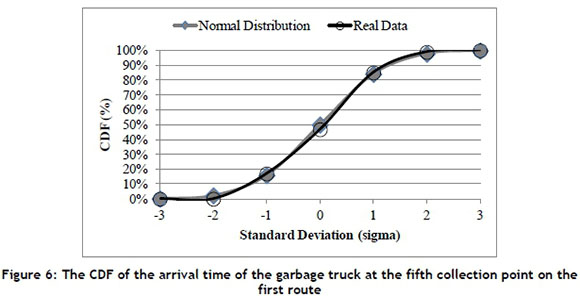
A case study of the arrival time of garbage trucks at collection points in Hsinchu in Taiwan was selected to analyse the distribution. In this case, the arrival time of the garbage trucks at each collection point from the 1st of April to the 31st of October 2014 was collected to calculate the mean value and standard deviation value. For example, the arrival time of the garbage truck at the fifth collection point on the first route was at 13:20:41 on the 1st of April 2014. The arrival time value can then presented as 48,041 seconds, which is the time interval from 00:00:00 (i.e., 0 seconds) to 13:20:41 (i.e., 48,041 seconds). Figure 6 shows that the mean value and the standard deviation value of the fifth collection point on the first route from the 1st of April to the 31st of October 2014 was 48,016.915 seconds (i.e., μ ) and 203.330 seconds (i.e., Gi) respectively. The cumulative distribution function (CDF) of normal distribution is illustrated as a gray line in Figure 6, using the mean value and standard deviation value. The chi-square test [1] was used to test the assumption in this study. The test results showed that χ1 = 0.0272 <χ62005= 12.592 when α = 0.05, and no significant difference was observed.
4.3 Cloud computing techniques for the arrival time forecasting method
In this study, the m records of the travel time  between the locations of the last k collection points before the last n-th collection point, and the travel time from the (i-n)-th collection point to the i-th collection point are collected and analysed using cloud computing techniques for efficient data processing. The distributed platform Hadoop is deployed, and k weighted multiple linear regression models
  are implemented in the platform to estimate the travel time of the garbage truck from the (i-n)-th collection point to the i-th collection point, using the travel time from the (i-n-j)-th collection point to the (i-n)-th collection point.
For MapReduce programming models, the 'Map' function and the 'Reduce' function are designed and implemented for each model. In addition, the data structure is presented as key/value pairs in these models for distributed computing. In this study, a regression model ID is defined as a key, and the value of this key is defined as  and
and  i(shown in Figure 7). For instance, the travel time
  from the (i-n-1)-th collection point to the (i-n)-th collection point and the travel time
  from the (i-n)-th collection point to the i-th collection point on the y -th route were collected in the first record of the historical data. These travel times were then presented in the format of a key/value pair as
  for the Map function. The parameters
  and
and  of the linear regression model
  can be calculated using Equation 1. The multiple linear regression models
  can then be generated using the Map function. Next, the Reduce function can use Equation 2 and the parameters of each linear regression model to forecast the travel time and arrival time. In this study, the Map and Reduce functions are designed and implemented in a Hadoop platform for distributed computing.
5 IMPLEMENTATION AND EVALUATION
The implementation and evaluation of the GTFMS are presented in the following sections.
5.1 Implementation and case study
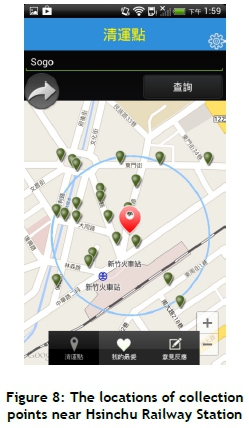
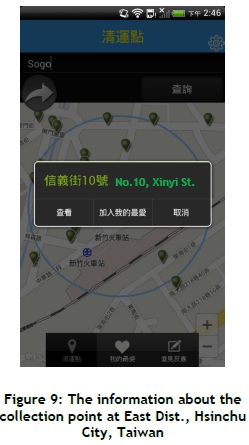
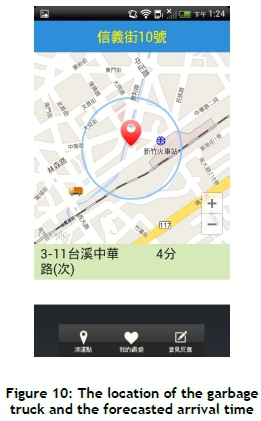
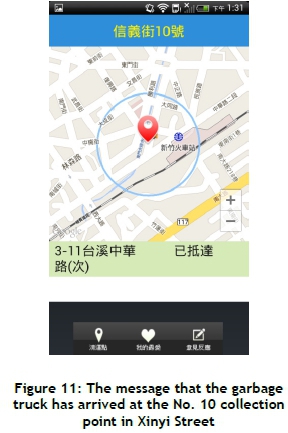
A case study of the GTFMS in Hsinchu City is presented in this section. The GTA was installed and executed in an MS device (e.g., HTC Hero running Android platform 2.1) to present the location information and forecasted arrival time for residents (shown in Figures 8 to 11). Figure 8 shows that the text 'Sogo' is typed to query the locations of collection points near the Sogo department store in Hsinchu City. This study selected and added the collection point No. 10, in Xinyi Street to the 'my favourite' list (shown in Figure 9). The forecasted arrival time is then automatically updated, and the remaining travel timed is updated dynamically using an interpolation method (shown in Figure 10). Figure 11 shows that the garbage truck has arrived at the No. 10 collection point in Xinyi Street.
5.2 Evaluation
For check the accuracy of the proposed arrival time forecasting method, this study analysed the historical data of garbage truck traces in Hsinchu City from the 1st of April to the 31st of October 2014. There were 2,916 collection points and 106 routes. The value of n is 1 in this case, and the value of k is 3. The historical data was segmented into seven datasets for each month. Furthermore, the mean absolute percentage error (MAPE) was considered to define the accuracy of the forecasted travel time as  . The k-fold cross-validation method [3] was adopted to evaluate the average accuracy of the forecasted travel time for each road segment between collection points. For instance, the historical data during April was adopted as a testing dataset, and the remaining data (i.e., the historical data from May to October) was used as a training dataset in the first round. Seven rounds were then performed to evaluate and calculate the average accuracy of the forecasted travel time.
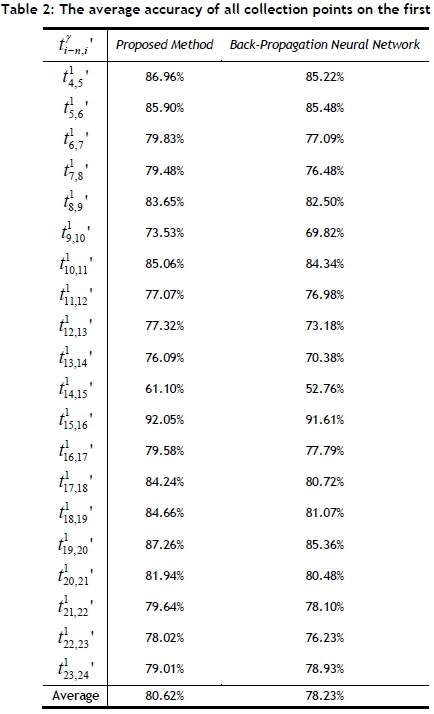
In experiments, this study compared the proposed method with the Back-Propagation Neural Network (BPNN) [19] for travel time prediction. Table 2 shows the average accuracy of all collection points on the first route; the average accuracy of the proposed method is 80.62 per cent, which is higher than the average accuracy of BPNN. The average accuracy for all routes in Hsinchu City was also considered and evaluated in Table 3. The experimental results showed that the average accuracy of the proposed method is 81.45 per cent, which is also higher than the average accuracy of BPNN. Therefore, the proposed method can obtain a precise forecasted travel time and arrival time for mobile users.

For the optimised power-saving mechanism for updating messages, the collection point at No.10 in Xinyi Street was selected as a case study, and the alarm time period x was said to be seven minutes. The results showed that the mean absolute error of forecasted arrival time by the proposed method is 28 seconds. In addition, the values of mean arrival time  , and standard deviation
  are 48941 (i.e., p.m. 13:35:41) and 224.664 respectively. Therefore, the availability rate is 93.84 per cent.
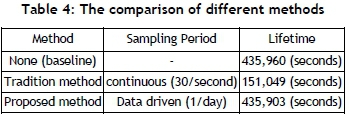
For energy measurements, this study measured the power consumption of the traditional method and the proposed method on Android phones (e.g., HTC Hero running Android platform 2.1), using battery life as an indicator. The results of the experiments are summarised in Table 4. Suppose the battery has a capacity of c Joules. The baseline lifetime, without any location estimates, is 435,960 seconds. Therefore the baseline power consumption hb= c/435960 Watts. For the analysis of the power consumption of the traditional method ht, the lifetime with the traditional method is 151,049 seconds, so ht+ hb= c/151049. When solving this equation, this study gets ht= c/231129. On doing a similar analysis for the power consumption of the proposed method in this study, hp, this study gets the result hp= c/665652809. The cost per sample of the traditional method is 2,880 times the cost per sample of the proposed method. Therefore the proposed method is a power-saving mechanism for updating messages.
6 CONCLUSIONS AND FUTURE WORK
This study designed and developed a GTFMS with an optimised power-saving mechanism for updating messages based on location information. In addition, an arrival time forecasting method was designed and implemented in the FMS, where the GTA can retrieve the forecasted arrival time and the message updating event is triggered, using the location of the garbage truck and its forecasted arrival time. During experiments, the practical records of garbage truck traces in Hsinchu City from the 1st of April to the 31st of October were collected and analysed. The results showed that the mean accuracy of the predicted arrival time by the proposed method is 81.45 per cent. As to power consumption, the cost of traditional mobile apps is 2,880 times that of the proposed mechanism. Consequently, the GTFMS can provide a precise forecasted arrival time to mobile users, while saving power consumption.
For future research, the optimised travel time prediction of each road segment could be analysed and investigated. For instance, the traffic condition of some road segments may be affected by weather, weekday traffic, and human activities. Thus more parameters should be considered, quantified, and adopted in the proposed model, in order to improve travel time prediction. Furthermore, the proposed method and system can be applied to other ITS applications such as commercial vehicle operation services, advanced traveler information systems, and advanced traffic management systems.
REFERENCES
[1] Chen, C.H., Lo, C.C. & Lin, H.F. 2013. The analysis of speed-reporting rates from a cellular network based on a fingerprint-positioning algorithm. South African Journal of Industrial Engineering, 24(1), pp. 98-106. [ Links ]
[2] Erman, B., Inan, A., Nagarajan, R. & Uzunalioglu, H. 2011. Mobile applications discovery: A subscriber- centric approach. Bell Labs Technical Journal, 15(4), pp. 135-148. [ Links ]
[3] Lo, C.C., Kuo, T.H., Kung, H.Y., Kao, H.T., Chen, C.H., Wu, C.I. & Cheng, D.Y. 2011. Mobile merchandise evaluation service using novel information retrieval and image recognition technology. Computer Communications, 34(2), pp. 120-128. [ Links ]
[4] Chen, Y.C., Lin, T.W. & Chang, C.S. 2010. Satisfaction survey of dynamic bus information system in Tainan City. Proceedings of the 17th Intelligent Transportation System World Congress, Busan, Korea. [ Links ]
[5] Jiang, Y., Kang, L., Jin, L. & Wang, S. 2010. Optimal design and management of public bicycle system for college campus: A case study in China. Proceedings of 2010 IEEE International Conference on Information Management, Innovation Management and Industrial Engineering, Kunming, China. [ Links ]
[6] Liu, H.H., Chen, Y.J., Chang, Y.J. & Chen, W.H. 2009. Mobile guiding and tracking services in public transit system for people with mental illness. Proceedings of 2009 IEEE Region 10 Conference, Singapore. [ Links ],
[7] Zhou, C., Weng, Z., Xu, C. & Su, Z. 2013. Integrated traffic information service system for public travel based on smart phones applications: A case in China. International Journal of Intelligent Systems and Applications, 5(12), pp. 72-80. [ Links ]
[8] Chen, W.J., Chen, C.H., Lin, B.Y. & Lo, C.C. 2012. A traffic information prediction system based on global position system-equipped probe car reporting. Advanced Science Letters, 16(1), pp. 117-124. [ Links ]
[9] Liu, T., Ma, J., Guan, W., Song, Y. & Niu, H. 2012. Bus arrival time prediction based on the k-nearest neighbor method. Proceedings of 2012 Fifth IEEE International Joint Conference on Computational Sciences and Optimization, Harbin, China. [ Links ]
[10] Yu, B., Wu, S., Yao, B., Yang, Z. & Sun, J. 2012. Dynamic vehicle dispatching at a transfer station in public transportation system. Journal of Transportation Engineering, 138(2), pp. 191-201. [ Links ]
[11] Chien, S.I.J., Ding, Y.Q. & Wei, C.H. 2002. Dynamic bus arrival time prediction with artificial neural networks. Journal of Transportation Engineering, 128(5), pp. 429-438. [ Links ]
[12] Lin, B.Y., Chen, C.H., Chang, H.C. & Lo, C.C. 2011. A network behavior analysis system for cloud computing service. Information: An International Interdisciplinary Journal, 14(3), pp. 931-938. [ Links ]
[13] Chen, C.H., Lin, B.Y., Lin, C.H., Liu, Y.S. & Lo, C.C. 2012. A green positioning algorithm for campus guidance system. International Journal of Mobile Communications, 10(2), pp. 119-131. [ Links ]
[14] Cheng, D.Y., Chen, C.H., Hsiang, C.H., Lo, C.C., Lin, H.F. & Lin, B.Y. 2013. The optimal sampling period of a fingerprint positioning algorithm for vehicle speed estimation. Mathematical Problems in Engineering. [ Links ]
[15] Zhang, J., Wang, F.Y., Wang, K., Lin, W.H., Xu, X. & Chen, C. 2011. Data-driven intelligent transportation systems: A survey, IEEE Transactions on Intelligent Transportation Systems, 12(4), pp. 1624-1639. [ Links ]
[16] Dean, J. & Ghemawat, S. 2008. MapReduce: Simplified data processing on large clusters. Communications of the ACM, 51(1), pp. 107-113. [ Links ]
[17] Dean, J. & Ghemawat, S. 2010. MapReduce: A flexible data processing tool. Communications of the ACM, 53(1), pp. 72-77. [ Links ]
[18] Wikipedia. 2014. Error function. Retrieved from http://en.wikipedia.org/wiki/Error_function. July 4, 2014 [ Links ]
[19] Karlaftis, M.G. & Vlahogianni, E.I. 2011. Statistical methods versus neural networks in transportation research: Differences, similarities and some insights. Transportation Research Part C: Emerging Technologies, 19(3), pp. 387-399. [ Links ]
Submitted by authors 4 Jul 2014
Accepted for publication 5 Nov 2015
Available online 10 /May 2016
* Corresponding author chihua0826@gmail.com


