


Servicios Personalizados
Articulo
 Inglés (pdf)
 Articulo en XML
 Referencias del artículo
Indicadores

Links relacionados
-
 Citado por Google
 -
 Similares en Google
Compartir

 Permalink
South African Journal of Industrial Engineering
versión On-line ISSN 2224-7890
versión impresa ISSN 1012-277X
S. Afr. J. Ind. Eng. vol.27 no.1 Pretoria may. 2016
http://dx.doi.org/10.7166/27-1-978
GENERAL ARTICLES
Exact run length distribution of the double sampling ![]() chart with estimated process parameters
chart with estimated process parameters
W. L. TeohI; M. S. FunI; S. Y. TehII, *; Michael B. C. KhooIII; W. C. YeongIII
IDepartment of Physical and Mathematical Science, Faculty of Science, Universiti Tunku Abdul Rahman, Kampar, Perak, Malaysia
IISchool of Management, Universiti Sains Malaysia, 11800 Minden, Penang
IIISchool of Mathematical Sciences, Universiti Sains Malaysia, 11800 Minden, Penang
ABSTRACT
Since the run length distribution is generally highly skewed, a significant concern about focusing too much on the average run length (ARL) criterion is that we may miss some crucial information about a control chart's performance. Thus it is important to investigate the entire run length distribution of a control chart for an in-depth understanding before implementing the chart in process monitoring. In this paper, the percentiles of the run length distribution for the double sampling (DS) ![]() chart with estimated process parameters are computed. Knowledge of the percentiles of the run length distribution provides a more comprehensive understanding of the expected behaviour of the run length. This additional information includes the early false alarm, the skewness of the run length distribution, and the median run length (MRL). A comparison of the run length distribution between the optimal ARL-based and MRL-based DS
chart with estimated process parameters are computed. Knowledge of the percentiles of the run length distribution provides a more comprehensive understanding of the expected behaviour of the run length. This additional information includes the early false alarm, the skewness of the run length distribution, and the median run length (MRL). A comparison of the run length distribution between the optimal ARL-based and MRL-based DS ![]() chart with estimated process parameters is presented in this paper. Examples of applications are given to aid practitioners to select the best design scheme of the DS
chart with estimated process parameters is presented in this paper. Examples of applications are given to aid practitioners to select the best design scheme of the DS ![]() chart with estimated process parameters, based on their specific purpose.
chart with estimated process parameters, based on their specific purpose.
OPSOMMING
Aangesien die lopielengte verdeling in die algemeen baie skeef is, bestaan daar kommer oor die gebruik van die gemiddelde lopielengte (ARL) kriteria, omdat kritiese informasie op die beheerkaart gemis mag word. Dit is dus belangrik om die totale lopielengte verdeling van 'n beheerkaart te ondersoek, voordat die kaart geïmplementeer word. In hierdie artikel word die persentiele van die lopielengte verdeling van die dubbelmonster (DS) ![]() kaart met geskatte prosesparameters bereken. Kennis van die persentiele van die lopielengte verdeling gee 'n meer omvattende verstaan van die verwagte lopielengte vertoning. Dié addisionele informasie sluit die vroeë vals alarm, die skeefheid van die verdeling en die mediaan van die lopielengte (MRL) in. 'n Vergelyking van die lopielengte verdeling tussen optimale ARL-gebaseerde en MRL-gebaseerde DS
kaart met geskatte prosesparameters bereken. Kennis van die persentiele van die lopielengte verdeling gee 'n meer omvattende verstaan van die verwagte lopielengte vertoning. Dié addisionele informasie sluit die vroeë vals alarm, die skeefheid van die verdeling en die mediaan van die lopielengte (MRL) in. 'n Vergelyking van die lopielengte verdeling tussen optimale ARL-gebaseerde en MRL-gebaseerde DS ![]() kaart met geskatte proses parameters word voorgehou. Voorbeelde word ook voorgehou om beoefenaars te help om die beste weergawe van die DS
kaart met geskatte proses parameters word voorgehou. Voorbeelde word ook voorgehou om beoefenaars te help om die beste weergawe van die DS ![]() kaart met geskatte proses parameters vir hul toepassing te kies.
kaart met geskatte proses parameters vir hul toepassing te kies.
1 INTRODUCTION
Control charts are used to ascertain whether a business or manufacturing process is in a state of statistical control. Unequivocally, the existing literature focuses too much on the use of the average run length (ARL) criterion as a performance measure of a control chart with estimated process parameters. Because of the highly-skewed property of the run length distribution, many researchers (e.g., [1], [2], [3]) criticise the use of the ARL as the sole criterion for measuring a chart's performance. Thaga [4] stated that only a fraction of a chart's behaviour is reflected in the size of the ARL. Accordingly, Chakraborti [2], Khoo and Quah [5] and Radson and Boyd [6] advocated using a more credible measure - the percentiles of the run length distribution - as an alternative way of assessing a chart's performance. The percentiles explain the run length properties and provide detailed and important information about the run length distribution, and thus about the chart's performance. Gan [7] claimed that knowing the run length properties, such as the early false out-of-control signal and the median run length (MRL) of a control chart, enables engineers to have a full understanding of the working of a control chart. Thus their confidence will not be eroded when they encounter a few short run lengths with undiscovered assignable causes. Undeniably, it is crucial for us to examine the run length distribution of a control chart before it is implemented in process monitoring.
In this paper, we consider the Daudin's [8] double sampling (DS)  chart, which is a modified Shewhart
  chart incorporating the double sampling plans. Daudin [8] proposed an optimisation model to minimise the in-control average sample size (ASS0); while Irianto and Shinozaki [9] developed their research to suggest the minimisation of the out-of-control ARL (ARL1). The advantage of the DS
  chart is improved statistical efficiency without increasing the sample size [10]. Additionally, He and Grigoryan [11] pointed out that the DS chart is a good option when greater efficiency is required for small shifts, and when protection against large shifts is also vital. According to Daudin [8] and Costa [12], the DS
  chart is superior to the Shewhart
  , variable sample size (VSS)
  , variable sampling interval (VSI)
  , exponentially weighted moving average (EWMA), and cumulative sum (CUSUM) charts in some cases. For example, the DS
  chart is preferred to the Shewhart
  chart for identifying small and moderate process mean shifts. The former also dramatically reduces the in-control sample size to nearly 50 per cent of the latter [8]. When detecting small and moderate process mean shifts, Costa [12] stated that the sample size of the DS
  chart is more economical than that of the VSS
  chart. These advantages lead to the conclusion that the DS scheme is an appropriate choice for process monitoring with higher inspection costs or destructive testing [13].
Given the motivations for and merits of using the DS chart, a number of researchers have studied the DS charts extensively in recent years. Costa and Claro [14] applied the DS X chart to monitor a process in which the measurements can be modeled as a first-order autoregressive moving average. Torng and Lee [15] studied the DS  chart when the observations follow non-normal distributions. The combined DS and VSI (DSVSI)
  chart was proposed by Carot et al. [16], who claimed that the DSVSI X chart is more sensitive to small and moderate process mean shifts. Inspired by Carot et al. [16], Torng et al. [17] furthered this research and discussed the DSVSI
  chart under non-normality. Then Lee et al. [18] proposed the economic design of the DSVSI
  chart. Recently, Khoo et al. [19] introduced a synthetic DS
  chart, which performs better than the standard DS X and synthetic
  charts, for all levels of shifts.
In real applications, a control chart is applied in a two-phase operation. Control charts are used to determine an in-control historical data set in the Phase-I analysis; while in the Phase-II monitoring, control charts are used to detect an out-of-control signal after an unknown time point. In practice, the process parameters are rarely known, and they are usually estimated from the Phase-I dataset. Therefore, in this paper, we focus on the DS  chart when the process parameters are estimated.
A number of researchers ([20], [21], [22]) have contributed to the field of control charts with estimated process parameters. A thorough literature review on the effect of parameter estimation on control charts' properties was done by Jensen et al. [23]. The DS  chart with estimated process parameters, optimally designed based on the ARL, was first developed by Khoo et al. [24]. Teoh et al. [3] took the study of Khoo et al. [24] further and developed an optimisation model to minimise the out-of-control MRL (MRL1). They concluded that the proposed optimal MRL-based DS
  chart with estimated process parameters has a lower false alarm rate and provides a more straightforward interpretation.
In this paper, we investigate the percentiles (5th, 10th, 25th, 50th, 75th and 95th percentiles) of the DS  chart with estimated process parameters, which is a thorough and exact analysis of the entire run length distribution. These percentiles of the run length distribution are computed for a given desired in-control ARL (ARL0) or MRL (MRL0) value. This analysis is currently not yet available for the DS
  chart with estimated process parameters. Since process parameters are usually estimated from a historical dataset, our results provide added insight into the DS
  chart's performance. This will arouse interest among practitioners, as further knowledge regarding the exact behaviour of the DS
  chart with estimated process parameters is now made available. For instance, the 5th and 95th percentiles give beneficial information about the spread or dispersion of the run length distribution.
The remainder of this paper is organised as follows: In Section 2, the operation of the DS  chart is outlined. Section 3 studies the run length properties of the DS
  chart with known and estimated process parameters. The performance based on the percentiles of the run length distribution for the DS
  chart is examined in Section 4. In Section 5, examples of applications to aid engineers in the selection of a suitable design scheme for the DS
  chart with estimated process parameters are presented. Finally, conclusions are drawn in Section 6.
2 THE DS CHART
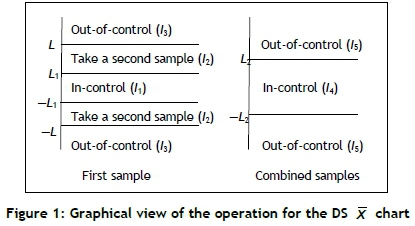
Let Y be the random variable representing observations taken from a Phase-II process, where Y follows a normal distribution with the in-control mean, μ0and standard deviation, σ0. The DS  chart is divided into five intervals, i.e. / = [-L,, L1] , /2= [-L,-L,)u (L,, L], /3=(-∞, -L)u(L, +∞) , /4 =[-L2, L2] and /5= [-∞, -L,)u(L,, +œ]. Note that L1 >0 is the warning limit for the first-sample stage; while L > L1and L2>0 are the control limits for the first-sample and combined-sample stages respectively. With the aid of Figure 1, the operation procedure for the Daudin's [8] DS
  chart is as follows:
(a) After taking a first sample of size n1, calculate the sample mean Y1iat the ;ith sampling time of the first sample.
(b) The process is in-control if 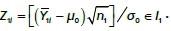
(c) The process is considered as out-of-control if 
(d) If Z1fe /2, take a second sample with size n2(n2> n1). Then, at the ;ith sampling time of the second sample, calculate the second sample mean 
(e) At the ;th sampling time, compute the combined-sample mean, i.e. 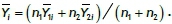
(f) The process is deemed as in-control if 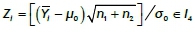 ; otherwise, it is out-of- control.
Let RL be the run length of a control chart. Then, the (100y)th (0 < y <1) percentile of the run length distribution, is obtained as

For the DS X chart with known process parameters, the cumulative distribution function (cdf) is

where  {1, 2, 3, ...} and Pa = Pa1 + Pa2is the probability that the process is in-control. Daudin [8] showed that for a given magnitude of standardised mean shift, δ = |μ1 - μ0|/σ0,with the out-of-control mean μ1, the probabilities Pa1 and Po2 are

and

Here, Φ(.) and Φ (.) represent the cdf and probability density function (pdf) of the standard normal random variable,

The ARL, standard deviation of the run length (SDRL), and average sample size (ASS) at each sampling time are defined as ([8]):
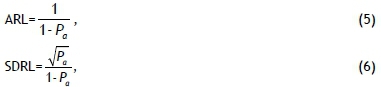
and

respectively, where

When the process parameters are unknown, we need to take m samples, each of size n, from an in-control Phase-I process in order to estimate the mean û0 and standard deviation σ0before starting the Phase-II process monitoring. For the DS  chart with estimated process parameters, the cdf of the RL is expressed as ([3]):

where  {1, 2, 3, ...} and the conditional probability
  Here,
Here,
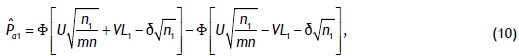
and

where
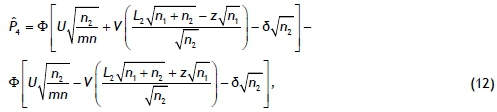
and
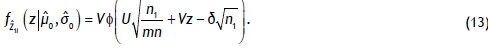
Note that the random variables U and V in Equations (10), (12) and (13) are defined as  and
and 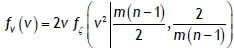 -, respectively. The pdfs of U and V, i.e fU(u) and fV(v), in Equation (9) are equal to
  and
and  , respectively, where fi(-) is the pdf of the gamma distribution.
Teoh et al. [3] also demonstrated that the unconditional ARL, SDRL and ASS of the DS X chart with estimated process parameters are equal to
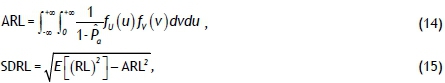
and

where
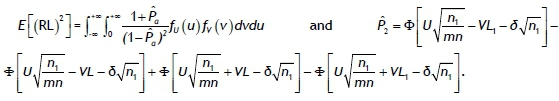
4 PERFORMANCES BASED ON PERCENTILES OF THE RUN LENGTH DISTRIBUTION
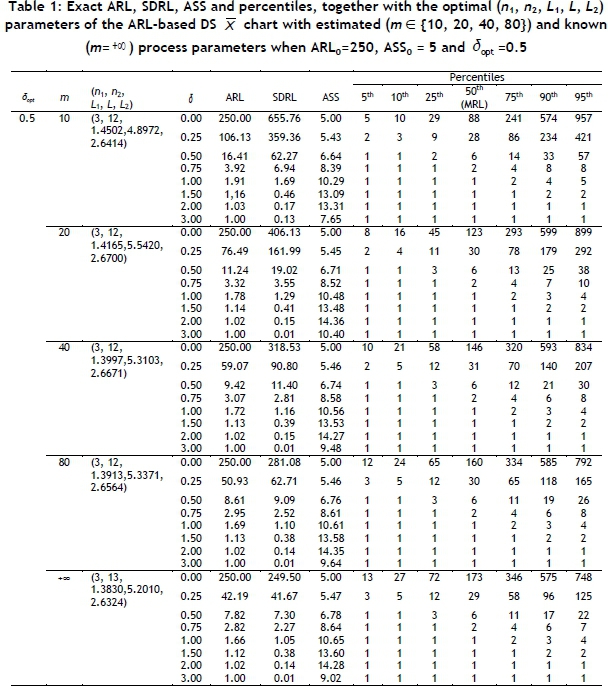
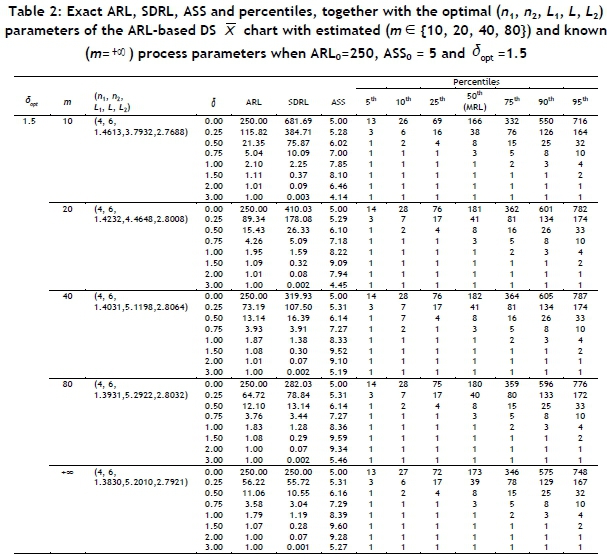
In this section we investigate and compare the percentiles of the run length distribution for both the optimal ARL-based and MRL-based DS  charts with estimated process parameters, proposed by Khoo et al. [24] and Teoh et al. [3] respectively. When ARL0=250, ASS0=5 and dopte {0.5, 1.5}, Tables 1 and 2 provide us with the exact ARL, SDRL, ASS and percentiles for the ARL-based DS X chart. Here, dopt represents the desired mean shift, for which a quick detection is intended. The optimal chart parameters (n1, n2, L1, L, L2) for the estimated-process-parameter case (m e {10, 20, 40, 80}) and known-process-parameter case ( m = +∞ ) are acquired from the optimisation algorithms aiming at minimising the ARL1, which were suggested by Khoo et al. [24] and Irianto and Shinozaki [9] respectively. By using these optimal chart's parameters (n1, n2, L1, L, L2), the ARL, SDRL, ASS and percentiles of the run length distribution, for different shifts δ, are computed based on the formulae shown in Section 3. Note that Equation (1 ) together with Equations (2) and (9) are used to calculate the percentiles for the cases with known and estimated process parameters respectively.
The 25th and 75th percentiles reveal some useful information, because the middle half of the distribution is included between these values. By referring to Table 2, when m=40 and δ=0.5, there is a probability of 0.25 that the run length of the DS  chart is less than 4. Also, 25 per cent of the time, the run length of the chart is greater than 16. The shape or the degree of skewness of the run length distribution is also of great interest to engineers. This skewness can be observed from the difference between the 5th and 95th percentiles or the 25th and 75th percentiles. For example, when δopt, m=10 and δ=0, the 5th percentile is somewhat smaller (i.e., 5) and the 95th percentile is significantly larger (i.e., 957). This indicates that there is more variation in the run length distribution that has a longer right-tail. The difference between these two percentiles -and hence the degree of skewness of the run length distribution - reduces as m, and δincrease.
It is clear from Tables 1 and 2 that the 50th percentiles (MRL0s) are much less than their respective ARL0s when δ=0. When =1.5, the MRL0 values for m 6 {10, +00} are 166 and 173, which are remarkably less than the ARL0=250. This condition worsens when m and δopt are small. For example, when m=10 and δopt =0.5, although the ARL0 value is still 250, the MRL0 value drops to 88.
For all the cases considered in Tables 1 and 2, despite the same ARL0=250 value, the number of samples required to signal a false alarm in 50 per cent of the time is different for all the m considered. This single example shows that interpretations and conclusions based on ARL alone are confusing. Therefore, the percentiles of the run length distribution provide a more representative and reliable quantity for evaluating a control chart's performance. However, when m or δ increases, the ARL1 becomes closer to the MRL1. This shows that the skewness of the run length distribution decreases as m or δincreases.
Undoubtedly, an analysis of the early false alarms is viewed by engineers as vital. A high false alarm rate is undesirable in industry, as it will lead to time- and cost-wasting corrective actions and unnecessary process adjustments. The lower percentiles of the run length distribution, such as the 5th, 10th and 25th percentiles when the process is in-control, i.e. δ=0, provide information about the early false alarms. For example, in the case of =0.5, m=10, there is a 10 per cent chance that a false out-of-control signal will occur by the 10th sample. We notice that when process parameters are estimated, the run length of the 5th, 10th and 25th percentiles when δ=0 are short, indicating very early false alarms with the specified rates of 0.05, 0.1 and 0.25. This situation improves when m or increases, as the values associated with the 5th, 10th and 25th percentiles increase when δ=0. From Tables 1 and 2, we observe that setting the ARL0 at a desired value will not ensure an acceptable early false alarm. Therefore, an analysis of the early false alarms should be conducted in the design of a control chart.
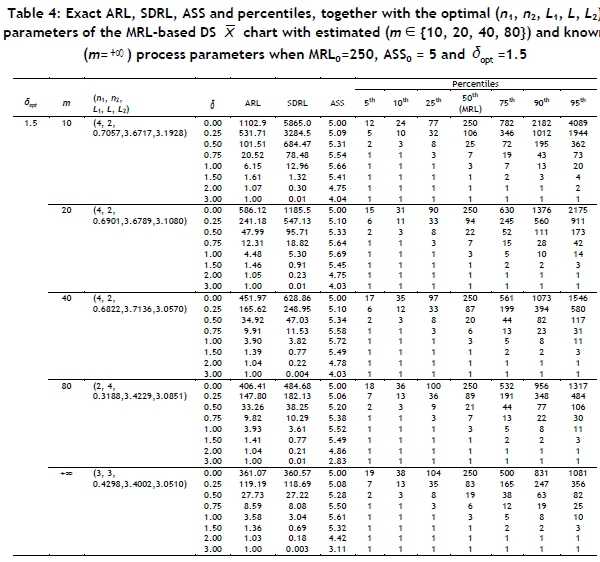
Tables 3 and 4 give an overview of the ARL, SDRL, ASS and percentiles of the MRL-based DS X chart when MRL0=250, ASS0=5 and 6 {0.5, 1.5}. The optimisation algorithms of the DS X chart with known and estimated process parameters for minimising the MRL1, proposed by Teoh et al. [3], are employed here to obtain the optimal (n1, n2, L1, L, L2) combinations. The aRl, SDRL, ASS and percentiles of the run length distribution shown in Tables 3 and 4 are calculated based on the formulae provided in Section 3.
All the cases considered in Tables 3 and 4 have the same MRL0=250, irrespective of the value of m used. This provides useful information to practitioners that, 50 per cent of the time, a false alarm will occur by the 250th sample, following process start-up. We wish to highlight that, for the optimal MRL-based chart with estimated process parameters, with a fixed MRL0=250, for each m, the chart will have the same MRL0 value even though the ARL0 values for each m are different. However, these differences in ARL0 values will not pose any practical problems to practitioners, because MRL represents 50 per cent of the time; but this is not the case for the ARL. For a skewed distribution, such as the run length distribution that follows a geometric distribution, the mean is greater than the median, and so the mean is not a suitable representation of the center of the distribution. Thus the computation of ARL for the optimal MRL-based chart does not provide enough practical information to practitioners. Note that a similar situation is obtained for the ARL-based chart; that is. when ARL0=250 for any m, the MRL0 values are different for each m (see Tables 1 and 2). As discussed above, since ARL is not an intuitive representation of the run length distribution, the percentiles of the run length distribution need to be computed to supplement the ARL-based chart.
An investigation of the percentiles of the run length distribution in Tables 1 to 4 when δ=0 reveals that the false alarms for the ARL-based chart occur considerably earlier than for the MRL-based chart, for cases of both known and estimated process parameters (see the lower percentiles, e.g., 5th, 10th and 25th). If the probability of an early false alarm is of main concern, the lower percentiles (say, the 5th percentile) can be used as an additional criterion in selecting a suitable scheme for a control chart.
Concerning the out-of-control average sample size (ASS1), the value decreases conspicuously when using the MRL-based chart over the ARL-based chart. For instance, when dopt=1.5, m=20 and δ=1, the ASS1 decreases from 8.22 (ARL-based chart) to 5.69 (MRL-based chart). As expected, when the shift is small, the difference in the percentiles of the run length distribution between the MRL-based and ARL-based charts is noticeable. This difference, however, becomes negligible when the shift is moderate or large. Tables 1 to 4 show that this difference is larger when δ=0 than that when δ>0.
5 EXAMPLES OF APPLICATIONS
Computing the percentiles of the run length distribution of the DS X chart provides valuable information to help engineers in the selection of an appropriate control chart scheme. In the Phase-I analysis, suppose that an engineer would like to take 20 samples, each of five observations, in a certain manufacturing process. In the Phase-II process monitoring, four different situations are considered in the following four examples:
EXAMPLE 1
In many industrial processes, early false alarms are a major consideration. A smaller value of the lower percentiles (e.g., 5th, 10th and 25th) when δ=0 will give rise to earlier (or more frequent) false alarms, resulting in repeated process stops and start-ups within shorter time intervals. Based on the lower percentiles of the run length distribution displayed in Tables 1 to 4, we notice that the ARL-based chart produces shorter run lengths at the lower percentiles of the run length distribution when δ=0, compared with those of the MRL-based chart. For example, when δopt, the run length of the 10th percentile (when δ=0) for the ARL-based chart is 16 (see Table 1) as opposed to 30 (see Table 3) for the MRL-based chart. This value of the run length increases by nearly twofold by using the ARL-based chart in place of the MRL-based chart. Accordingly, it is recommended to choose the MRL-based chart with estimated process parameters, as the ARL-based chart signals early false alarm earlier than the MRL-based chart.
EXAMPLE 2
One of the meaningful pieces of information obtained from the computation of the percentiles of the run length distribution is the MRL. If management really wants to have a good understanding of the control chart and to avoid making inaccurate conclusions based on the ARL alone, the design scheme based on MRL helps to alleviate this problem. The MRL-based chart gives a clear picture that, on average, 50 per cent of all the run lengths are less than 250 when δ=0. Meanwhile, for the ARL-based chart, ARL0=250 only provides information about the expected run length; it does not indicate the likelihood, say 50 per cent of the time as in the case of the MRL0, of getting a false alarm by a certain sample. Thus there could be a risk that a practitioner incorrectly interprets the ARL0 as a false alarm that would occur by the 250th sample, with half the chance; although in an actual scenario, a false alarm occurs significantly earlier, i.e. by the 123rd sample when δopt (see Table 1), with half the chance. Similar interpretation problems will be encountered for the out-of-control cases. If an engineer's confidence and understanding is viewed as crucial, the MRL-based chart with estimated process parameters is a more suitable option, as it provides more intuitive and critical information to the engineer.
EXAMPLE 3
In a manufacturing process, assume that an engineer determines that a mean shift in the range of 1.0<δ<2.0 is not acceptable and must be identified as quickly as possible. The control-chart scheme that is more sensitive in detecting an out-of-control condition at this shift will be the best choice. Since Tables 2 and 4 provide us with the results computed from the optimal chart parameters of δopt, we will select one from these two schemes. For example, when δ=1, the design scheme of the ARL-based chart (see Table 2) gives the engineer 95 per cent confidence that an out-of-control signal is disclosed by the 4th sample, i.e. 10 samples earlier than the MRL-based chart (see Table 4). If the detection speed is a main concern, it would be a better choice to opt for the design scheme of the ARL-based DS X chart with estimated process parameters. Therefore the chart's parameters (n1, n2, L1, L, L2)=(4, 6, 1.4232, 4.4648, 2.8008) will be selected for this case. Nevertheless, the engineer needs to realise that the ARL-based chart, although it detects the changes quickly, has a higher false out-of-control signal (see Example 1). Moreover, as discussed in Example 2, he/she may have a tendency to relate the ARL value to the MRL, and make an inappropriate decision based on the ARL alone.
EXAMPLE 4
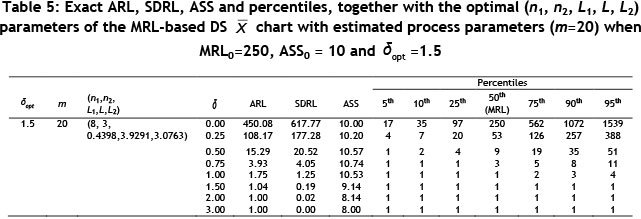
If making a large number of observations in a manufacturing process is not a problem, as in the case of mass production, an engineer may consider making more observations in each sample for the Phase-I and Phase-II processes, in order to increase the sensitivity of a control chart. Table 5 shows the ARL, SDRL, ASS and various percentiles of the run length distribution when n=ASS0=10 is used in both the Phase-I and Phase-II processes. Suppose that an engineer plans to take 20 samples, each of size 10, in the Phase-I process, and intends to discover a mean shift in the range of 1.0<δ<2.0. When n=10, the engineer can claim with 90 per cent certainty that the DS X chart with estimated process parameters will detect a shift of size δ=1 by the 3rd sample (see Table 5) compared with that of the 10th sample (see Table 4) when n=5. This implies that increasing n will increase the detection speed of a control chart. Thus, when process parameters are estimated, the DS X chart designed based on a larger sample size n will be our consideration.
6 CONCLUSIONS
Good knowledge and extensive understanding of the behaviour of the DS  chart with estimated process parameters is essential for engineers. Since the run length distribution is highly right-skewed and the skewness changes with m, n, δand δopt, ARL does not provide a complete understanding of the performance of the DS
  chart with estimated process parameters. On the other hand, the percentiles of the run length distribution depict the early false alarms, MRL, skewness, spread, and extreme (tail) values of the run length distribution of the DS
  chart with estimated process parameters. This information helps engineers to design and assess a control chart.
In this paper, we discuss the advantages of computing the percentiles of the run length distribution for the DS  chart with estimated process parameters. For any fixed small and moderate shifts, our results reveal substantial differences in the percentiles of the run length distribution for all the cases (see Tables 1 to 5) considered in this paper. These percentiles change with m, n and δopt, even though the same value of ARL0 or MRL0 is attained. When process parameters are estimated, the shape, skewness and behaviour of the run length distribution of the DS X chart are different for each case (see Tables 1 to 5). In view of this fact, interpretation of the performance of a control chart with estimated process parameters becomes more complicated. Indisputably, it is highly recommended that after the design scheme of the DS X chart with estimated process parameters has been chosen, based on an engineer's requirement, the percentiles of the run length distribution should be computed to provide extra information.
REFERENCES
[1] Bischak, D.P. and Trietsch, D. 2007. The rate of false signals in X control charts with estimated limits, Journal of Quality Technology, 39, pp. 54-65. [ Links ]
[2] Chakraborti, S. 2007. Run length distribution and percentiles: the Shewhart chart with unknown parameters, Quality Engineering, 19, pp. 119-127. [ Links ]
[3] Teoh, W.L., Khoo, M.B.C., Castagliola, P. and Chakraborti, S. 2014. Optimal design of the double sampling X chart with estimated parameters based on median run length, Computers & Industrial Engineering, 67, pp. 104-115. [ Links ]
[4] Thaga, K. 2003. Contributions to statistical process control tools. PhD thesis, University of Manitoba, Winnipeg, Canada. [ Links ]
[5] Khoo, M.B.C. and Quah, S.H. 2002. Computing the percentage points of the run-length distributions of multivariate CUSUM control charts, Quality Engineering, 15, pp. 299-310. [ Links ]
[6] Radson, D. and Boyd, A.H. 2005. Graphical representation of run length distributions, Quality Engineering, 17, pp. 301-308. [ Links ]
[7] Gan, F.F. 1992. Exact run length distribution for one-sided exponential CUSUM schemes, Statistica Sinica, 2, pp. 297-312. [ Links ]
[8] Daudin, J.J. 1992. Double sampling X charts, Journal of Quality Technology, 24, pp. 78-87. [ Links ]
[9] Irianto, D. and Shinozaki, N. 1998. An optimal double sampling X control chart, International Journal of Industrial Engineering - Theory, Applications and Practice, 5, pp. 226-234. [ Links ]
[10] Torng, C.C., Lee, P.H. and Liao, N.Y. 2009. An economic-statistical design of double sampling X control chart, International Journal of Production Economics, 120, pp. 495-500. [ Links ]
[11] He, D. and Grigoryan, A. 2002. Construction of double sampling S-control charts for agile manufacturing, Quality and Reliability Engineering International, 18, pp. 343-355 [ Links ]
[12] Costa, A.F.B. 1994. X charts with variable sample size, Journal of Quality Technology, 26, pp. 155-163. [ Links ]
[13] Torng, C.C., Lee, P.H., Liao, H.S. and Liao, N.Y. 2009. An economic design of double sampling X charts for correlated data using genetic algorithms, Expert Systems with Applications, 36, pp. 12621-12626. [ Links ]
[14] Costa, A.F.B. and Claro, F.A.E. 2008. Double sampling X control chart for a first-order autoregressive moving average process model, The International Journal of Advanced Manufacturing Technology, 39, pp. 521-542. [ Links ]
[15] Torng, C.C. and Lee, P.H. 2009. The performance of double sampling X control charts under non-normality, Communications in Statistics - Simulation and Computation, 38, pp. 541-557. [ Links ]
[16] Carot, V., Jabaloyes, J.M. and Carot, T. 2002. Combined double sampling and variable sampling interval chart, International Journal of Production Research, 40, pp. 2175-2186. [ Links ]
[17] Torng, C.C., Tseng, C.C. and Lee, P.H. 2010. Non-normality and combined double sampling and variable sampling interval X control charts, Journal of Applied Statistics, 37, pp. 955-967. [ Links ]
[18] Lee, P.H., Torng, C.C. and Liao, L.F. 2012. An economic design of combined double sampling and variable sampling interval X control chart, International Journal of Production Economics, 138, pp. 102-106. [ Links ]
[19] Khoo, M.B.C., Lee, H.C., Wu, Z., Chen, C.H. and Castagliola, P. 2011. A synthetic double sampling control chart for the process mean, II E Transactions, 43, pp. 23-38. [ Links ]
[20] Capizzi, G. and Masarotto, G. 2010. Combined Shewhart-EWMA control charts with estimated parameters, Journal of Statistical Computation and Simulation, 80, pp. 793-807. [ Links ]
[21] Castagliola, P., Zhang, Y., Costa, A. and Maravelakis, P. 2012. The variable sample size X chart with estimated parameters, Quality and Reliability Engineering International, 28, pp. 687-699. [ Links ]
[22] Zhang, Y., Castagliola, P., Wu, Z. and Khoo, M.B.C. 2011. The synthetic X chart with estimated parameters, IIE Transactions, 43, pp. 676-687. [ Links ]
[23] Jensen, W.A., Jones-Farmer, L.A., Champ, C.W. and Woodall, W.H. 2006. Effects of parameter estimation on control chart properties: A literature review, Journal of Quality Technology, 38, pp. 349-364. [ Links ]
[24] Khoo, M.B.C., Teoh, W.L., Castagliola, P. and Lee, M.H. 2013. Optimal designs of the double sampling X chart with estimated parameters, International Journal of Production Economics, 144, pp. 345-357. [ Links ]
Submitted by authors 3 Jul 2014
Accepted for publication 4 Nov 2015
Available online 10 /May 2016
This research is supported by the Universiti Sains Malaysia, Fundamental Research Grant Scheme (FRGS), no. 203/PMGT/6711345.
* Corresponding author tehsyin@usm.my

