


Serviços Personalizados
Artigo
 Inglês (pdf)
 Artigo em XML
 Referências do artigo
Indicadores

Links relacionados
-
 Citado por Google
 -
 Similares em Google
Compartilhar

 Permalink
South African Journal of Industrial Engineering
versão On-line ISSN 2224-7890
versão impressa ISSN 1012-277X
S. Afr. J. Ind. Eng. vol.26 no.3 Pretoria Nov. 2015
http://dx.doi.org/10.7166/26-3-1197
CASE STUDIES
The impact of the maintenance management system: A case study of the PetroSA GTL refinery
B.P. Mahlangu I; L.P. KrugerII
ICollege of Economic and Management Sciences Department of Business Management University of South Africa, Pretoria, South Africa. 47816988@mylife.unisa.ac.za
IICollege of Economic and Management Sciences Department of Business Management University of South Africa, Pretoria, South Africa.krugelp@unisa.ac.za
ABSTRACT
This research study investigated the impact of the maintenance management system (MMS) on production output and profitability (PO&P) at the PetroSA GTL refinery, a state-owned company. The two groups that participated were the maintenance group, consisting of 56 respondents, and the production group, with 38 respondents. The main findings of the research study suggested that the MMS impacts positively on PO&P at the PetroSA GTL refinery. The maintenance scorecard assessment tool - consisting of six perspectives - was used to assess the gap between the MMS and PO&P. The positivism paradigm, the deductive process, a cross-sectional quantitative survey, and descriptive statistics were used to conduct the research study.
OPSOMMING
Hierdie navorsing het ondersoek ingestel na die invloed van die instandhoudings-bestuurstelsel op die produksie en winsgewendheid van die PetroSA raffinadery. Die twee populasiegroepe wat deelgeneem het, was die instandhoudingsgroep, bestaande uit 56 respondente, en die produksiegroep, bestaande uit 38 respondente. Die literatuuroorsig wat vir hierdie studie gedoen is dui daarop dat die instandhoudingsbestuurstelsel produksie en winsgewendheid by die PetroSA Raffinadery verhoog het. Die instandhoudingstelkaart-beoordelingsinstrument bestaande uit ses perspektiewe is gebruik om die gaping tussen die instandhoudingsbestuurstelsel, produksie en winsgewendheid te bepaal. Die positivistiese paradigma, deduktiewe proses, 'n deursnee-kwantitatiewe opname en beskrywende statistiek is gebruik.
1 INTRODUCTION
Fin24 [1], dated 18 September 2014, reported the following remarks by Eskom spokesperson and general manager Mr Andrew Etzinger: "...the power utility Eskom cannot build new power plants if old ones are not properly maintained". This indicates that maintenance is important to ensure that plants or equipment are available, reliable, maintainable, and operable. Fin24 [2], dated 8 October 2014, further reported that Transnet has an infrastructure maintenance backlog of R30-billion, and that any further deterioration of the infrastructure could severely affect South Africa's ability to create jobs and grow the economy. There is a global move towards asset management in an attempt to improve the reliability, availability, maintainability, and operability of plant and equipment.
A growing number of systems are being designed to manage maintenance or assets. Kemp [3] recently slated Eskom for poor maintenance at their power generation plants, citing poor maintenance and ageing plants as core causes of the load shedding problems and unplanned outages. According to Kemp [3], the need for maintenance and the impact of the unplanned outages impact negatively on production and indeed on the country's GDP. The research study focused on the impact of the maintenance management system on production output and profitability at the PetroSA GTL refinery. The challenge that it faces is increased pressure to function and perform, as well as competition from private sector companies in achieving optimum production output and profitability. It is thus suggested that improvements in the maintenance management systems can influence the achievement of optimum production output, which is essential to maximise profit in this competitive environment.
The question arises: Is there any relationship or correlation between MMS and PO&P at the PetroSA refinery? The New Age [4], dated 31 May 2012, reported the following remarks by the Minister of Energy, Ms Dipuo Peters: ".our national oil company, PetroSA, has an important role to play towards ensuring that South Africa meets important goals of ensuring security of fuel supply for our country and it has to do so while it makes profit without relying on the national treasury". The aim of the research study was to investigate the correlation between the MMS as an independent variable and PO&P as a dependent variable. Maintenance management at the PetroSA GTL refinery is the responsibility of the reliability engineering services (RES), tasked to ensure optimum plant, machinery, and equipment availability, reliability, maintainability, and operability. RES consists of six maintenance areas allocated to the main production areas: air and gas separation (AGS), reforming (RFM), synthol (SNT), refinery (REF), blending and storage (B&S), and offsites and utilities (O&U). All six areas consist of mechanical, electrical, and control systems, maintenance functions, and disciplines that are responsible for the implementation, maintenance, and optimisation of the MMS. Each maintenance discipline is managed by the area engineer/superintendent. The six production areas are managed by area production managers who have crews working shifts to implement, maintain, and optimise the production and production output.
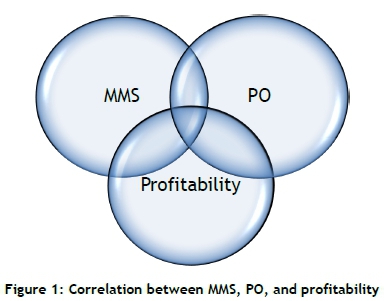
What made this research study necessary is the gap between the three constructs (MMS, production output (PO), and profitability) that impacts PetroSA GTL's strategic functions and the South African government's mandate to commercialise all state-owned assets in the petroleum sector and to manage them as a profitable business for the benefit of all South Africans. As mentioned above, the core aim of this research study was to investigate the correlation between the maintenance management systems, production output, and profitability, as seen in Figure 1 below:
2 RESEARCH OBJECTIVES, DESIGN, AND METHODOLOGY
The primary objective of this paper is to present the results of the research study conducted to investigate the impact of the MMS on PO&P at the PetroSA GTL refinery. This is supported by the following secondary objectives:
■ To identify and document MMS at the PetroSA refinery;
■ To identify just what prevents the achievement of planned/scheduled production output (PO) at refinery;
■ To analyse the effect of interrupted PO on the refinery's maximisation of profit;
■ To analyse the problems in the MMS that may lead to interrupted PO at the refinery;
■ To evaluate how the refinery can improve its MMSs to achieve planned/scheduled PO&P; and
■ To recommend interventions to improve MMS to achieve planned/scheduled PO&P for the refinery.
This study was conducted using the positivism research philosophy. Cameron and Price [5] state that this research philosophy is linked to a belief that phenomena exist independently of the observer and can be detected through direct observation. A deductive research approach was followed to conduct this study. According to Cameron and Price [5], deductive research starts with a theory and proceeds by testing hypotheses derived from the theory. The research methodology followed to collect and analyse data and information adopted a quantitative approach. Page [6] states that a quantitative approach places value on information that can be numerically manipulated in a meaningful way. The data collection methodology consisted of quantitative surveys to study the MMS and PO&P practices at the PetroSA GTL refinery. Saunders, Lewis, and Thornhill [7] state that quantitative survey research involves the structured collection of data from a sizeable population. The data was gathered electronically using the Microsoft Outlook email system, and was analysed using statistical techniques that included means, standard deviations, gap analysis, Pearson product moment correlation coefficient (r), and coefficient of determination (R2).
3 LITERATURE REVIEW
The PetroSA GTL refinery uses the risk-based inspection (RBI) MMS. The system involves checking or inspecting equipment wall thickness and surface conditions, looking for corrosion. It is designed for pipelines or pipe systems, tubes, vessels, and tanks; it excludes motors, pumps, conveyor belt systems, actuators, valves, mills, turbines, compressors, generators, transformers, and other rotating equipment that requires periodic maintenance to sustain its life cycle. However, little, if any, preventive or predictive maintenance is done on the above equipment to prolong its life. Kelly [8] states that MMS concerns budgetary control, maintenance performance measurement and control, long term planning and work control (turnaround management), equipment spares management, and maintenance documentation. Myburg [9] mentions that various sub-systems of physical asset management have matured and become well entrenched, particularly reliability-centred maintenance (RCM) and total productive maintenance (TPM). Berger [10] agrees that TPM, RCM, and lean maintenance (LM) are MMSs focusing on improving plant or equipment reliability, availability, maintainability, and operability. Harris [11] adds that asset management has developed, and philosophies like TPM, risk based inspection (RBI), business centred maintenance (BCM), value driven maintenance (VDM), and LM are currently used to support, enhance, and improve maintenance and asset management. Clark and Young [12] support this by stating that RCM is the leading developed MMS. Saltzer [13] notes that value-adding methodologies such as VDM, LM, RCM, and TPM have been adopted by some of the world's leading organisations in the manufacturing, transport, utility, and energy sectors to create significant economic value. Tyne [14] adds that rCm is the maintenance approach or system that identifies likely and dominant failure modes. McCarthy [15] points out that TPM is a tool or MMS that enhances improvement and releases the potential of the factory, industry, or organisation. As mentioned above, the PetroSA GTL refinery uses the RBI mMs. The next section reviews definitions and the literature study of RBI. The above indicates that there are a number of MMSs, and their applications or benefits differ. The next section unpacks the risk-based inspection MMS that is used by The PetroSA GTL refinery. According to the API [16], RBI is a recommended practice that provides information on using risk analysis to develop an effective inspection plan. This is a system process that identifies facilities or equipment and culminates in an inspection plan. It is based on the probability of failure and the consequence of failure. The authors further state that the output of the inspection planning process should be an inspection plan for each equipment item analysed. This includes the following:
-
inspection methods that should be used;
-
the extent of inspection (percentage of total area to be examined or specific location);
-
the inspection interval or next inspection date (timing);
-
other mitigation activities; and
-
the residual level of risk after inspection and other mitigating actions have been implemented
API [16]) identifies the following RBI maintenance benefits:
-
an overall reduction in risk for the facilities and equipment assessed; and
-
an overall understanding of the current risk.
In addition, API [16] lists the following limitations of RBI maintenance:
-
inaccurate or missing information,
-
inadequate designs or faulty equipment installation,
-
operating outside the acceptable or integrity operating window (IOW),
-
not effectively executing the plans,
-
lack of qualified personnel or teamwork, and
-
lack of sound engineering or operational judgement.
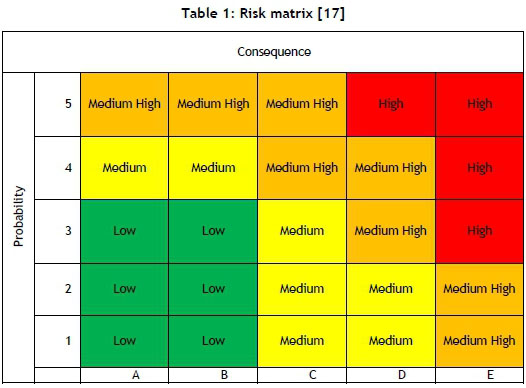
According to Vicente [17], the RBI methodology is aimed at maximising the pressure vessel, the vessel under pressure, and the reliability and availability of the pressurised system. Vicente [17] mentions that the RBI methodology consists of the following five steps:
Step 1 : Qualitative risk ranking: this is calculated by following the standard specification from API 580 and API 581, where the risk is defined as the product of the likelihood and the consequence (risk = likelihood x consequence), as illustrated in Table 1 below:
Step 2: Assessment: this is done after determining the qualitative risk rating. It should cater for dimensions such as mechanical behaviour, potential damage mechanism, and maintenance strategy.
Step 3: Quantifying the inspection results: identifies or determines the actual condition of the equipment, using approaches such as corrosion under insulation (CUI), nondestructive testing (NDT), and visual inspection.
Step 4: Fitness for service and remaining life assessment: this is needed to establish inspection intervals and a basis for reliability-based inspection. It helps to determine the risk priorities relative to other plants that need to be opened during the shutdown. Remaining life is calculated based on API 510, and pitting corrosion is evaluated in Chapter 6 of API 579.
Step 5: Root cause analysis (RCA): identifies the basic root of the problem affecting the integrity of the equipment performance audit.
Robbins [18] lists the following characteristics of effective RBI maintenance:
-
identifying global maintenance risks;
-
analysing and placing risks in a considered ranking order;
-
it has the means to determine the likelihood of occurrence and the impact of that occurrence where likelihood corresponds to issues around the device and the impact on issue outcomes; and
-
it enables users to be holistic in considering the whole picture, to provide a means to target device maintenance in order to optimise resource utilisation.
The next section reviews the literature study for production or production output (PO). According to Smith and Hawkins [19], three laws of manufacturing or production ensure global competitiveness and profitability. These laws state:
(1) Properly maintained manufacturing or production equipment makes many good quality products.
(2) Improperly maintained manufacturing or production equipment makes fewer products of questionable quality.
(3) Inoperable equipment makes no product.
Salvatore [20] states that production refers to the transformation of inputs or resources into outputs of goods and services. Heizer and Render [21] agree that production is the process of creating goods or services, and add that the production process consists of input (labour, money, and management), transformation, and outputs (goods or services). They also report that the objective of the transformation process is to build a production process that meets customer requirements and product specifications within cost and other managerial constraints. Jacobs and Chase [22] highlight that production processes are used to make everything that we buy, ranging from the apartment building in which we live, to the ink with which we write. According to Slack, Chambers, and Johnston [23], each process type implies a different way of organising operations activities with different volume and variety characteristics. The authors identify project, jobbing, batch, mass, and continuous processes as key production or manufacturing process types. Adding to this, Grutter [24] states that project management, job shop, batch production, assembly lines, and continuous flow are key manufacturing/production process types. Krajewski, Ritzman and Malholtra [25] list job shop, batch, and continuous processes as key manufacturing or production process types. Slack, Brandon and Johnstone [26] concur that project, jobbing, batch, mass, and continuous processes are key manufacturing or production process types. Heizer and Render [27] agree that job shop, mass customisation, assembly lines, and continuous processes are key manufacturing/production process types. Finally, Stevenson [28] concurs that job shop, batch, and continuous processes are key manufacturing/production process types. For the purpose of this study, the production process types are identifiewd as project, jobbing, batch, mass, and continuous processes. According to Pycraft et al. [29], a continuous production process operates at higher volume and has lower variety. The process also operates for longer periods, and the products are inseparable; thus production is an endless flow. Adding to this, Evans and Collier [30] indicate that a continuous flow production process is a very high fixed volume, with high investment in equipment and facilities, automated movement of goods, and continuous operation. The PetroSA GTL refinery uses a continuous production process.
Pycraft et al. [29] list the following five performance objectives for any organisation that wants to succeed in the long term (as shown in Figure 2 below):
-
"Do things right": the organisation must satisfy customers by providing error-free products and services.
-
"Do things fast": it must minimise the time between a customer asking for goods or services and the customer receiving them.
-
"Do things on time": keep delivery due dates.
-
"Change what it is doing": enhance flexibility and adaptability.
-
"Do things cheaply": it must produce goods and services at a cost that enables them to be priced appropriately for the market while still allowing for return on investment.

The next section reviews the literature study for profit/profitability. Salvatore [20] suggests that profit is maximised when revenue equals marginal costs, or when marginal profit is equal to zero. The author adds that to maximise profits, organisations should employ each input until the marginal revenue product of the input equals the marginal resource cost of the input.
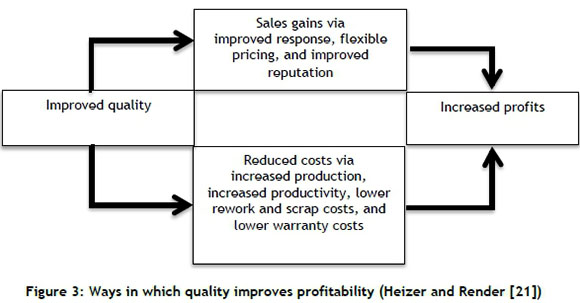
According to Hofstrand [31], profitability is the primary goal of all business ventures, and without profitability, the business will not survive in the long run. Heizer and Render [32] claim that staying in business requires making investments, and investments require making profits. The authors add that there is no social and environmental sustainability without economic sustainability, which requires appropriately allocating scarce resources to make a profit. The authors go on to report that improvements in the quality of products help firms to increase sales and reduce costs, both of which have a positive impact on profitability, as indicated in Figure 3.
According to Salvatore [20], profit serves a crucial function in a free enterprise economy. High profits are a signal that consumers want more of the output of the industry. The author adds that high profits provide incentives for organisations to expand output. An organisation with above-average efficiency profits represents the reward for greater sufficiency. Lower profits or losses indicate that consumers either want less of the commodity or that production methods are not efficient.
4 DEVELOPMENT OF SURVEY INSTRUMENT/TOOL
Two different types of questionnaire were used to gather and collect data and information. The first questionnaire was for the production population group, and the second for the maintenance population group. The questionnaires consisted of Likert scales ranging from 1 to 5, as follows:
1 = strongly disagree
2 = disagree
3 = neutral
4 = agree
5 = strongly agree
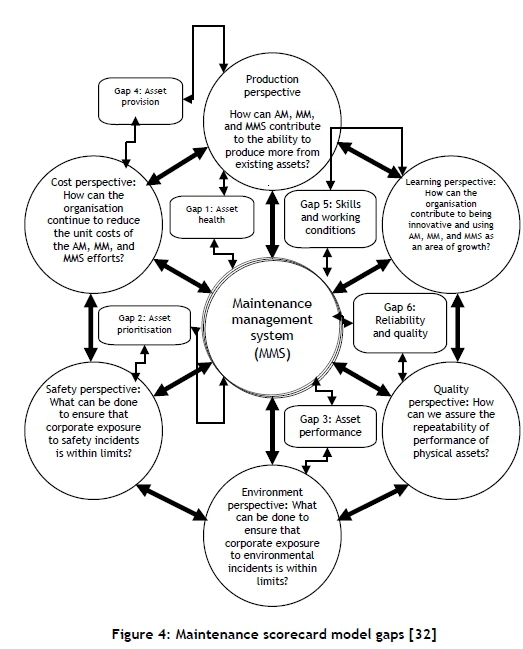
The questionnaires were based on the maintenance scorecard (MS) tool. The purpose of the survey was to determine the opinions (perceptions and expectations) of maintenance and operations employees (Figure 4). The objective of the survey instrument/tool was to investigate and address the following gaps:
-
Production perspective (asset health gap): gap between asset reliability, availability, maintainability, operability, and production output (PO).
-
Quality perspective (reliability and quality gap): gap between asset reliability and quality of products.
-
Cost perspective (asset provision gap): gap between production output and profitability/profit (PO&P).
-
Safety perspective (asset prioritisation gap): gap between production and maintenance personnel in using correct priority ranking or ratings for critical tasks and activities.
-
Environmental perspective (asset performance gap): gap between asset efficiency effectiveness, utilisation, and PO.
-
Learning and growth perspective (skills and working conditions gap): gap between craft skills, competencies, experience, working conditions, and productivity.
5 DATA GATHERING
The stratified sampling technique was used to select the target population to participate in both the MMS and the PO&P survey. The population was segmented into production and maintenance groups, and these were categorised demographically according to designations or trades. The maintenance group consisted of 56 respondents, while the production group had 38 respondents. The questionnaires were distributed electronically and manually to the respondents. Tables 2 and 3 respectively depict the maintenance and production groups classified by trade or designation. Figure 5 depicts the total percentage of respondents for both groups in the survey.
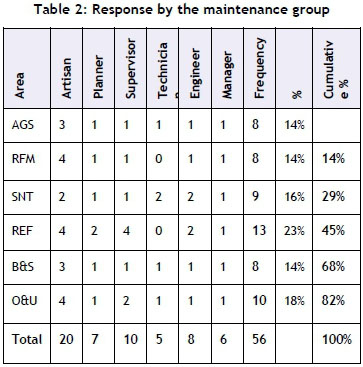
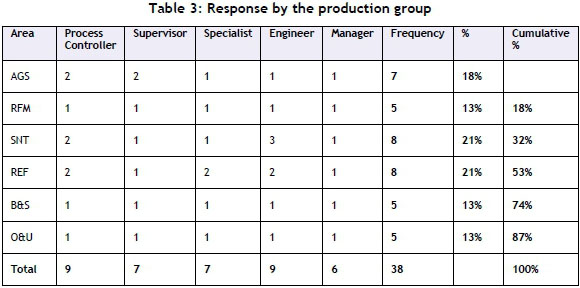
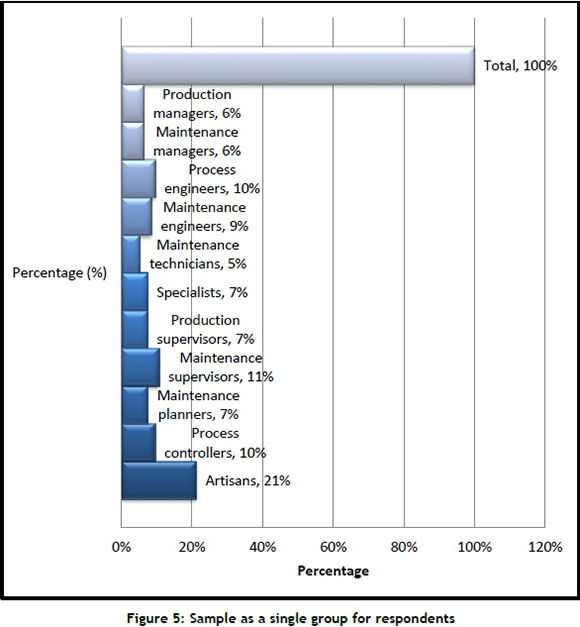
Figure 5 further indicates that the highest number of respondents or participants was the artisans at 21 per cent, followed by maintenance supervisors at 11 per cent, then process controllers at 10 per cent, and maintenance engineers at 9 per cent. The lowest number of participants was maintenance technicians at 5 per cent, then maintenance managers and production managers at 6 per cent, then specialists, production superintendents, and maintenance planners at 7 per cent.
6 RESULTS
A total of 94 responses was collected and received. Fifty-six of the responses came from the maintenance group, and 38 from the production group. Figure 6 below indicates that, for the production group, the reforming (RFM) area represents the smallest PO&P gap of -0.406, while offsites and utilities (O&U) represents the largest gap of -0.653.
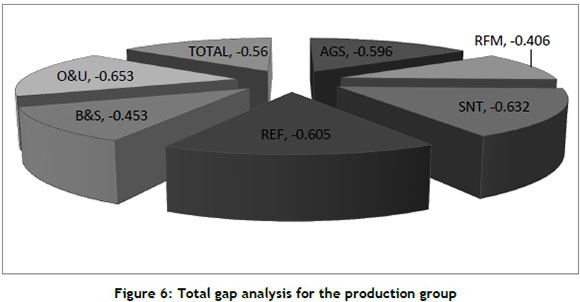
Figure 7 below indicates that, for the maintenance group, air and gas separation (AGS) represents the smallest PO&P gap of -0.828, and synthol (sNt) represents the largest gap of -1.080.
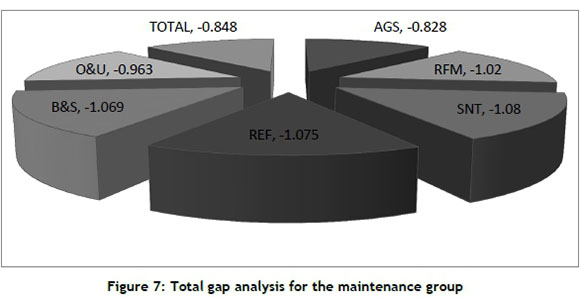
Figure 8 below indicates the overall gap analysis of the PetroSA refinery for the combined maintenance and production groups. It is evident that RFM represents the smallest PO&P gap of -0.615, while SNT represents the largest PO&P gap of -0.856.
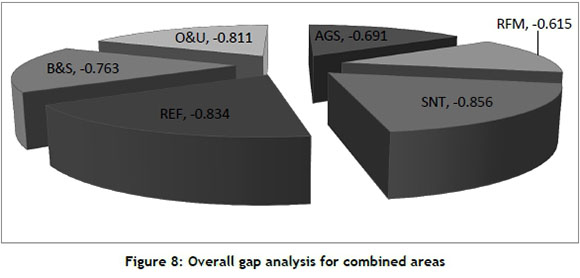
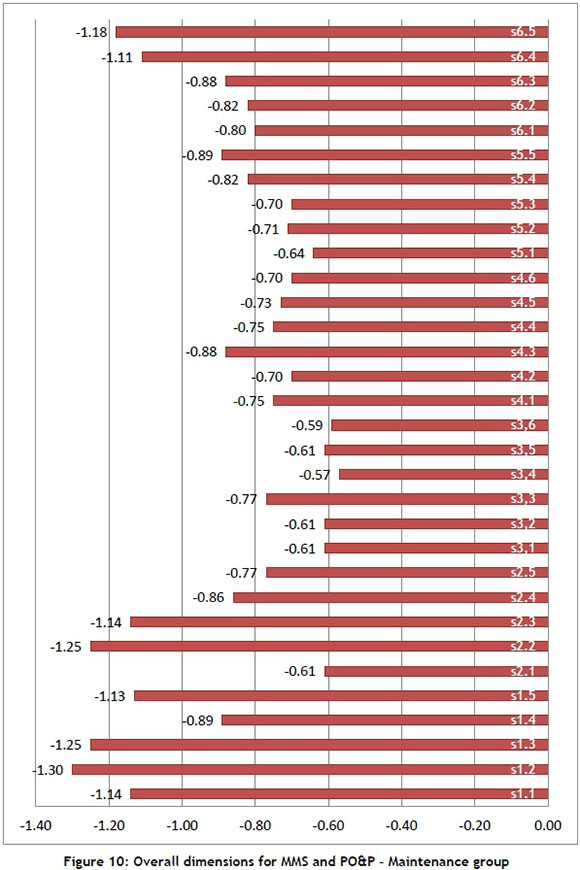
Figure 9 shows that 35 questions or statements were given to respondents, and 32 statements or questions were represented in Figure 10. Both figures indicate that participants responded to at least 35 and 32 statements or questions respectively. Figures 9 and 10 represent the overall dimensions gap analysis for both production and maintenance groups. The analysis shows that production perspective (asset health gap), learning and growth (skills and working conditions), and safety perspective (asset prioritisation gap) represent the largest PO&P gaps.
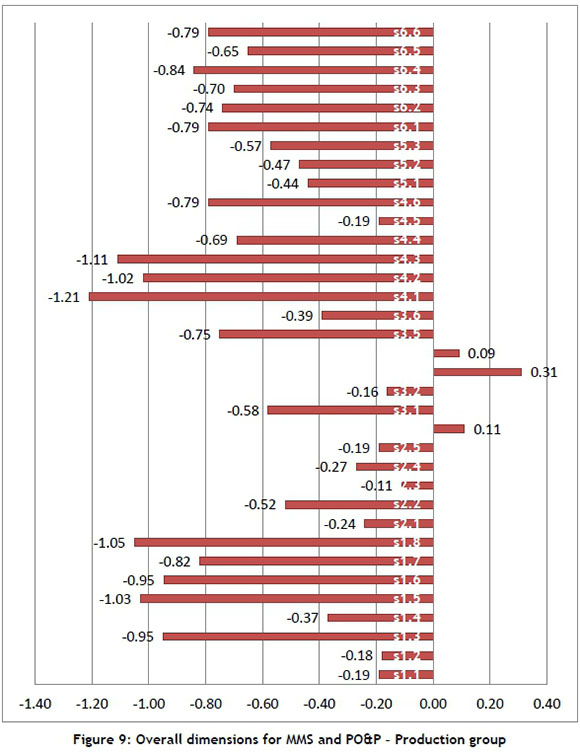
Figures 9 and 10 above further indicate the following about the three perspectives that represented the largest gaps:
(1) Productive perspective (asset health gap)
-
production plans and schedules were not compiled, issued, or communicated;
-
planned/schedules PO targets were not met;
-
production was not planned according to plant or equipment capacity;
-
organisational structure and size contributed negatively to the ability of lower management to make decisions; and
-
plant and equipment were not available, reliable, maintainable, and operable after executing maintenance work.
-
Learning and growth perspective (skills and working conditions gap)
-
maintenance scheduling and coordination was ineffective and poor;
-
planned/schedules work was not completed on time;
-
manpower was not properly and effectively used;
-
work was not properly and effectively prioritised; and
-
cross-functional training was not effective.
-
Safety perspective (asset prioritisation)
-
non-compliance with regulatory requirements in terms of inspecting and maintaining pressure safety valves (PSVs), vessels, and pipelines was the order of the day; and
-
visual planning boards, key performance indicator (KPI) reports, capacity planning, resource allocation, and levelling were negatively perceived.
The average Pearson product moment correlation coefficient (r) for both groups was calculated as follows:
r (average) = r (production) + r (maintenance) / 2
r (average) = (0.773) + (0.8) / 2
r (average) = 0.787
The coefficient of determination was calculated by using
R2 R2 = (0.787)2 = 0.619 = 61.9%
The results were interpreted and analysed using the Cronbach's Alpha (Table 4) and correlation coefficients (Table 5)
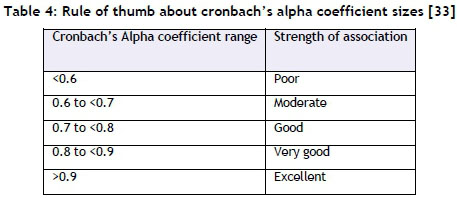
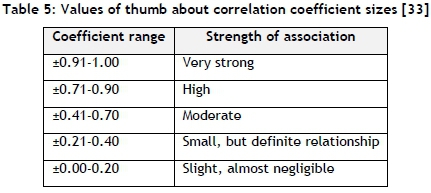
The correlation coefficient and Cronbach's Alpha of 0.619 represent a moderate positive linear relationship between MMS and PO&P (Tables 4 and 5). This implies that MMS explains, influences, and affects 61.9 per cent of the variation in PO&P of the PetroSA GTL refinery. The production output and profit/profitability (PO&P) of the refinery, based on world-class MMSs, can be viewed with a moderate degree of confidence, since 38.1 per cent of the variation in PO&P is unexplained, not influenced, or impacted by MMS.
7 CONCLUSIONS AND RECOMMENDATIONS
The research objectives were met:
(1) Primary objective
The primary objective was to investigate MMSs and their impact or influence on PO&P at the PetroSA GTL refinery. The results indicated the existence of a moderate positive linear relationship between MMS and PO&P. Based on the results, the primary objective was successfully met.
(2) Secondary objectives
The following were the secondary objectives set to support the achievement of the primary objective:
-
To identify and document the MMS at the PetroSA GTL refinery. It was indicated in the Introduction that the refinery was using RBI, RCM and IFP MMSs.
-
To identify just what prevents the achievement of planned/scheduled PO at the refinery. It was indicated in the Results that production perspective ("asset health" gap) represented the largest PO&P gap and that the planned/scheduled PO targets were not met, and production was not planned according to plant and/or equipment capacity.
-
To analyse problems in the MMS that may lead to interrupted PO at the refinery. It was indicated in the Findings that plant and/or equipment unavailability, poor reliability, inoperability, and poor maintainability contributed to reduced PO.
-
To analyse the effect of interrupted PO on the maximisation of profit for the refinery. The Findings indicated that planned/scheduled PO targets were not met, and that production plans and schedules were not compiled, issued, or communicated to relevant stakeholders.
-
To evaluate how the refinery can improve its MMSs to achieve planned/scheduled PO&P. The Findings showed that visual planning boards, capacity planning, resource utilisation, and Key Performance Indicators (KPIs) reports were rated very low by respondents.
-
To recommend interventions to improve MMSs at the refinery. The Findings indicated that production perspective ("asset health gap"), learning and growing ("skills and working conditions gap"), and safety perspective ("asset prioritisation gap) represented the largest PO&P gap. Thus the first step for the refinery would be to improve MMSs by addressing these dimensions.
In practice, these conclusions seem to indicate that the PetroSA GTL refinery should spend more time on improving its maintenance management systems (MMSs) in order to improve its production output and profit/profitability (PO&P). It is recommended that further research be conducted to indicate all areas in the PetroSA GTL refinery in order to obtain a wider view of the impact of the MMS on PO&P.
REFERENCES
[1] Fin24a. 2014. Eskom needs maintenance, not just new plants. News24. www.fin24.com. Accessed 28/11/2014 [ Links ]
[2] Fin24b. 2014. Transnet in R30-billion maintenance backlog. News24. www.fin24.com. Accessed 28/11/2014 [ Links ]
[3] Kemp, J. 2014. Eskom's main problem is maintenance needs. News24. Reuter. www.fin24.com. Accessed 28/11/2014 [ Links ]
[4] The New Age. 2012. [ Links ]
[5] Cameron, S. & Price, D. 2009. Business research methods: A practical approach. London. Chartered Institute of Personnel and Development. [ Links ]
[6] Page, C. & Meyer, D. 2003. Applied research design for business and management, Irwin-McGraw-Hill. [ Links ]
[7] Saunders, M., Lewis, P. & Thornhill, A. 2012. Research methods for business students, 6th edition. England: Pearson Education Limited. [ Links ]
[8] Kelly, A. 2006. Strategic maintenance planning: An essential guide for managers and professionals in engineering and related fields. Burlington, United States of America: Elsevier Butterworth-Heinemann Publishers. [ Links ]
[9] Myburg, J. 2009. The practical implementation of a sound physical asset management system, Guide, pp 1-35. [ Links ]
[10] Berger, D. 2010. Total productive maintenance, Maintenance & Engineering Journal, 10(5), pp 13-14. [ Links ]
[11] Harris, J. 2011. Editorial, Maintenance & Asset Management Journal, 26(6), pp 34. [ Links ]
[12] Clarke, P. & Young, S. 2011. Reliability centred maintenance and Hazop: Is there a need for both?. Maintenance & Asset Management Journal, 11(6), pp 34-40. [ Links ]
[13] Saltzer, M. 2012. Implementing a multi-site maintenance excellence programme, Maintenance & Engineering Journal, 12(2), p 10. [ Links ]
[14] Tyne, G. 2012. Risk mitigation through strategic maintenance and reliability: A practical case study showing the benefits of applying a structured approach for maintenance and reliability techniques, Maintenance and Engineering Journal, 12(3), p 14. [ Links ]
[15] McCarthy, D. 2012. How to get more for less...faster. Maintenance & Asset Management Journal, 27(3), pp 8-12. [ Links ]
[16] API. 2009. Risk Based Inspection, American Petroleum Institute. Recommended Practice 580, 2nd edition. Downstream segment. [ Links ]
[17] Vicente, F. 2010. Mechanical integrity of a large horizontal NGL pressure vessel: Case study. Maintenance & Engineering incorporating Maintenance and Asset Management Journal, 25(5), pp 36-41. [ Links ]
[18] Robbins, P. 2011. Managing risk in device engineering. Maintenance & Engineering incorporating Maintenance & Asset Management Journal, 26(5), pp 45-49. [ Links ]
[19] Smith, R. & Hawkins, B. 2004. Lean maintenance: Reduce costs, improve quality and increase market share. United Kingdom: Elsevier Butterworth-Heinemann. [ Links ]
[20] Salvatore, D. 2001. Managerial economics in a global economy, 4th edition. Orlando: United States of America, Pearson. [ Links ]
[21] Heizer, J. & Render, B. 2011. Principles of operations management: Global edition, 10th edition. United States of America: Pearson. [ Links ]
[22] Jacobs, F.R. & Chase, R.B. 2011. Operations and supply chain management. 13th ed. global edition. New York: McGraw-Hill/Irwin series. [ Links ]
[23] Slack, N., Chambers, S. & Johnston, R. 2010. Operations management, 6th edition. United Kingdom, Prentice Hall, Pearson. [ Links ]
[24] Grutter, A. 2010. Introduction to operations management: A strategic approach. South Africa: Pearson Education, Heinemann. [ Links ]
[25] Krajewski, L.J., Ritzman, L.P. & Malholtra, M.K. 2010. Operations management process and supply chain (global edition), 9th edition. United States of America: Pearson. [ Links ]
[26] Slack, N., Brandon, J.A. & Johnstone, R. 2011. Essentials of operations management. United Kingdom: Pearson Education Limited. [ Links ]
[27] Heizer, T. & Render, B. 2014. Operations management: Sustainability and supply chain management, 11th ed. United States of America: Pearson. [ Links ]
[28] Stevenson, W.J. 2012. Operations management, 1st edition. McGraw-Hill International Edition. [ Links ]
[29] Pycraft, M., Singh, H., Phihlela, K., Slack, N., Chambers, S., Harland, C., Harrison, A. & Johnston, R. 2001. Operations management, Southern African Edition. South Africa: Pearson Education. [ Links ]
[30] Evans, J.R & Collier, D.A. 2007. Operations management: An integrated goods and services approach, International Student Edition. United States of America: Thomson South-Western. [ Links ]
[31] Hofstrand, D. 2009. Understanding profitability. Ag Decision Maker. IOWA State University. University extension. File C3-24. [ Links ]
[32] Mather, D. 2005. The maintenance scorecard: Creating strategic advantage. New York: Industrial Press. [ Links ]
[33] Hair, J.F., Celsi, M.W., Money, A.H., Samuoel, P. & Page, M.J. 2011. Essentials of business methods, 2nd ed. Armonk, New York: M.E. Sharpe Inc. [ Links ]
* Corresponding author
1 The author was enrolled for the Masters of Commerce (MCom - Business Management) in the College of Economic and Management Sciences, School of Management Sciences, Department of Business Management at the University of South Africa (UNISA).

