


Servicios Personalizados
Articulo
 Inglés (pdf)
 Articulo en XML
 Referencias del artículo
Indicadores

Links relacionados
-
 Citado por Google
 -
 Similares en Google
Compartir

 Permalink
South African Journal of Industrial Engineering
versión On-line ISSN 2224-7890
versión impresa ISSN 1012-277X
S. Afr. J. Ind. Eng. vol.26 no.2 Pretoria ago. 2015
GENERAL ARTICLES
Application of a system dynamics model to improve the performance of make-to-order production
Y.-L. Ho
Department of Wealth Management Hsing Wu University, Taiwan 096063@mail.hwu.edu.tw
ABSTRACT
This study provides a system dynamics (SD) model of make-to-order (MTO) production and discusses the key factors of production improvement. The proposed system can be divided into three subsystems: income/cost, order/production, and human resources (HR). The time delay between customer demand, production demand, order quantity, material demand, and inventory is considered in a practical application. In addition, this paper considers how the cycle time is affected by the total input of HR; how unit transportation cost is influenced by the delivery quantity; and how unit penalty (shortage) cost is affected by the amount of shortage. The production capacity, yield, and holding cost needed to satisfy practical demands are all considered. A simulation approach to MTO production for meeting contract requests is presented in this study. Simulation results reveal that the amount of shortage will be the most important factor affecting the policy for the replenishment of material. Although the rise in production capacity leads to a reduced amount of shortage, it does not play a significant role. A sensitivity analysis of the replenishment of material policy is conducted to find out the best suggested policy. The SD model is also shown to quickly simulate changes in system behaviour, which allows an organisation enough time to respond to and conquer any unpredictable situation that might occur.
OPSOMMING
'n Stelseldinamika model van 'n vervaardig-op-bestelling proses word gestel en die sleutelfaktore vir proses verbetering word bespreek. Die voorgestelde sisteem kan in drie subsisteme verdeel word, naamlik inkomste/koste, bestelling/produksie en menslike hulpbronne. Die tydsverloop tussen die kliëntevereiste, produksievereiste, bestelling hoeveelheid, materiaalvereiste en voorraad word in 'n praktiese toepassing oorweeg. Verder word daar gekyk na hoe die siklustyd affekteer word deur die menslike hulpbron insette, hoe eenheidsvervoerkoste deur afleweringshoeveelheid beïnvloed word en hoe eenheidstekortkoste deur die hoeveelheid stoorspasie beïnvloed word. Die produksiekapasiteit, -opbrengs en bergkoste benodig om praktiese vereistes te bevredig word oorweeg. A simulasie gebaseerde benadering tot vervaardig-op-bestelling produksie word voorgehou. Die simulasie resultate toon dat die tekort die belangrikste faktor is wat die materiaalvervangingsbeleid beïnvloed. Alhoewel verhoogde produksiekapasiteit tot 'n verminderde tekort lei, speel dit nie 'n beduidende rol nie. 'n Sensitiwiteitsanalise van die materiaalvervangingsbeleid is gedoen om die beste beleid voor te stel. Die stelseldinamika model word ook gebruik om vinnig veranderinge in die stelselgedrag te simuleer - dit gee 'n organisasie genoeg tyd om op onvoorspelde situasies wat hulself voor doen te reageer en te oorkom.
1 INTRODUCTION
Schiuma et al. [31] describe systems thinking as a powerful approach to understanding the 'real system', which emphasises the relationships between the system's parts rather than the parts themselves [31]. Systems thinking is a qualitative process, while its quantitative process is called simulation. Yim et al. [40] proposed that system dynamics (SD) is a simulation of knowledge-based decision-making. Larsen et al. [22] stated that simulation is generally thought of as a tool for forecasting and prediction. Simulation is used primarily to forecast a variety of complex systems, and as a tool to help a team of managers understand a company's problems and opportunities, both current and future [22].
Systems thinking is the process of thinking about systems, talking about the characteristics of systems, acknowledging that systems are important, discussing some of the insights from system archetypes, and relating the experiences that people have with systems. Systems thinking is teaching about systems, and can be a door-opener and an incentive to go deeper into the study of systems. On the other hand, SD modelling is learning by doing. It is learning through the process of being surprised by the mistakes one makes. SD modelling is a participative activity in which one learns by trial, error, and practice [15].
Systems thinking has its origins in biology, but it has been applied widely in different scientific disciplines: from medicine and engineering to psychology, from economics and business management to art, and so on [2,5,8,10,12,16,19,37]. SD is used as a modelling tool because of its rigorous approach in capturing inter-relationships among variables, and in handling dynamic aspects of the system's behaviour [29]. Suryani et al. [32,33] mention that SD is used to model and to generate scenarios for forecasting demand and evaluating policy scenarios, enabling us to understand the nonlinear dynamics of behaviour under uncertain conditions.
SD, initially developed by Forrester [15], is a method for qualitatively describing and analysing complex systems, and quantitatively simulating system behaviour. Currently, SD has been applied in many diverse areas such as software development, strategic planning, and project management [13,23,24,30,41]. SD can be divided into two stages: qualitative and quantitative analysis. Tako and Robinson [35] state that there is a widely-held belief that SD is used mostly to model problems at a strategic level. Suryani et al. [32,33] argue that the main characteristics of SD are the existence of a complex system, the change of system behaviour from time to time, and the existence of the closed feedback loop.
Based on the above-mentioned reasons, a simulation of a system would be a better method to understand and analyze system behaviour. That is, SD is a good choice for forecasting the behaviour of a particular system. There have been several applications of the SD model in the literature. For example, Quaddus and Intrapairot [29] developed an SD-based decision support system to analyse the impact that management policies have on the diffusion of data warehouses (DW) in a large commercial bank in Thailand. Lyneis [26] developed an SD model to forecast the demand of commercial jets in the aircraft industry. Suryani et al. [32] developed an SD model to analyse and forecast future air passenger demand, based on the capacity of runways and passenger terminals, in order to support long-term growth. While the demand for air travel is difficult to forecast, it is important to use SD [26]. In addition, Chen et al. [11] proposed an SD model that simulates the management process of a power grid-related engineering project. Larsen et al. [22] argued that SD can help users to understand a service company's growth potential, as well as its limitations. Xu and Li [38] developed an SD model with fuzzy multiple objective programming, which can be used to study complex interactions in an industrial system.
The total cost of production should include certain elements, such as any holding and penalty costs [36]. Traditionally, the cost of holding inventory is assumed to increase linearly by a rate that is equal to a percentage of the product's value [3,7]. In addition, Liu and Li [25], Kosuch and Lisser [21], and Estevez-Fernandez [13] have all discussed the penalty cost of the total cost in their studies . Moreover, the production yield is regarded as an important factor in production planning [6,17,20,27] because a better production yield would result in lower cost losses. Furthermore, 'delivery on time' is an important issue; meeting due dates promised to customers is considered to be the most important goal of scheduling [28]. If an organisation does not meet a customer's order deadline, the organisation will decrease its competitive advantage and lose its market share. Thus meeting the delivery deadline of contracts is very important.
In the literature, several authors have considered the topic of performance improvement. For example, Schiuma et al. [31] apply a systems thinking framework to assess the dynamics of knowledge assets in improving business performance. Their framework provides a better understanding of why and how initiatives to manage knowledge assets better can be turned into value creation mechanisms with positive impacts on business performance; this is seen as fundamental to avoiding the misallocation of resources [31]. Cannon [9] discusses the robustness of inventory improvement as an indicator of overall financial performance. Xu [39] states that there are many advantages to analysing performance at the design level, rather than waiting until system testing [39]. Aburas [1] recognises that evaluating the corporate performance of a multi-business company is complicated because it should be viewed from various perspectives and has to satisfy multiple objectives. Taggart and Kienhõfer [34] propose that some commonly-used operational performance measures are on-time-delivery, inventory turns, and direct labour use. Besides, the simulation modelling is applied to investigate the concept of performance analysis [18].
The above-mentioned studies reveal that simulation could be a good approach for predicting behaviour. By inputting different parameters and various policy scenarios, the simulation can produce different results of system behaviour. With this type of tool, an organisation can apply the forecasting behaviour to adjust its future input data or policy scenarios of an SD model, in order to meet the company's goals or customers' satisfaction.
This study conducts a behaviour prediction and sensitivity analysis of different policy scenarios for make-to-order (MTO) production, with the aim of suggesting an optimal policy. An SD model is constructed to simulate and adjust the MTO production plan in order to satisfy the customers' needs, and thus pursue a better profit and reputation. The simulation results of the proposed SD model can provide the references for adjusting the future production environment to meet such a complex and fast-changing industry environment.
2 MODEL DEVELOPMENT
Vensim software is used to develop the SD model and to conduct the simulation of the MTO production. The input parameter for the model is provided by the customer's needs, which links to the order quantity and desired delivery time. Based on this situation, the SD model considers the order quantity and desired delivery time as a contract request. Thus, the customer demand and contract request are provided as the input parameters in the SD model (shown in Figure 1a,b). The proposed SD model is divided into three subsystems: income/cost, order/production, and human resources (HR).
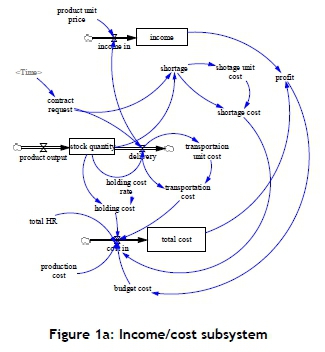
In the income/cost subsystem (Figure 1a), the delivery quantity would directly affect the shortages. In the practical application, the unit penalty cost of shortages is determined by the amount of shortages. This means that a bigger shortage might generate a higher unit penalty cost. In the case study considered in the SD model, the shortage cost per unit product is seen as a function of increase in shortages . In addition, the transportation (delivery) cost per unit product is considered as a decreasing function of delivery quantity, and holding cost is calculated by the unit product price multiplied by the holding cost rate. The total cost includes the fixed costs, HR costs, transportation (delivery) costs, holding costs, shortage (penalty) costs, and production costs. Only the income presents the revenue from selling the delivery quantity.
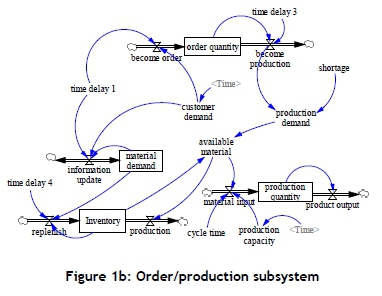
In the order/production subsystem (Figure 1b), order quantity and shortage quantity affect the production demand. The material inventory and production demand affect the available materials where it depends on which one is less. In addition, the available materials, production capacity, and cycle time could directly constrain the production quantity. The production capacity is estimated practically by the organisation in every time interval; however, an organisation can adjust its production capacity if it needs to. The customer demand needs some time to become the order quantity and the material demand; thus it is called the time delay. In addition, that material demand, which needs some time to become the inventory, is also presented.
In addition, available material would affect the production quantity. The production quantity, which is constrained by production capacity, is also presented in the subsystem. Besides, the production quantity would influence the delivery quantity, and the delivery quantity would directly affect the shortage parts. Based on the above-mentioned viewpoint, a better inventory policy and production capacity might reduce the penalty cost of shortage products.
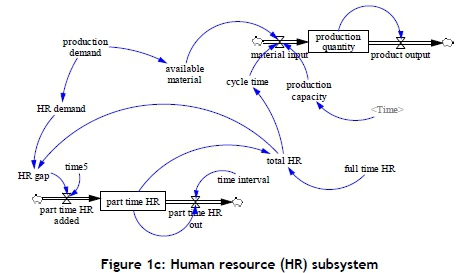
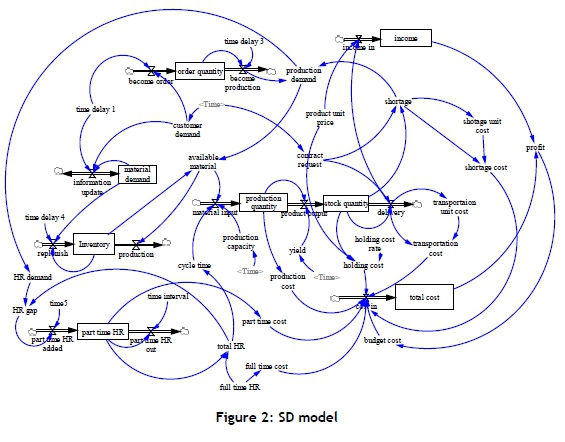
In the HR subsystem (Figure 1c), two types of HR are discussed: full-time and part-time. An HR subsystem considers that a higher input of HR would speed up the production rate. Such a phenomenon is provided in the relationship between the production cycle time and total HR. A higher HR input would result in less cycle time, and a lower cycle time would bring a higher production rate.. In addition, this subsystem also considers that a higher production demand leads to a higher HR input. The model in this study was constructed using a part-time HR input because, if a part-time HR input is adopted, it can decrease the cost pressure of HR for an organisation. The HR subsystem (Figure 1c) shows that production demand would affect the HR demand, and the gap between HR demand and full-time HR would lead to the consideration of recruiting part-time HR. This work also tries to reveal the better HR policy that satisfies the changes in various production environments. The full model that integrates the three subsystems is presented in Figure 2.
3 MODEL VALIDITY
There are three stages of model validity for SD: direct structure tests, structure-oriented behaviour tests, and behaviour pattern tests. This study draws on Barlas' [4] suggestions when testing the model's validity. The direct structure tests were carried out first, then the structure-oriented behaviour tests, and finally the behaviour pattern tests.
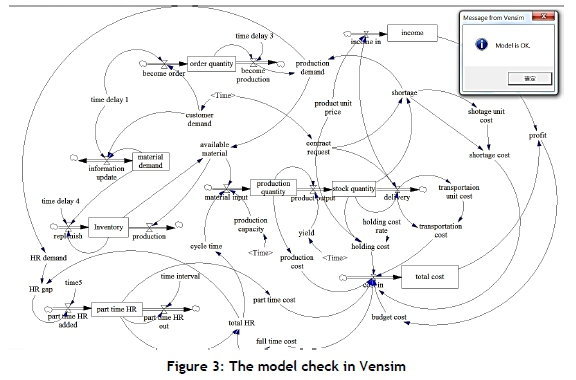
In this study, direct structure tests were used to conduct a structure-confirmation test and a parameter-confirmation test. The author recommends that in the structure-confirmation test, production engineers compare each relationship (mathematical equation or any form of logical relationship) individually with available knowledge about the real system. The function of 'model check' in Vensim should then be applied to assess the validity of the structure, as shown in Figure 3.
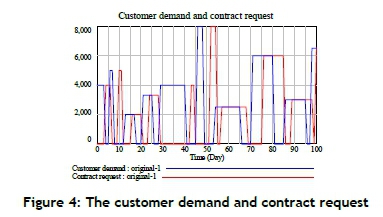
The second direct structure test, the parameter confirmation, evaluates the constant parameters against knowledge of the real system, both conceptually and numerically [14]. The major parameters of the proposed model are customer demand and contract request. In a real system, production is made in response to customer demand and delivered upon a contract request. When customer demand occurs, the delivery quantity and desired delivery time would take place some time after the customer demand (Figure 4). The third direct structure test, the dimensional consistency test, checks for dimensional consistency in the right-hand side and left-hand side of each equation. There are no dummy scaling parameters after conducting the dimensional consistency test.
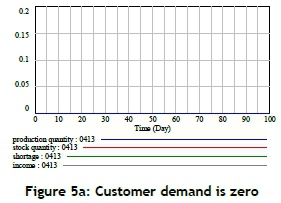
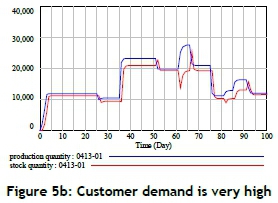
This research then conducts the structure-oriented behaviour tests, extreme-condition test, and behaviour sensitivity test to assess the validity of the structure indirectly by applying certain behaviour tests to model-generated behaviour patterns [14]. An extreme-condition (indirect) test involves assigning an extreme value to a selected parameter and comparing the model-generated behaviour with the observed (or anticipated) behaviour of the real system under the same 'extreme condition'. This work tries to test two extreme conditions: customer demand equals zero, and really high customer demand. The production quantity, stock quantity, shortage, and income all equal zero if the customer demand is zero. In addition, when the customer demand is very high, the production quantity and stock quantity would be limited because of the constrained production capacity. These phenomena are shown in Figures 5a and 5b.
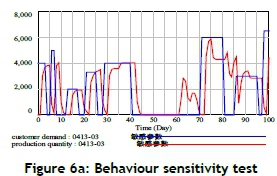
The behaviour sensitivity test consists of determining those parameters to which the model is highly sensitive, and asking whether the real system would exhibit similarly high sensitivity to the corresponding parameters. This study deletes the customer demand from day 42 to 69, and the corresponding production quantity decreases from day 43, and reaches zero on day 45. In addition, the production quantity increases from day 62 because of the process of preparing to satisfy future customer demand. This test can reveal the behaviour sensitivity of the proposed model (shown in Figure 6a).
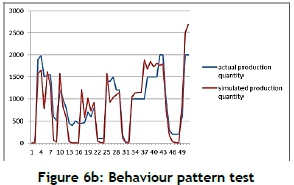
Once enough confidence has been built in the validity of the model structure, one can start applying certain tests designed to measure how accurately the model will reproduce the major behaviour patterns exhibited by the real system. It is crucial to note that the emphasis is on pattern prediction (periods, frequencies, trends, phase lags, and amplitudes), rather than on point prediction [14]. The behaviour pattern test is conducted on a case company that has provided its historical data for the past 50 days. We input this data into the proposed SD model, and reproduce the production quantity, also called the simulated production quantity. The behaviour patterns of actual production quantity (real system data) and simulated production quantity are shown in Figure 6b. The periods, frequencies, trends, phase lags, and amplitudes of the simulated production quantity seem to fit the actual (real) one. After completing these tests, the proposed model is said to be applicable and valid.
4 SIMULATION RESULTS AND DISCUSSIONS
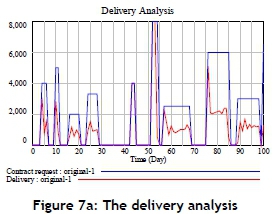
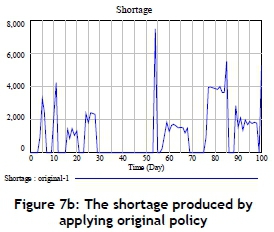
In the original (baseline scenario) situation, the original replenishment policy for materials states that materials need to be replenished if the material demand is greater than the inventory, but that there is no replenishment if the material demand is lower than the inventory. This study treats such a policy as the original policy. The baseline scenario also includes the original production capacity during each simulated period: the original production capacity is shown in Figure 8a. The above-mentioned data is extended from the historical data that was introduced in Section 3. The original (baseline scenario) situation is inserted into the proposed SD model in order to simulate the MTO production. Figure 7a reveals that there is a great gap between the number of contract requests and delivery in the original (baseline scenario) situation. Similarly, a great amount of shortage can be found by applying the original situation (Figure 7b).
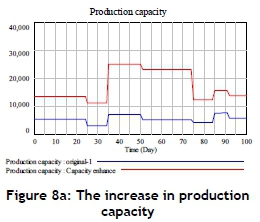
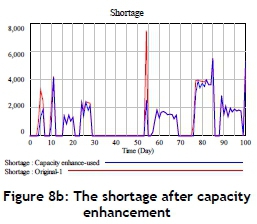
To improve the original (baseline scenario) situation of shortages, enhancing the production capacity can normally increase the production/delivery quantity, and thus the shortage amount can be reduced. Figures 8a and 8b present the increase in production capacity and the change in shortages respectively. The simulation results show that shortage quantity does not improve significantly after an increase in production capacity. The simulation results show that the shortage amount decreases from 115,632 to 101,710 units during the simulation period - that is, the improvement rate is only around 12 per cent.
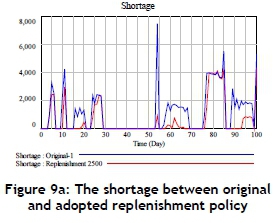
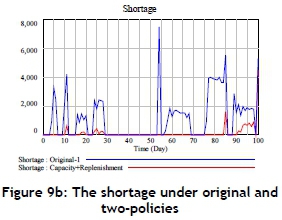
The improvement rate of the shortage is not significant after increasing production capacity, and thus the replenishment policy of the material inventory might play another key role in improving the shortage. Therefore, this paper tries to change the replenishment policy for materials as follows. The comparison of original policy is to replenish the gap plus 2,500 units if material demand is greater than inventory quantity, or to replenish 2,500 units if material demand is lower than inventory. A compared policy seems better because the shortage amount is decreasing from 115,632 to 61,984 units during the simulation period, that is, the improvement rate is around 46 per cent (shown in Figure 9a). In addition, this study conducts another scenario where the compared replenishment policy and an enhancement in production capacity are both applied. This study finds that a significant improvement exists because the shortage amount decreases from 115,632 to 12,107 units during the simulation period, and the improvement rate is around 90 per cent (shown in Figure 9b). Based on the above discussion, it is easy to understand that the most important variable that influences the shortage is the quantity of material inventory. It means that the replenishment policy should be considered first if a large shortage occurs.
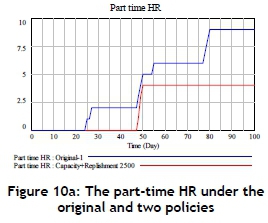
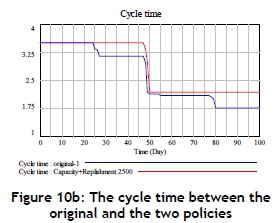
In addition, with regard to HR, whenever the compared replenishment policy and an enhancement in production capacity are applied, the part-time HR seems to remain at a lower level because of the increased production capacity; the HR has no strong tendency to reduce the cycle time of production (increasing the production rate) (Figure 10a,b).
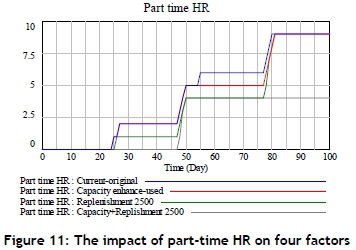
The simulation results also reveal that the change in production capacity or the increase in material inventory might only slightly retard the recruitment of part-time HR (Figure 11). Therefore it cannot cause the part-time HR to stay at a lower level. On the other hand, adopting an increase in the replenishment of material inventory and enhancing the production capacity would keep the part-time HR at the lower level during most of the simulation period (Figure 11). Actually, by adopting both policies, the part-time HR could stay at the lowest level, and thus the HR cost would be minimised.
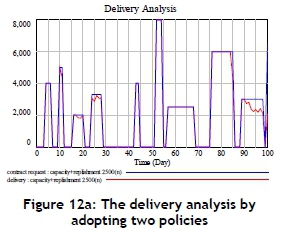
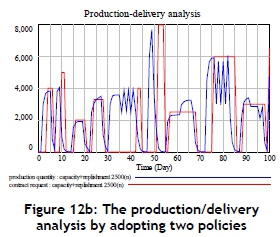
In this production case, the quantity request is 207,000 units during the simulation period. In the original (baseline scenario) case, the whole delivery quantity is only 91,368 units due to a lack of material inventory and production capacity. After adopting another scenario where the compared replenishment policy and production capacity enhance are both applied, the simulated delivery quantity is up to 193,899 units. Originally, the completion rate of the original (baseline scenario) case for the delivery request is only 44.14 per cent. After adopting another scenario (compared replenishment and enhancement of capacity policies), the completion rate quickly rises to 93.67 per cent (Figure 12a). The production/delivery analysis is shown in Figure 12b. It is revealed that production is a continuous accumulated process to satisfy the requested delivery quantity in a specific time. Such a phenomenon is shown in Figure 12b.
5 SENSITIVITY ANALYSIS
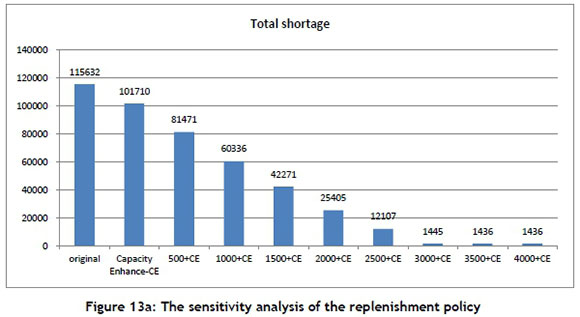
When searching for an optimal replenishment of material policy, the following sensitivity analysis was conducted. First, an increase in the production capacity (Figure 8a) and the improvement rate of shortages was only 12 per cent after adopting a capacity enhance (Figure 8b). The original replenishment of material policy is to replenish the gap if the material demand is greater than the material inventory, and no replenishment is conducted if the material demand is lower than the inventory. The sensitivity analysis of this study tries to increase 500 units per iteration, no matter whether the material demand is greater or lower than the inventory (shown in Figure 13a). It is obvious that whenever a policy "3500 units added" is adopted - no matter material whether demand is greater or lower than the inventory - this policy can obtain the critical point because the extra units added will not catch the lower shortage (Figure 13a). At this time, the shortage amount is 1,436 units.
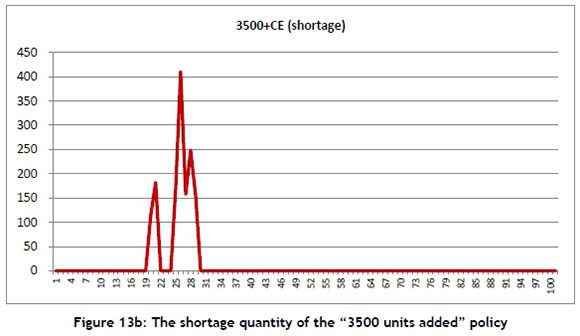
The next step in improving shortage is considered in what follows. When the simulation result, a shortage, is checked, it reveals that all shortages occurred from time 19 to time 29 when the "3500 units added" policy was adopted (Figure 13b). Then an organisation would check the production capacity and production yield during this time interval. From the SD model, it is found that the production yield remains at its level of up to 90 per cent during the period from time 19 to time 29, but that the production capacity seems significantly below that of the other time intervals (Figure 8a). Therefore, a good suggestion would be to try to raise the production capacity from time 19 to 29 for further shortage improvement.
6 CONCLUSIONS
An SD model of MTO production was constructed, along with a simulation of this production. The time delay between customer demand, order quantity, material demand, production demand, and inventory were all considered. In addition, this work considered that HR, the amount of delivery quantity, and the amount of shortages all affect the cycle time, unit transportation cost, and unit penalty (shortage) cost respectively. The production capacity, yield, and holding cost to satisfy the practical situation were also considered.
This work applies an SD model to simulate the amount of shortage (delivery conformity) in an MTO production. An SD model can reveal quick changes in system behaviour through changes in input data or policies. In addition, the simulation results from an SD model can provide a referenced production schedule under the given situations of production capacity, HR, replenishment of material policy, and so on. Moreover, an SD model can calculate quickly the improvement in performance after various policies have been adopted; the most important factor can then be found. This study revealed that the replenishment of material policy is the most important factor that affects shortage. A sensitivity analysis was also conducted to suggest the optimal policy for the replenishment of material. Furthermore, an SD model can respond quickly to changes in system behaviour, and such a characteristic would allow an organisation enough time to cope with unpredictable situations. In summary, this study provides a valuable decision support tool through the application of computer software. That is, another organisation can duplicate this study to predict its problems by changing its input functions and policies only.
Recommendations for future research include the need to develop a mathematical model to deal with the situations of the layout of production lines according to the simulated production quantity in every production time. In addition, sudden changes in production capacity and the sudden insertion of new orders need to be considered in future investigations and discussions. Moreover, it is highly recommended that a subsystem of product quality be developed. In summary, this study can offer a valuable tool to deal with the improved performance of MTO production in an organisation.
REFERENCES
[1] Aburas, H.M. 2010. An integrated performance management framework for a multi-business company. South African Journal of Industrial Engineering, 21(1), pp. 35-43. [ Links ]
[2] Ackoff, R.L. 2010. Systems thinking for curious managers. UK: Triarchy Press. [ Links ]
[3] Ayomoh, M.K.O., Oladeji, O. & Oke, S.A. 2004. Investing the dynamics of an inventory system in the manufacturing sector: A case study. South African Journal of Industrial Engineering, 15(1), pp. 19-30. [ Links ]
[4] Barlas, Y. 1996. Formal aspects of model validity and validation in system dynamics. System Dynamics Review, 12, 183-210. [ Links ]
[5] Bateson, G. 1979. Mind and nature: A necessary unity (advances in systems theory, complexity, and the human sciences). New York: Hampton Press. [ Links ]
[6] Benson, R.F., Conningham, S.P. & Leachman, R.C. 1995. Benchmarking manufacturing performance in the semiconductor industry. Production and Operations Management, 38(3), pp. 201-216. [ Links ]
[7] Berling, P. 2008. Holding cost determination: An activity-based cost approach. International Journal of Production Economics, 112, pp. 829-840. [ Links ]
[8] Bernhard, T. 1993. Systems engineering: Principles and practice of computer-based systems engineering. Chichester: John Wiley & Sons. [ Links ]
[9] Cannon, A. 2008. Inventory improvement and financial performance. International Journal of Production Economics, 115, pp. 581-593. [ Links ]
[10] Capra, F. 1997. The web of life - A new scientific understanding of living systems. Norwell: Anchor. [ Links ]
[11] Chen, L., Lisha, Z., Na, L. & Ming, Z. 2012. Modelling and simulation of power grid engineering project based on system dynamics on the background of smart grid. Systems Engineering Procedia, 3, pp. 92-99. [ Links ]
[12] Dangerfield, B.C.1999. System dynamics applications to European health care issues. Journal of the Operational Research Society, 50(3), pp. 45-353. [ Links ]
[13] Dyner, I., Smith, R.A. & Pena, G.E. 1995. System dynamics modeling for residential energy efficiency analysis and management. Journal of Operational Research Society, 46, pp. 163-173. [ Links ]
[14] Estevez-Fernandez, A. 2012. A game theoretical approach to sharing penalties and rewards in projects. European Journal of Operational Research, 216, pp. 647-657. [ Links ]
[15] Forrester, J.W. & Senge, P. M. 1980. Tests for building confidence in system dynamics models. In: Legasto, A.A., Forrester, J.W. & Lyneis, J.M. (eds) System dynamics. Amsterdam: North-Holland. [ Links ]
[16] Gharajedaghi, J. 2005. Systems thinking: Managing chaos and complexity - A platform for designing business architecture. UK: Butterworth-Heinemann. [ Links ]
[17] Gering, M. 1999. Activity based costing and performance improvement. Management Accounting, 77(3), pp. 24-25. [ Links ]
[18] Gupta, S., Tewari, P.C. & Sharma, A.K. 2008. A performance modelling and decision support system for a feed water unit of a thermal power plant. South African Journal of Industrial Engineering, 19(2), pp. 125-134. [ Links ]
[19] Haines, S.G. 2000. The systems thinking approach to strategic planning and management. Delray Beach, FL: St. Lucie Press. [ Links ]
[20] Kane, V.E. 1986. Process capability indices. Journal of Quality Technology, 18(1), pp. 41-52. [ Links ]
[21] Kosuch, S. & Lisser, A. 2010. Stochastic shortest path problem with delay excess penalty. Electronic Notes in Discrete Mathematics, 36, pp. 511-518. [ Links ]
[22] Larsen, E., Van Ackere, A. & Warren, K. 1997. The growth of service and the service of growth: Using system dynamics to understand service quality and capital allocation. Decision Support Systems, 19, pp. 271-287. [ Links ]
[23] Lei, X., Zhang, J. & Li, J. 2012. A system dynamics model for urban low-carbon transport and simulation in the city of Shanghai, China. Advances in Information Sciences and Service Sciences, 4(1), pp. 239-246. [ Links ]
[24] Li, J., Lin, Y. & Jin, F. 2012. A supply chain simulation model with customer's satisfaction. International Journal of Advancements in Computing Technology, 4(10), pp. 125-132. [ Links ]
[25] Liu, L. & Li, Y. 2006. The fuzzy quadratic assignment problem with penalty: New models and genetic algorithm. Applied Mathematics and Computation, 174, pp. 1229-1244. [ Links ]
[26] Lyneis, J. 2000. System dynamics for market forecasting and structural analysis. System Dynamics Review, 16, pp. 3-25. [ Links ]
[27] Meyersdorf, D. & Yang, T. 1997. Cycle time reduction for semiconductor wafer fabrication facilities. Advanced Semiconductor Manufacturing Conference and Workshop, IEEE/SEMI, pp. 418-423. [ Links ]
[28] Ohta, H. & Nakatani, T. 2006. A heuristic job-shop scheduling algorithm to minimize the total holding cost of completed and in-process products subject to no tardy jobs. International Journal of Production Economics, 101, pp. 19-29. [ Links ]
[29] Quaddus, M. & Intrapa, A. 2001. Management policies and the diffusion of data warehouse: A case study using system dynamics-based decision support system. Decision Support Systems, 31, pp. 223-240. [ Links ]
[30] Rodrigues, A.G. & Williams, T.M. 1998. System dynamics in project management: Assessing the impacts of client behaviour on project performance. Journal of Operational Research Society, 49(1), pp. 2-15. [ Links ]
[31] Schiuma, G., Carlucci, D. & Sole, F. 2012. Applying a systems thinking framework to assess knowledge assets dynamics for business performance improvement. Expert Systems with Applications, 39, pp. 8044-8050. [ Links ]
[32] Suryani, E., Chou, S.Y. & Chen, C.H. 2010. Air passenger demand forecasting and passenger terminal capacity expansion: A system dynamics framework. Expert Systems with Applications, 37, pp. 2324-2339. [ Links ]
[33] Suryani, E., Chou, S.Y., Hartono, R. & Chen, C.H. 2010. Demand scenario analysis and planned capacity expansion: A system dynamics framework. Simulation Modelling Practice and Theory, 18, pp. 732-751. [ Links ]
[34] Taggart, P. & Kienhòfer, F. 2013. The effectiveness of lean manufacturing audits in measuring operational performance improvements. South African Journal of Industrial Engineering, 24(2), pp. 140-154. [ Links ]
[35] Tako, A.A. & Robinson, S. 2012. The application of discrete event simulation and system dynamics in the logistics and supply chain context. Decision Support Systems, 52, pp. 802-815. [ Links ]
[36] Wang, Y.C. & Cheng, W.T. 2008. A sensitivity analysis of solving joint replenishment problems using the RAND method under inaccurate holding cost estimates and demand forecasts. Computers & Industrial Engineering, 55, pp. 243-252. [ Links ]
[37] Warren, K. 2002. Competitive strategy dynamics. West Sussex, England: John Wiley & Sons. [ Links ]
[38] Xu, J. & Li, X. 2011. Using system dynamics for simulation and optimization of one coal industry system under fuzzy environment. Expert Systems with Applications, 38, pp. 11552-11559. [ Links ]
[39] Xu, J. 2012. Rule-based automatic software performance diagnosis and improvement. Performance Evaluation, 69, pp. 525-550. [ Links ]
[40] Yim, N.H., Kim, S.H., Kim, H.W. & Kwahk, K.Y. 2004. Knowledge-based decision making on higher level strategic concerns: System dynamics approach. Expert Systems with Applications, 27, pp. 143-158. [ Links ]
[41] Zhao, X., Yang, Y., Liu, A., Hu, J. & Jia, J. 2012. System dynamic modeling of owners' influences on the outcome of mega-projects: A case study from China. Journal of Convergence Information Technology, 7(3), pp. 91-100. [ Links ]

