


Services on Demand
Article
 English (pdf)
 Article in xml format
 Article references
Indicators

Related links
-
 Cited by Google
 -
 Similars in Google
Share

 Permalink
South African Journal of Industrial Engineering
On-line version ISSN 2224-7890
Print version ISSN 1012-277X
S. Afr. J. Ind. Eng. vol.26 n.2 Pretoria Aug. 2015
GENERAL ARTICLES
The effect of the emergency medical services vehicle location and response strategy on response times
C. SteinI, 1 ; L. WallisII; O. AdetunjiIII, *
IDepartment of Emergency Medical Care University of Johannesburg, South Africa cstein@uj.ac.za
IIDivision of Emergency Medicine University of Cape Town, South Africa lee.wallis@afem.info
IIIDepartment of Industrial and Systems Engineering University of Pretoria, South Africa olufemi.adetunji@up.ac.za
ABSTRACT
Response time is currently considered to be an important performance indicator in Emergency Medical Services (EMS) systems. A number of factors may affect response times, including the location of emergency vehicles and the type of response system design used. This study aimed to assess the effects of emergency vehicle location and response system design on response time performance in a model of a large South African urban EMS system, using discrete-event simulation. Results indicated that both the emergency vehicle location and response system design factors had a significant effect on response time performance, with more decentralised vehicle location having a greater effect.
OPSOMMING
Reaksietyd word tans beskou as 'n belangrike prestasie-indikator in mediese nooddienste sisteme. Verskeie faktore mag die reaksietyd beïnvloed. Die doel van die studie is om die effek van die ligging van noodvoertuie en die tipe reaksie-sisteemontwerp op die reaksietyd te ondersoek binne die konteks van 'n Suid Afrikaanse stedelike gebied deur gebruik te maak van diskrete-gebeurtenis simulasie. Resultate dui daarop dat beide die ligging van noodvoertuie en die reaksie-sisteemontwerp die reaksietyd beïnvloed. Hoe meer gedesentraliseer die voertuie se plasing was, hoe beter was die effek op die reaksietyd.
1 INTRODUCTION AND STUDY BACKGROUND
Emergency Medical Services (EMS) systems coordinate the organisation of personnel, facilities, and equipment for the provision of pre-hospital emergency care within a defined geographic area [1]. Because pre-hospital emergency care involves the assessment and treatment of patients at the scene of an incident rather than at a fixed location such as a hospital, one of the key resources in any EMS system is the set of emergency vehicles available for incident response. A number of factors may influence the average time taken for an emergency vehicle to reach its allocated incident location from the point where it is dispatched - an interval known as the response time.
With the exception of cardiac arrest cases, there is a lack of data linking improved patient outcomes to shorter response times in general [2-5]. Nevertheless, response time is still currently regarded as an important performance indicator in many EMS systems and by EMS regulating bodies [6,7]. Decision-makers in such systems therefore typically devote significant attention to factors affecting response time performance in order to comply with response time benchmarks determined by local or national regulating bodies or authorities.
South Africa, classified as having an upper-middle-income advanced emerging market economy [8], has nine Provinces, each with a Department of Health that is responsible for the provision of EMS within its respective geographic area. With a population of 51.8 million [9], a rapid rate of urbanisation, a significant burden of disease [1θ], and particularly with a high number of cases of injury caused by inter-personal violence [11], EMS systems in urban centres of South Africa tend to be used frequently [12].
Formal emergency care qualifications for non-physicians were first introduced in South Africa in the 1970s. This was initially in the form of a 'Basic Life Support' (BLS) level of care, and by the mid-1980s both 'Intermediate Life Support' (ILS) and 'Advanced Life Support' (ALS) qualifications had been added. Pre-hospital emergency care was first organised and provided by fire departments in each Provincial local authority or district; however, this was changed in eight of the nine Provinces, with the Provincial Departments of Health becoming directly responsible for the provision of EMS at an operational level [13].
Both the qualification structure and the operational responsibility for EMS provision described above have led to a number of historical system characteristics that are still very evident in urban South African EMS systems today. First, because there has always been a relative paucity of ALS-qualified paramedics in South Africa, urban EMS systems have typically used an approach where ALS paramedics provide a primary response to high-acuity incidents in non-transport primary response vehicles (PRVs). The rationale behind this approach is that it allows ALS paramedics to respond quickly to incidents where they are most likely to be needed, and that they do not have to be available to transport every case to hospital. Consequently, a two-tier response design for high-acuity cases has taken root, with the first tier being that of the ALS non-transport response, followed by an ILS or BLS response for support and transportation to hospital. If required the ALS paramedic will accompany the transport vehicle to hospital.
Second, in the earlier phases of EMS development when fire departments played a major role in the provision of EMS, emergency vehicle location tended to be centralised at fire stations and was static relative to changing incident demand patterns. Although EMS provision is currently not fire department-based in eight of the nine Provinces, emergency vehicle location policies have largely retained these characteristics of centralisation and static deployment.
As is the case in many EMS systems in the world, South Africa has national benchmarks for EMS response times in both urban and rural settings, identifying response time as an important performance indicator of EMS quality (currently it is the only nationally-defined performance indicator in South Africa). Even though the benchmark values for high- and lower-acuity cases are relatively benign by international standards, no Provincial EMS with operations in a large urban centre has managed to comply with them [14-16]. It is therefore relevant to consider whether changes to EMS system design factors might improve response time performance.
Of the many system factors that could possibly affect response time performance, this study aimed to assess the effects of emergency vehicle location and response system design (its tiers) on response time performance, by using a discrete-event simulation model of a large urban EMS system in Cape Town, South Africa.
The city of Cape Town is located in the Western Cape Province of South Africa. The city covers an area of 2,461 km2 with a population of 3.74 million [17], and has an economy based mainly upon small-, medium-, and micro-enterprises, manufacturing, and tourism [18]. Cape Town produces 11 per cent of South Africa's gross domestic product. The city comprises a diverse range of socio-economic groupings, from high-income in affluent areas to extreme poverty in informal settlements [18].
Cape Town's EMS system is divided geographically into six sectors, each associated with a Provincial tertiary or district hospital as the main receiving facility for emergencies. Not all of the six sectors can be classified as urban areas. For this reason, and also for the purposes of limiting model scope and complexity, only four of the six sectors were included in the simulation model. These four sectors represented a mix of population densities, socioeconomic strata, and incident acuities.
Emergency vehicles in Cape Town's EMS system are a combination of ambulances and PRVs, with ambulances staffed mainly by non-ALS paramedics and PRVs staffed only by ALS paramedics. All emergency vehicles are located at holding points while idle and awaiting dispatch to an incident. In the four modelled sectors, there was a total of 28 holding points, 49 ambulances, and four PRVs. Of the 49 ambulances, 11 (22 per cent) had ALS capability. Not all incident responses have to contain ALS, because BLS- and/or ILS-qualified paramedics might respond to some. ALS capability is determined by the presence of at least one ALS-qualified paramedic in a vehicle, and is constrained by the availability of these individuals who are typically in short supply in most services.
All emergency vehicles are under the command and control of the Emergency Control Centre (ECC), which is responsible for receiving calls for emergency assistance from the public, performing triage on each call (known as an 'incident'), and dispatching and controlling an appropriate emergency vehicle to the incident based on the vehicle's proximity to the incident and incident acuity. Further details of the dispatch and other processes are described in the conceptual model below.
2 METHODS AND MODELLING APPROACH
2.1 Overview
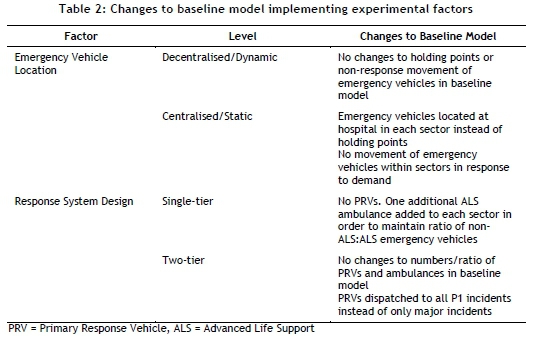
The initial simulation model, referred to below as the baseline model, was based solely on part of the existing EMS system in Cape Town, and was validated against this system. The research design identified two experimental factors, each with two levels. The emergency vehicle location factor consisted of a centralised (static) level and a decentralised (dynamic) level, while the response system design factor consisted of a single-tier level and a two-tier level. In order to assess the effects of these two factors on response time performance, the baseline model was altered after validation in order to implement each level of the two experimental factors. This yielded four individual models (scenarios) that were run independently for the same run length and number of replications to produce response time data for comparison.
2.2 The modelling approach
The simulation modelling followed the stepwise approach described by Banks et al. [19]. Some of these steps have been combined in the form of a summarised description of the modelling approach.
2.3 The conceptual model and input data modelling
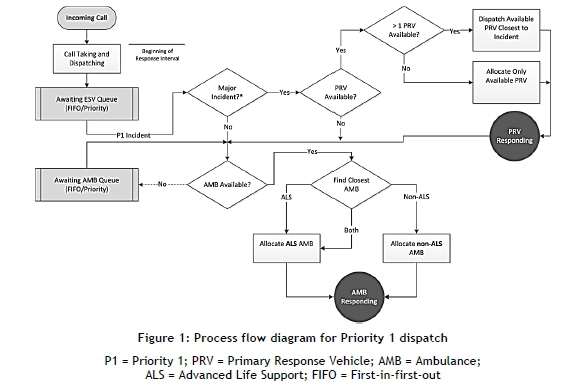
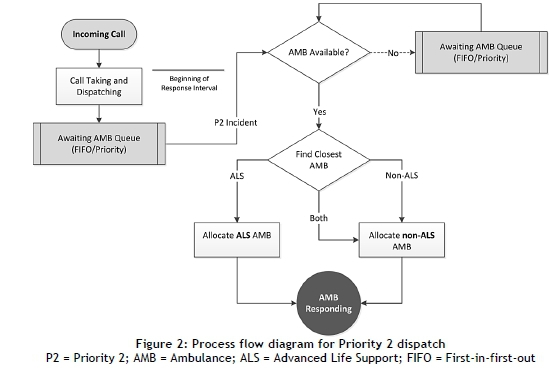
A conceptual model detailing the model content (scope, level of detail, entities, resources, and other objects) was created after interviews with three system experts responsible for management, response planning, and dispatch operations. System documents and policies were also consulted as part of the conceptual modelling process. The conceptual model included a description of the emergency vehicle dispatch process logic for high-acuity (Priority 1 - P1) and low-acuity (Priority 2 - P2) incidents. The process flow diagrams are shown in Figures 1 and 2.
Process logic was also described for non-response emergency vehicle movement and shift changes. Non-response emergency vehicle movement involved the movement of vehicles between holding points, based on demand and availability in the areas served by each holding point. This movement was determined by dispatchers at the ECC who monitored each holding point and instructed vehicles at holding points with adequate capacity to move to holding points where vehicle capacity had decreased (typically, where no idle vehicles were available). A similar distribution and balancing of vehicles at the inter-sector level was coordinated by dispatchers at the ECC.
Data on incident arrival rates, incident priorities, incident exempt status (meaning whether or not a patient was transported to hospital), time delays for call-taking and dispatch, and time delays for on-scene activities were obtained from an analysis of data from the ECC Computer Aided Dispatch (CAD) system. Data between 1 January 2012 and 31 December 2012, representing incidents in the four selected sectors, was used. Probability distributions and parameters for dispatch and on-scene time delays were obtained using an input analyser application [20]. Time delays at hospitals for handover of patients and emergency vehicle cleaning and preparation were not available from the CAD system. This data was obtained from a survey on hospital delay times performed by ECC personnel between 2012 and 2013. Only mean delay times were available, and thus no probability distribution could be fitted; exponential distributions were used for hospital delay times at each sector hospital based on expert knowledge of the hospital delay process.
2.4 Model translation
The conceptual model was translated into a software representation using an object-oriented simulation application called Simio [21], which offers a rich graphical user interface for model development, with a substantial number of standard objects such as nodes and vehicles. Each of these objects has built-in process logic that can be extended with a wide variety of event-linked process steps for individual intelligence. Objects can also be sub-classed in order to extend their basic capabilities. Simio was selected particularly because of its rich vehicle object modelling and customisation capabilities.
Incident locations
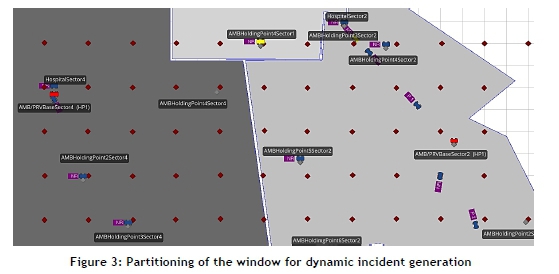
The four EMS sectors chosen for modelling were represented as polygons drawn to scale in Simio's two-dimensional simulation grid, known as the facility window. Location data in the form of geographic coordinates for each incident was obtained from the ECC CAD system. These coordinates were plotted as points on a map of Cape Town using Geographic Information System (GIS) software [22]. In order to simplify the model, mapped incident points were clustered into 2 km x 2 km cells using a grid overlay and count function in the GIS software. Dividing each cell's point count by the total count gave a proportional point or incident weighting per cell. A node object was located at the centre of each 2 km x 2 km cell in Simio's facility window, representing the clustered incidents in each cell. Figure 3 shows a facility window view of two sectors, some of their associated clustered incident nodes, and the location of key facilities by such nodes.
Patient entities
Patient entities in the model represented real patients requiring emergency care. Conceptually, there was a one-to-one relationship between patients and incidents. However, because of the clustering of incident locations in the model, many patient entities were typically associated with a single incident node, without any loss of functionality.
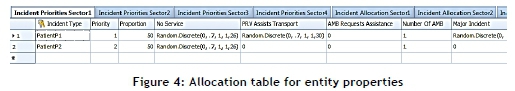
Patient entities were created by a separate source object for each modelled sector. The arrival rate of patient entities was controlled by a rate table containing mean hourly incident counts obtained from the CAD system data. Rate tables in Simio are used to simulate time-varying arrival rates following a non-stationary Poisson process based on hourly counts specified in the associated rate table. Each patient entity source was configured to assign state variables for incident priority, exempt status, and whether or not the incident was classified as a major incident according to identified probability distributions (Figure 4). After creation, each patient entity underwent a delay that simulated ECC call-taking and dispatch processing. Probability distributions and parameters for P1 and P2 incident delays were obtained from CAD system data using the input analyser.
Following the call-taking and dispatch processing delay, each patient entity was transferred to an incident node. For each sector, a data table was created containing a list of incident nodes and associated incident weightings reflecting the distribution of incidents over cells described above. Patient entities were assigned to incident nodes randomly, but following the proportional weighting for each node using a built-in Simio function. In this way, patient entities were distributed to incident nodes in a manner reflecting the spatial distribution of incidents in the real system. Transfers between source objects and destination incident nodes were executed in zero time.
Vehicles, on-scene processing, and patient entity transport
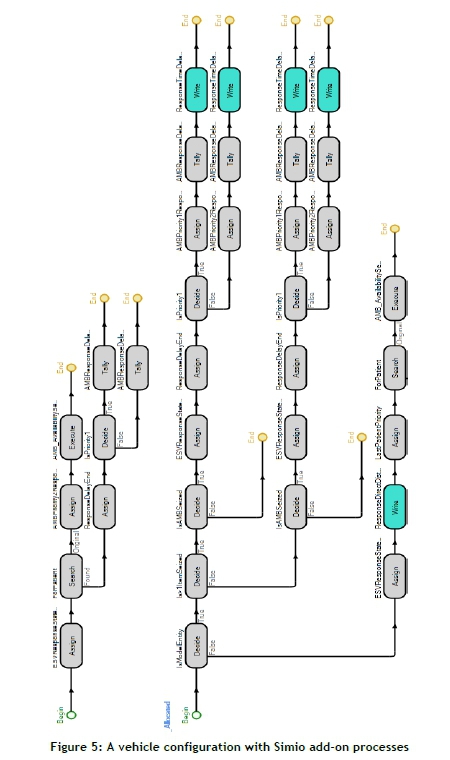
The arrival of a patient entity at each incident node triggered a series of events and processes that resulted in the selection and movement of one or more emergency vehicles to the relevant node. Both ambulances and PRVs were modelled. Ambulances were modelled by sub-classing the transporter object, provided as part of Simio's standard library of objects. Much of the logic required for selecting and moving transporters between nodes, and for transporting other entities, is determined by the configuration of the transporter's properties and other variables. Incident nodes are also configured to select transporters only from specific lists, and rules for the selection of transporters can be specified. Through configuration of both transporters and incident nodes in each sector, the dispatch logic for ambulances contained in Figures 1 and 2 was implemented in the model. PRVs were also modelled by sub-classing the transporter objects, but these were configured so that they functioned as vehicles and did not transport patient entities. These vehicles were also configured to implement the PRV dispatch logic in Figures 1 and 2. Figure 5 is a view of some add-on processes logic used to configure the ambulance vehicle on allocation to an incident.
Both ambulances and PRVs were configured to move between nodes through the 'free-space' of the model's facility window. This makes it possible for vehicles to be immediately diverted to their new destinations in cases where they were either seized or released for response activities while not at a node. No data on real emergency vehicle speeds was available from the modelled system; consequently, mean vehicle speeds were determined during validation of the model by setting speeds that produced acceptable response times when all other aspects of the model had been configured. Vehicle mean speeds were modulated by a weighting factor that estimated the effect of traffic congestion at various times of the day.
Each incident node was also configured with add-on process logic that was executed when either an ambulance or a PRV entered the node. This logic was used to determine vehicle behaviour under various circumstances for each vehicle type, and was mostly related to determining how long the on-scene delay was. On-scene delays were derived from probability distributions and parameters obtained from CAD system data. For ambulances, on completion of the on-scene delay, each patient entity was loaded and the vehicle routed to the hospital associated with the sector containing the incident node. For PRVs, on completion of the on-scene delay, the vehicle was either released and made idle again or in some cases accompanied the ambulance with which it was associated to the relevant hospital.
Arrival of ambulances (and PRVs in some cases) at hospital nodes was handled in a similar way to that described above. Add-on process logic was used to determine vehicle behaviour and simulate the hospital hand-over and vehicle preparation delay. Mean hospital delay times were derived from system data and modelled using exponential distributions, as raw data was not available for the determination of probability distributions. On completion of hospital delay time, each vehicle was returned to an idle state and either returned to its holding point or re-allocated to another waiting patient entity.
Non-response vehicle movement and on/off-shift behaviour
In keeping with dispatch policies contained in the conceptual model, ambulance capacity at each holding point (also represented in the model by a node object) within each sector was monitored continuously. Capacity was determined by how many idle ambulances were associated with each holding point. When any holding point's capacity decreased to zero, an idle ambulance was moved from the closest holding point to that holding point. When the holding point's capacity exceeded at least one idle ambulance again, the moved ambulance was returned to its original holding point. In this way, ambulances were moved between holding points according to demand, as they are in the real system. No such movement was used for PRVs, as there was only a single PRV per sector. A similar approach was implemented at sector level; when the ambulance capacity of a sector decreased to zero, ambulances were allocated from neighbouring sectors that had the capacity.
Shift changes were simulated through process logic by changing an on/off shift state variable in each vehicle depending on the system time. As a condition for allocation to a patient entity, each vehicle's shift state variable had to be set to 'on-shift'. Shift changes occurred during 30-minute windows between 06:00 and 07:00 AM and PM every day, with 50 per cent of the vehicles in a sector flagged as 'off-shift' in each 30-minute window. Off-shift vehicles were not moved from their holding points, but were not available for allocation. Busy vehicles were allowed to continue their response or transport activities and were then returned to their holding point if off-shift.
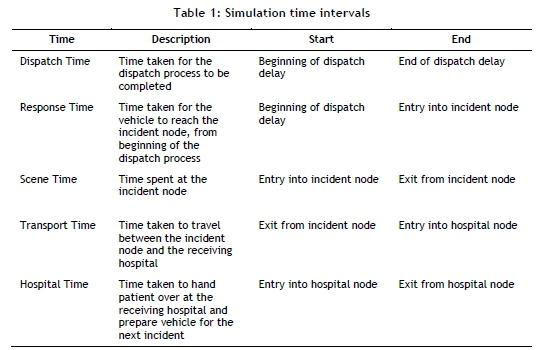
Measurement of time intervals
Response-related time intervals were measured at various points in the model. Although not directly related to response time performance, on-scene and transport times were also measured. Details of the relevant time intervals and when they were measured are given in Table 1. Each time interval was written to a text file and later used in data analysis (see write steps in Figure 5).
2.5 Verification and validation
Model verification was addressed throughout the translation process. One of the key verification methods was the use of modular development, which involved first building a limited component of one sector, with incremental testing and assessment of output data.
Animation was used extensively, as were Simio's debugging tools, which consisted of the model trace and watch facility. Once the correct behaviour of vehicles had been verified, a complete sector was developed, and then the other sectors were added until the full-scale model was in place. Verification was enhanced by the fact that no direct coding was necessary in order to build the model. All development used Simio's graphical user interface, visual tools, and add-on process logic.
Validation consisted primarily of comparing model output with data obtained from the CAD system. Before this comparison was made, an appropriate warm-up period, simulation run length, and number of replications was determined using time series plots and plots of cumulative means and 95 per cent confidence intervals for P1 and P2 response times. Based on this, a warm-up period of eight days was chosen, with a run length of seven days and 15 replications, giving a 0.45 per cent confidence interval deviation.
For validation purposes, response times for P1 and P2 cases were compared, along with P1 and P2 on-scene and hospital transport times. The method developed by Welch and described by Law and Kelton [23] was used to construct 95 per cent confidence intervals for the differences between model and system data. Results indicated that three of the eight model variables were not significantly different from system variables. In the remaining cases, the differences were significant; however, the percentage difference between model and system data ranged between 0.59 per cent and 1.31 per cent. These differences were considered small enough to accept the validity of the model for the purposes of the study.
2.6 Implementation of the experimental factors
The processes described above resulted in a baseline model of EMS operations in four of six sectors of the Cape Town area. This model was changed in order to implement each of the two experimental factors: emergency vehicle location and response system design. These changes resulted in four different models, each representing the four combinations of the levels of experimental factors, and are summarised in Table 2.
Common random numbers were used as a method of variance reduction between the four models. This was accomplished by synchronising random number streams used for input distributions in each of the models. Data for analysis was obtained by running each of the four models for the same warm-up period, run length, and number of replications as those used during validation.
2.7 Data analysis
Dependent variables included P1 and P2 response times (as defined in Table 1) and the proportion of P1 and P2 incidents meeting the South African national benchmark response time targets for urban areas. These are 15 minutes or less for P1 incidents, and not more than 60 minutes for P2 incidents. The independent variables were the two experimental factors already identified.
Analysis of variance (ANOVA) was used for statistical analysis of output data from the four simulation models. The General Linear Model procedure in IBM SPSS [24] was used with a five per cent significance level. Interaction plots were produced of estimated marginal means for all dependent variables across both factor groups. In order to assess fit of the linear model with experimental data, residuals were checked for mean values, constancy of variance, and normality. Residuals were also checked for signs of autocorrelation.
3 RESULTS
The normality assumption of ANOVA was confirmed by assessing each dependent variable set (Kolmogorov-Smirnov tests, all p > 0.05), while the homogeneity of variances assumption was assessed with Box's test of equality of covariance matrices (M = 30.250, p = 0.661) and Levene's test of equality of error variances (all p > 0.05). Suitability of the statistical model was assessed by analysis of residuals for all dependent variables, which were confirmed to satisfy the assumptions of zero mean and constant variance. Partial autocorrelation plots were used to assess the assumption of independence. Some evidence was found of autocorrelation in both sets of P2 data (response times and proportion of responses meeting the 60-minute target), which suggested that the model could have been slightly improved; however, this is unlikely to have changed any conclusions drawn from the results below. Normality of residuals was assessed with Kolmogorov-Smirnov tests (all p > 0.05). Tests of the main effects of the model are shown in Table 3.
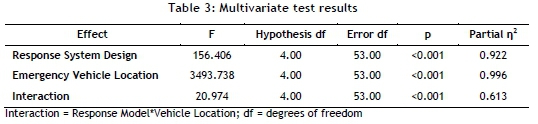
The multivariate test of overall differences among factors was significant, with moderate to large estimated effect sizes. Observed power (not shown in Table 3) was 1.0 for all factors. Values for Hotelling's Trace, which is an estimate of the relative contribution of each factor to the model, were 11.804 (Response System Design), 263.678 (Emergency Vehicle Location), and 1.583 (Response System Design * Emergency Vehicle Location). Results from univariate between-subjects tests are shown in Table 4.
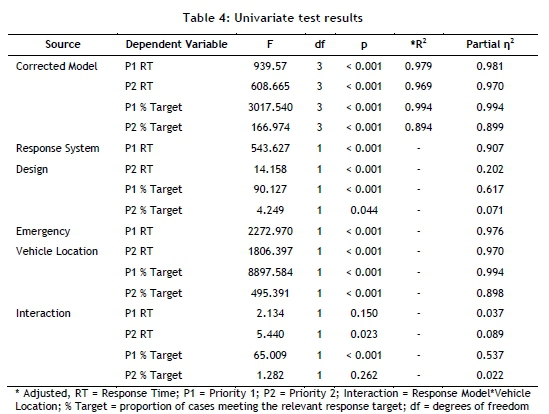
The model is significant for all of the dependent variables, as indicated in each of the dependent variable rows for the corrected model source. Both Response System Design and Emergency Vehicle Location have significant effects on all of the dependent variables, except for P1 'response time' and P2 'responses meeting the response target' under Response System Design * Emergency Vehicle Location. There is some variation in the strength of the effect observed above. Effect sizes for P2 'response time' and P1 and P2 'responses meeting the response targets' for the response model factor are smaller than those for other single factor-dependent variable effects, while effect sizes under the interaction of Response System Design and Emergency Vehicle Location are all very small. Interaction plots of the estimated means of each dependent variable across levels of each factor are shown in Figures 6 and 7.
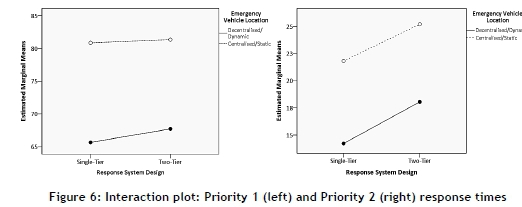
Figures 6 and 7 confirm visually what the results in Table 4 indicate: that decentralised/ dynamic emergency vehicle location is associated with the best response time performance in both the P1 and the P2 groups. The impact of the two different response system designs can also be seen; however, this effect is less pronounced in general. The choice of response system design does have more of an impact on response times across levels of vehicle location for P1 cases than for P2's (Figure 6 left versus right). This effect is not evident, however, when considering the proportion of P1 and P2 'responses meeting response time targets' (Figure 7 left versus right). Although the differential slopes of lines in Figures 5 and 6 confirm an interaction effect (Table 4), both individual main effects are significant for P1 and P2 cases.
4 DISCUSSION
4.1 Emergency medical services system design
The current study shared some similarities with previously published EMS simulation studies; however, it was also quite different in that its aim was not only to answer operational questions in the real system from which the model was derived. Rather, this study attempted to answer broader questions about two commonly-used EMS systems design approaches in South Africa: the location of emergency vehicles in a centralised/static way (more commonly used) versus a decentralised/dynamic way, and the use of a single- or two-tier (more common) response design. By making the relevant experimental changes to a single baseline model of EMS operations in Cape Town, and with the use of common random numbers as a variance reduction technique, the differences in response time performance between the four models can be attributed mainly to the experimental factors.
4.2 Implications of the results for emergency medical services systems design
The results of this study suggest that both the location of emergency vehicles and the response system design used have a significant effect on response time performance, and so are important factors in this regard. Of the two factors, 'emergency vehicle location' had a greater effect. The combination of a decentralised/dynamic emergency vehicle location strategy and a single-tier response system design produced the best response time performance. Despite being the single relative best scenario and resulting in response time performance better than the baseline model, the decentralised/dynamic single-tier model did not produce response times capable of meeting the South African national benchmark targets for either P1 or P2 cases.
The fact that decentralised emergency vehicle location at holding points produced better response time performance in this model is not surprising, and it corroborates other data on the importance of emergency vehicle proximity to incidents [25-31], albeit using a baseline model that is more expansive and complex. Although the location of emergency vehicles at holding points and their demand-based movement between holding points requires a greater degree of organisation and control from a dispatching perspective, the benefits of this approach for response time performance have been clearly demonstrated.
Results indicating that the single-tier response design produced better response time performance are important in the South African context, because many urban EMS systems use the two-tiered approach in the belief that this optimises the availability of ALS-qualified personnel (as described in this paper's background section). It would appear that the provision of ALS in a small number of PRVs, each serving a relatively large sector, negatively affects response time performance when at least some ALS ambulances are available - even a relatively small proportion, as in the baseline model with 20 per cent of ambulances having ALS capability. The reason for this is again related to proximity, with ALS ambulances better located to respond quickly to P1 incidents than a handful of PRVs, when the ambulances are located in a decentralised manner.
As summarised above, the results of this study have identified the best-performing combination of experimental factors; however, the model representing this combination is still not capable of yielding adequate response time performance from a benchmarking perspective. There may be a number of possible modifications to the existing approach, which may be capable of improving response time performance further. Given the effect of emergency vehicle decentralisation, it is logical to think that finer-grained decentralisation might further improve response times. Emergency vehicle allocation and re-allocation that is more responsive to shifting demand patterns may also have the potential to place these vehicles better in proximity to incidents. Both of these approaches require further research, using the baseline model already developed.
5 CONCLUSION
This study used discrete-event simulation to assess the effects of emergency vehicle location and response system design on response time performance in a model based on EMS operations in a large urban centre in South Africa. Results indicated that a single-tier decentralised/dynamic model produced the best response time performance, although this still did not meet the South African benchmark targets for response times in urban systems. It is possible that further decentralisation in a single-tiered system and deployment of emergency vehicles in a way that more closely matches demand may bring about the required level of response time performance.
6 LIMITATIONS
Conclusions drawn from this study are limited by the fact that the baseline model was validated against a system with unique case-load, resources, and spatial relationships between incidents, emergency vehicle locations (holding points), and hospitals. Therefore it cannot be said with certainty that the same effects of the experimental factors would be seen when these are applied to models of other large urban EMS systems. Some data was not available for modelling purposes, most notably emergency vehicle average speeds, which may have affected the accuracy of the model.
ACKNOWLEDGEMENTS
The authors wish to thank Simio LLC for a grant that allowed the use of their software in this study. This research was supported in part by the National Research Foundation of South Africa (Unique Grant 86454).
REFERENCES
[1] Holliman, J. 2010. Standard EMS terms and definitions. In: Tintinalli, J., Cameron, P. & Holliman, J. (eds) EMS: A practical global guidebook. People's Medical Publishing House. pp. 3-7. [ Links ]
[2] Blackwell, T.H., Kline, J.A., Willis, J.J. & Hicks, G.M. 2009. Lack of association between prehospital response times and patient outcomes. Prehospital Emergency Care, 13(4), pp. 444 450. [ Links ]
[3] Blanchard, I.E., Doig, C.J., Hagel, B.E., Anton, A.R., Zygun, D.A., Kortbeek, J.B. et al. 2011. Emergency medical services response time and mortality in an urban setting. Prehospital Emergency Care, 16(1), pp. 142-151. [ Links ]
[4] Pons, P.T., Haukoos, J.S., Bludworth, W., Cribley, T., Pons, K.A. & Markovchick, V.J. 2005. Paramedic response time: Does it affect patient survival? Academic Emergency Medicine, 12(7), pp. 594-600. [ Links ]
[5] Pons, P. & Markovchick, V.J. 2002. Eight minutes or less: Does the ambulance response time guideline impact trauma patient outcome? The Journal of Emergency Medicine, 23(1), pp. 43-48. [ Links ]
[6] Dunford, J., Domeier, R.M., Blackwell, T., Mears, G., Overton, J., Rivera-Rivera, E.J. et al. 2002. Performance measurements in emergency medical services. Prehospital Emergency Care, 6(1), pp. 92-98. [ Links ]
[7] Moore, L. 2009. Performance measurement in EMS. In: Lerner, E., Pirallo, R., Swor, R. & White, L. (eds) Evaluating and improving quality in EMS. Kendall Hunt Professional, pp. 80-98. [ Links ]
[8] The World Bank. 2014. Data: South Africa. Retrieved from http://data.worldbank.org/country/south-africa#cp_gep. Accessed on 19 May 2014. [ Links ]
[9] Statistics South Africa. 2012. Census 2011. Retrieved from http://beta2.statssa.gov.za/publications/P03014/P030142011.pdf [ Links ]
[10] South African Institute of Race Relations. 2012. Demographics: South Africa Survey. Johannesburg. [ Links ]
[11] Seedat, M., Van Niekerk, A., Jewkes, R., Suffla, S. & Ratele, K. 2009. Violence and injuries in South Africa: Prioritising an agenda for prevention. Lancet, 374(9694), pp. 1011-1022. [ Links ]
[12] Wallis, L.A., Garach, S.R. & Kropman, A. 2008. State of emergency medicine in South Africa. International Journal of Emergency Medicine, 1(2), pp. 69-71. [ Links ]
[13] Kotze, J. 1990. The role of the ambulance service as part of the health profession. South African Medical Journal, 78, pp. 320-322. [ Links ]
[14] Gauteng Department of Health and Social Development. 2013. Annual Report 2012-2013, Pretoria. Available from http://www.health.gpg.gov.za/Document/Pages/AnnualReports.aspx [ Links ]
[15] KwaZulu-Natal Department of Health. 2014. Annual Report 2013-2014; Part B: Programme 3: Emergency Medical Services, Durban. Available from http://www.kznhealth.gov.za/AnnualReport/2013_2014.pdf [ Links ]
[16] Western Cape Department of Health. 2013. Annual Report 2012-2013, Cape Town. Available from http://www.westerncape.gov.za/dept/health/documents/annual_reports/2012 [ Links ]
[17] City of Cape Town. 2014. Statistics for the City of Cape Town - 2012. Available from https://www.capetown.gov.za/en/stats/Documents/City_Statistics_2012.pdf [ Links ]
[18] City of Cape Town. 2014. Economic Statistics. Available from https://www.capetown.gov.za/en/ehd/Documents/EHDEcon.pdf [ Links ]
[19] Banks, J., Carson, J.S. & Nelson, B.N.D. 2010. Introduction to discrete-event simulation. Discrete-event system simulation. Prentice-Hall, pp. 4-22. [ Links ]
[20] Rockwell Automation Inc. 2013. Arena input analyzer. Milwaukee, USA. [ Links ]
[21] Simio LLC. 2013. Simio design edition. Pennsylvania, USA. [ Links ]
[22] Environmental Sciences Research Institute. 2013. ArcGIS. California, USA. [ Links ]
[23] Law, A. & Kelton, D.W. 2000. Output data analysis for a single system. Simulation modeling and analysis. In: Simulation modeling and analysis, 3rd edition. McGraw-Hill, pp. 496-552. [ Links ]
[24] IBM Corporation. 2013. IBM SPSS. New York, USA. [ Links ]
[25] Savas, E. 1968. Simulation and cost-effectiveness analysis of New York's emergency ambulance service. Management Science, 18(12), pp. B608-B627. [ Links ]
[26] Fitzsimmons, J.A. 1971. An emergency medical system simulation model. Proceedings of the 1971 Winter Simulation Conference, pp. 19-25. [ Links ]
[27] Aboueljinane, L. 2012. Reducing ambulance response time using simulation: The case of Val-De- Marne Department Emergency Medical Service. In: Laroque, C., Himmelspach, J., Pasupathy, R., Rose, O. & Uhrmacher, A.M. (eds) Proceedings of the 2012 Winter Simulation Conference, pp. 943-954. [ Links ]
[28] Berlin, G.N. & Liebman, J.C. 1974. Mathematical analysis of emergency ambulance location. Socio-Economic Planning Sciences, 8(6), pp. 323-328. [ Links ]
[29] Uyeno, D.H. & Seeberg, C. 1984. A practical methodology for ambulance location. Simulation, 1;43(2), pp. 79-87. [ Links ]
[30] Maxwell, M.S. & Henderson, S.G. 2009. Ambulance redeployment: An approximate dynamic programming approach. In: Rossetti, M.D., Hill, R.R., Johansson, B., Dunkin, A. & Ingalls, R.G. (eds) Proceedings of the 2009 Winter Simulation Conference, pp. 1850-1860. [ Links ]
[31] Goldberg, J., Dietrich, R., Chen, J.M., Mitwasi, M., Valenzuela, T. & Criss, E. 1990. A simulation model for evaluating a set of emergency vehicle base locations: Development, validation, and usage. Socio-economic Planning Sciences, 24(2), pp. 125-141. [ Links ]
* Corresponding author
1 The author was enrolled for a PhD (Emergency Medicine) degree in the Division of Emergency Medicine, University of Cape Town.

