Servicios Personalizados
Articulo
 Inglés (pdf)
 Articulo en XML
 Referencias del artículo
Indicadores

Links relacionados
-
 Citado por Google
 -
 Similares en Google
Compartir

 Permalink
South African Journal of Industrial Engineering
versión On-line ISSN 2224-7890
versión impresa ISSN 1012-277X
S. Afr. J. Ind. Eng. vol.26 no.2 Pretoria ago. 2015
GENERAL ARTICLES
An evaluation of the effectiveness of observation camera placement within the MeerKAT radio telescope project
A.M. HeynsI, 1, *; J.H. van VuurenII
IDepartment of Logistics, Stellenbosch University, South Africa 13554379@sun.ac.za
IIDepartment of Industrial Engineering Stellenbosch University, South Africa
ABSTRACT
A recent development within the MeerKAT sub-project of the Square Kilometre Array radio telescope network was the placement of a network of three observation cameras in pursuit of two specific visibility objectives. In this paper, we evaluate the effectiveness of the locations of the MeerKAT observation camera network according to a novel multi-objective geographic information systems-based facility location framework. We find that the configuration chosen and implemented by the MeerKAT decision-makers is of very high quality, although we are able to uncover slightly superior alternative placement configurations. A significant amount of time and effort could, however, have been saved in the process of choosing the appropriate camera sites, had our solutions been available to the decision-makers.
OPSOMMING
'n Onlangse ontwikkeling binne die MeerKAT deelprojek van die Vierkante Kilometer Skikking radio teleskoop netwerk was die plasing van 'n netwerk van drie waarnemingskameras volgens twee spesifieke sigbaarheidsdoelstellings. In hierdie artikel evalueer ons die doeltreffendheid van die liggings van hierdie kameranetwerk volgens 'n nuwe, veeldoelige geografiese inligtingstelsel-gebaseerde fasiliteitsplasing raamwerk. Ons vind dat die plasingskonfigurasie wat deur die MeerKAT besluitnemers gekies is, van baie hoë kwaliteit is, alhoewel ons daartoe in staat is om plasingskonfigurasies van effens hoër kwaliteit te bereken. 'n Beduidende hoeveelheid tyd en moeite kon egter gedurende die besluitnemingsproses gespaar gewees het indien ons oplossings aan die besluitnemers beskikbaar was.
1 INTRODUCTION
Facility location problems are thoroughly documented in the operations research literature [5,6,16]. In a single-objective optimisation context, the aim in such problems is, typically, to find an optimal allocation of facilities to candidate locations, in order to minimise some objective function that involves transportation costs or delivery times. Research directed towards facility placement according to terrain and environmental factors has also recently become popular [13,14,21,22,25]. The aim in our research has been to develop a generic multi-objective (MO) geographic information systems (GIS)-based facility location framework. This framework may be used to solve facility location problems in pursuit of a wide range of objectives depending on various criteria, such as terrain interference with lines of sight, solar and wind energy levels, degree of proximity, and sound propagation.
A significant portion of GIS-based facility location problems are, in fact, visibility-related and require line-of-sight analyses [1,9,14,19,24]. The MeerKAT observation camera sub-project of the Square Kilometre Array (SKA) project, which is the focus of this paper, is one such problem. The locations of three observation cameras within this project were finalised in June 2011 [15], before any of the SKA antennas had been erected. At the time of writing, only two of the sixty-four antennas had been erected, and the cameras were yet to be mounted at the selected locations; however, their foundations had already been laid and their selected locations were considered final [15,18]. In 2012, the authors were approached by an SKA systems engineer with a request to provide visual illustrations of the coverage that the cameras would provide once they were installed. These illustrations are provided in this paper, with consideration given to the antennas' predicted interference in visibility computations. We also solve the camera location problem afresh, using a newly developed generic framework to provide high-quality trade-off solutions to such location problems.
More specifically, we show in this paper how our novel MO GIS-based facility location framework could have been used to solve the MeerKAT observation camera problem with relative ease, compared with the rather tedious approach that was actually followed by the MeerKAT systems engineers. This is achieved using the popular non-dominated sorting genetic algorithm-II (NSGA-II) and a prototype of a graphical user interface (GUI) that was developed specifically for the purpose of solving MO GIS-based facility location problems. We compare the actual camera locations and their visibility results with those proposed by our framework. We also provide feedback on our research from the MeerKAT decision-maker who was in charge of selecting the final camera locations.
2 THE MEERKAT OBSERVATION CAMERA PROJECT
In this section, we describe the MeerKAT observation camera project and the processes that were actually followed to choose the final camera sites.
2.1 Problem overview
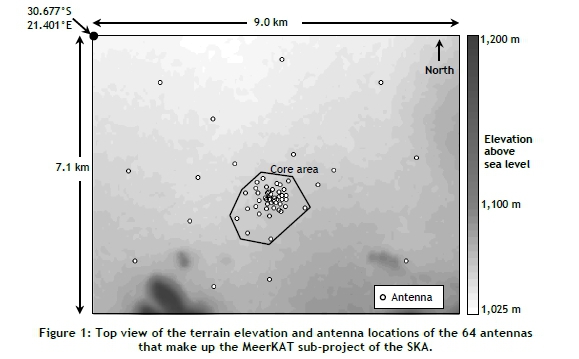
The MeerKAT observation cameras are to be used for commercial and informative display purposes, as well as for surveillance (mostly of antenna construction) [15,18]. The MeerKAT system consists of a core collection of 48 antennas that are closely clustered around a central point, together with 16 further antennas that are located outside of the core [23]. A top view of the locations of the antennas is provided in Figure 1. All the antennas peak at 19.5 metres above ground [18].
The person in charge of deciding on the final camera sites was an SKA systems engineer tasked with choosing the camera types to be used and the mechanical systems that control them. The facility location aspect of the task was to place two short-range cameras in the core area, while one long-range camera was to be placed further away, preferably at a high elevation [18]. The main purpose of the core cameras is to provide visibility coverage of the core antennas, while the purpose of the high-elevation camera is to provide coverage of all the antennas, as well as a good general overview of the MeerKAT area [15,18].
Each of the two short-range cameras has a visibility range of one kilometre and can be rotated to provide a 360-degree horizontal field of view [18]. The long-range camera has a visibility range of seven kilometres and a horizontal field of view of 140 degrees. All three cameras are mounted on structures that elevate them three metres above the terrain surface, thus providing good vantage points.
2.2 Camera site selection process
The SKA infrastructure team proposed precise camera placement coordinates for each camera to the SKA systems engineer for investigation; ultimately, these precise coordinates were used [18].
These coordinates were provided to the SKA systems engineer by the system engineering manager of the SKA, who used the viewshed tool of Google Earth Pro [8] to analyse potential sites. He related that multiple points were analysed arbitrarily within specific pre-determined regions. For the high-elevation camera, the search region was restricted to the hill in the southwest of Figure 1. Potential core camera sites were analysed within the core area shown in Figure 1. The system engineering manager's approach involved aligning the two core cameras in such a manner that a line drawn between them would cross the centrepoint of the core area, thus ensuring that the cameras would provide good visibility with respect to the core antennas when aligned to face each other [15] (this was decided on without a 360-degree rotation being taken into consideration). For all the cameras, consideration was given to terrain characteristics such as peaks, valleys, and slopes, and their influence on the suitability for camera placement, although the core area is not particularly rough. When analysing specific candidate sites, the visibility from only single points was considered, and no particular attention was given to the performance of the camera configuration in respect of visibility objectives when analysed as a network. In total, the process took nearly two days to complete [15].
The SKA systems engineer then had to visit the sites in order to decide whether they were suitable from a construction point of view (i.e., for the laying of foundations), and whether their practical visibility capabilities were indeed as good as the preliminary analysis suggested. The systems engineer also had to take into account that the cameras would be elevated, and proposed an appropriate elevation height. No visibility performance measures, such as the terrain surface area or the number of antennas visible to the cameras either individually or as a network, were provided to aid in the process. With regard to the physical suitability of the investigated regions, the appropriateness of the physical terrain for the laying of foundations was also evaluated. The SKA systems engineer recalled that his site visit and associated evaluation process took quite long: 14 hours in total of driving from Cape Town to Carnarvon and back (since then, a three-hour direct return flight has become available), in addition to considerable physical activity, which amounted to roughly an entire day's work. In the end, the sites initially proposed by the SKA infrastructure team were indeed selected for implementation.
Although no specific visibility objectives were communicated to the SKA systems engineer, the two that he mainly considered were 1) to maximise the number of antennas visible to the network, and 2) to maximise the visible terrain surface area. It was not entirely possible to evaluate the extent to which the first objective was achieved by the camera locations, since none of the antennas had been erected at the time, although their future locations were known. With respect to the high-elevation camera, the SKA systems engineer aimed to direct the centre of its field of view towards the centre of the core area [18].
2.3 Visibility results for the selected camera locations
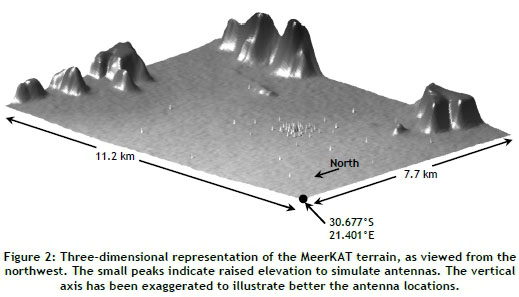
We have evaluated the suitability of the actual camera site locations by performing a visibility analysis of these sites. To simulate visibility interference caused by the antennas, terrain elevation was raised 19.5 metres at each antenna's location. A three-dimensional representation of the terrain used for visibility computations is provided in Figure 2, with the raised elevations at antenna locations clearly visible.
Antenna visibility was calculated to the peak of each antenna, thus ensuring at least partial visibility of an antenna from the peak downwards, if the peak is visible. Terrain surface visibility was determined within a boundary that surrounds the 64 antennas, as indicated in the visibility results of the actual network shown in Figure 3. In our visibility computations, terrain elevation is presented as a grid of gridposts that are spaced equally along longitude and latitude (Heyns & van Vuuren [9] provide a more detailed explanation of this type of terrain representation and the related visibility computations). Terrain surface visibility is then measured as the percentage of gridposts in the designated area that are visible from a specific location or a network of locations.
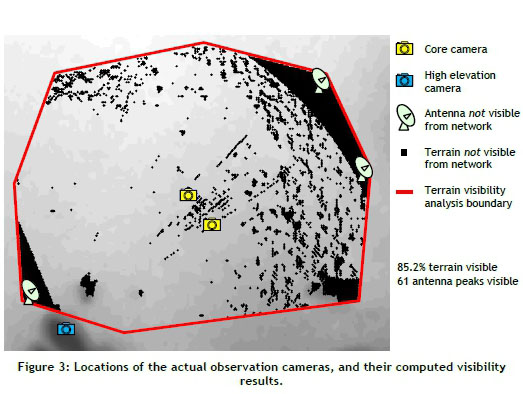
Our computations revealed that the proposed network of camera locations will be able to observe 61 of the 64 antennas' peaks. A visibility percentage of 85.2 per cent is achieved with respect to the terrain surface within the boundary area. The two invisible antennas in the northeast lie outside the visible range of the cameras (an invisibility arc shadow at 7 km is clearly visible from the high-elevation camera). The invisible antenna in the southwest is outside of the core cameras' visible ranges and outside of the high-elevation camera's field of view. The 'shadow lines' that are visible in the core region, radiating in a north-easterly direction, are sections of terrain that are invisible from the high-elevation camera, due to antenna interference.
3 OUR MULTI-OBJECTIVE GIS-BASED FACILITY LOCATION FRAMEWORK
Our MO GIS-based facility location framework consists of three phases: 1) a pre-optimisation analysis, 2) an optimisation process proper, and 3) a post-optimisation analysis. We describe this framework very briefly in this section, but Heyns & van Vuuren [11] provide a comprehensive overview of the framework.
The pre-optimisation phase entails the following:
1. A formal problem description in which the objectives and constraints of the project are identified, in addition to a description of the facilities to be placed and a specification of the terrain and environmental factors that have to be taken into account during facility placement decisions.
2. The population of facility and GIS databases. This includes obtaining GIS data from sources such as the internet or governmental research repositories. This GIS data may be analysed further and manipulated for problem-specific purposes.
3. The mathematical formulation of the optimisation objectives and associated constraints, for use by solution search methodologies.
The optimisation phase includes the implementation of optimisation algorithms from the operations research literature that have been modified to function optimally in the context of MO GIS-based facility location problems. Our framework includes modified versions of the NSGA-II [4,26] and the method of Tabu Search [7]. For the purposes of this study, only the NSGA-II was considered. (See Appendix A for a description of how the NSGA-II and solution combination representation was used in the context of our problem.) Of all the solutions evaluated by the algorithm, the ones that are desirable (i.e., ones for which no other known solutions achieve improvement on all the placement objectives) are called the 'non-dominated' solutions, and are included in the so-called 'Pareto-optimal front' [10,11,17]. The non-dominated solutions have the property of being at least as good as the other 'dominated' solutions with respect to all the objectives, and better than each dominated solution in at least one objective [17].
Post-optimisation operations entail presenting representative solutions from the Pareto-front to a decision-maker, by facilitating the de-clustering of similar solutions (using proximity- and Pareto-based techniques) [3,20].
Two prototype GUIs are supplementary tools for use in conjunction with the general framework described above. One optimisation GUI may be used to load the data populated during the pre-optimisation phase and to solve the problem according to a selected set of objectives, constraints, and parameters that are entered by the user. The other, a post-optimisation GUI, may be used to display the solutions to a decision-maker and to facilitate the de-clustering of solutions, as mentioned above.
4 SOLVING THE PROBLEM USING OUR FRAMEWORK
The formal problem description aspect of the pre-optimisation phase of our framework, which was presented in Section 3, may be found in Sections 2.1-2.3. (A formal mathematical model formulation is provided in Appendix B.) The following placement constraints are added to this description:
1. Only one camera may be placed at a specific gridpost.
2. A camera may not be located at the same gridpost as an antenna.
3. The slope of terrain surface that may be considered for camera placement should not exceed 10 degrees.
To correspond with the visibility results of the actual network provided in Section 2.3, we solved the problem in the context of two conflicting objectives: 1) to maximise the number of antenna peaks visible from the network of cameras, and 2) to maximise the terrain surface visible from the network, within the boundary introduced in Figure 3.
Two search zones were identified for this study. The core search zone is the zone around the core antennas earmarked for the placement of the two short-range cameras, and is illustrated in Figure 4. The high-elevation search zone is the zone outside of the core camera search zone earmarked for the placement of the high-elevation camera. These two search zones are disjoint. In addition to the hill where the high-elevation camera is to be located, the high-elevation search zone was selected to include higher-lying areas located to the east and southeast of the antennas, as may be seen in the illustration of the search zones in Figure 4. These hills were not originally considered for placement by the decision-makers because of proximity concerns, but we included these possibilities in a bid to ascertain whether our framework would propose any interesting solutions involving placements in these regions. Terrain where the surface slope exceeded ten degrees was removed from the search zones (only affecting the high-elevation search zone) because areas of excessive slope lead to accessibility and construction complications. The slope of the terrain was determined using the popular ArcGIS 10.2 software suite [2]. The areas removed due to excessive slope are visible in Figure 4, recognisable as the white areas around the higher-lying areas in the high-elevation search zone. The high-elevation search zone was selected to include lower-lying areas for two reasons:

1. The removal of lower-lying areas may result in the exclusion of alternatives that perform well with respect to some visibility objective. Such exclusion may reduce the alternatives (both in terms of solution quality and diversity of camera site locations) presented to the decision-maker.
2. If the search zone were reduced by excluding lower-lying areas, additional GIS-based operations and a motivation of the reasons for the selection of certain areas would be required. It is also expected that the algorithms should automatically identify higher-lying areas as candidate site locations if they are indeed included in the best solutions, while simultaneously omitting lower-lying alternatives.
There are 1,545 feasible sites in the core search zone and 97,268 in the high-elevation search zone. Therefore, there are 1,160 x 109 possible camera layout combinations, which is an impractical number to evaluate exhaustively. Visibility of each feasible site with respect to the designated area of interest was pre-computed, and the visibility results of the sites in the core search zone were sufficiently small to store in memory for fast lookup purposes during the optimisation phase. The core search zone visibility computations required a total of 39 seconds, at an average of 0.025 seconds per site. In contrast, the high-elevation search zone's visibility results were much larger in size, due to the large number of candidate sites and the increased visibility range of the camera to be placed in this zone, so that direct use of memory was not possible during computations. Instead, the results were written to binary files for lookup purposes during the optimisation process. These visibility computations and file writes required a total of seven hours and 18 minutes, at an average of 0.27 seconds per site. All computations reported in this paper were carried out on an Intel Core i7-4770 CPU, using one of eight 3.40 GHz cores and 8 GB RAM operating in 64-bit Ubuntu 12.04 LTS.
The acquisition of the necessary data, GIS-based analyses (including visibility), and data formatting for appropriate use within our framework took roughly two days.
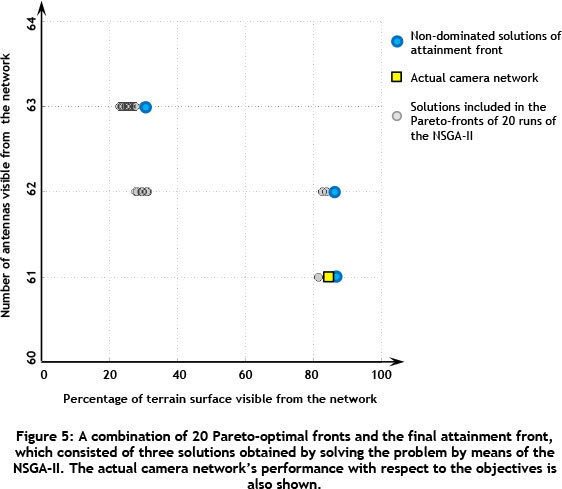
For statistical and empirical reliability, it is standard practice for an optimisation process to comprise multiple runs of the relevant metaheuristic [17]. For our purposes, 20 runs of the NSGA-II were deemed sufficient. The Pareto-optimal fronts of non-dominated solutions of the 20 runs were combined and a final attainment front was identified from these, as illustrated in Figure 5. Since the attainment front contains only three non-dominated solutions, no post-optimisation de-clustering was required. The performance of the actual network with respect to the objectives is also indicated in the figure. The 20 runs took one hour and 21 minutes to complete, at an average of four minutes and three seconds per run. A multi-resolution approach, which forms part of our solution approach and involves solving the problem at different resolution levels, was used in a bid to reduce the overall computation times, while not compromising on solution quality (as explained in detail by Heyns & van Vuuren [10]).
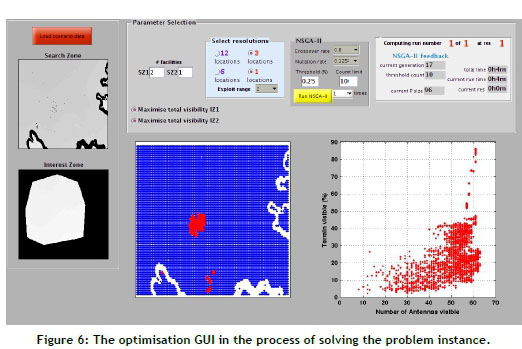
A screenshot of the optimisaton GUI prototype in the process of solving this problem instance is provided in Figure 6. The interested reader is referred to a 4 Mb, 53 second (accelerated) video by Heyns [12] of the optimisation GUI loading the data required for our study, in addition to parameter selection and a single run of the NSGA-II.
5 COMPARISON OF ACTUAL AND PROPOSED CAMERA LOCATIONS
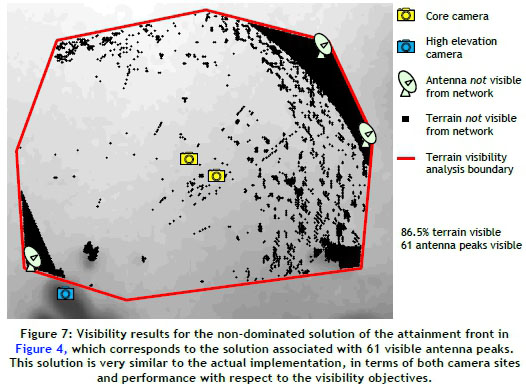
The non-dominated solutions obtained by 20 runs of the NSGA-II provide interesting alternatives. A striking result is that the actual camera coordinates proposed by the infrastructure team and verified by the SKA systems engineer (previously shown in Figure 3) are remarkably similar to the non-dominated solution returned by the NSGA-II, which provides visibility to 61 antennas, as illustrated in Figure 7, in terms of both camera locations and performance with respect to the visibility objectives. The actual high-elevation camera is located just 31 metres (one gridpost) north of the one found in the non-dominated solution in Figure 7, while the core cameras are also very similarly placed. Whereas the number of visible antenna peaks is the same for both placements, the non-dominated solution achieves 1.3 per cent more visible terrain (86.5% compared to 85.2%). It may therefore be concluded that the actual camera network is a very effective solution, and its choice, without any software assistance, is impressive (a conclusion that the MeerKAT team is very pleased with in retrospect).
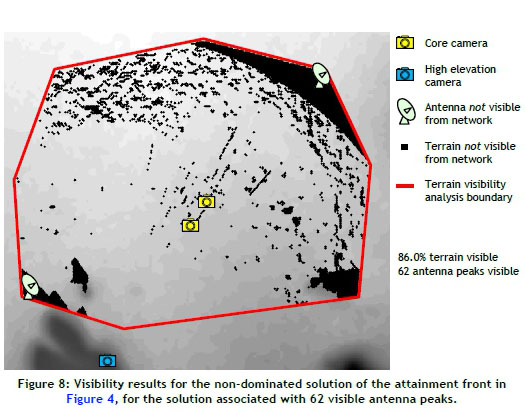
An interesting alternative to the actual camera sites and those proposed by the non-dominated solution discussed above is one where the high-elevation camera is located 1,029 metres to the southeast of its actual location, in addition to a slightly different orientation of core cameras. This alternative provides visibility to 62 antennas, while 86.0 per cent of terrain is visible, as shown in Figure 8. Compared with the actual network, this solution provides slightly better results with respect to both objectives (therefore strongly dominating the actual camera network locations) without requiring much distance between actual and proposed camera locations.
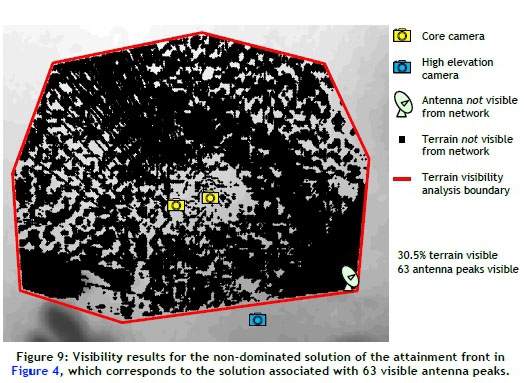
The final of the three non-dominated solutions, which is remarkably different from the actual network and the two previously-discussed non-dominated solutions, is shown in Figure 9. In this solution, the high-elevation camera is located in a low-lying region (albeit at a higher location than the terrain in the area of interest due to the terrain sloping upwards towards the south). It is interesting that this solution provides the best visibility with respect to the number of visible antenna peaks: 63 in total. This is attributed to the fact that visibility was only computed in respect of the peaks of the antennas, and that all the antennas lie within the visibility range of the long-range camera. It may be concluded with high confidence that very few of the antennas will be significantly visible from the cameras in this solution, especially since only 30.5 per cent of the terrain surface is visible.
6 FEEDBACK FROM THE DECISION-MAKERS
The visibility results of the actual camera network and the non-dominated solutions discussed in the previous section were presented to the SKA systems engineer, whose feedback was sought.
The SKA systems engineer reported that he would have used such a decision-making tool had it been available to him. Furthermore, if the results that were returned by the framework had been available to him during his decision-making process, he would definitely have considered the solutions proposed in Figures 7 and 8. He mentioned that the solution in Figure 9 is very poor from a practical point of view [18], and that even if the results had been provided to him as solution alternatives before deciding where to place the cameras, he would still have had to perform a physical site inspection. The purpose of such a site visit would be to ensure that the locations are suitable to lay foundations and to gain practical confidence in the anticipated visibility capabilities, in the form of a practical visual assessment (performed subjectively). It was further agreed that, by having the proposed results at hand and presented in the manner shown in this paper, the final site selection would have been significantly faster than the actual process that was followed. The reason for this acceleration is that the systems engineer would have limited his practical search region to the proposed sites and the regions in their close proximity, instead of considering the larger, more arbitrary regions that he actually did consider [18].
The SKA systems engineer was impressed by the speed at which the solutions were computed by the framework, as well as the practical displays of the visibility results in order to support a decision-making process. Additionally, the modularity of the research was considered particularly impressive in terms of the wide range of GIS-related facility location problems for which the framework may be used [18]. In relation to previous MeerKAT projects, he felt that the framework could have been implemented to aid in finding the optimal locations for three weather stations used by the project. He also mentioned that the framework could possibly aid in a future observation camera location problem for the larger SKA project [18]. Following this discussion, the authors have indeed been approached by the lead system engineer (infrastructure and power) of the SKA with a request to investigate the possibility of using the framework to solve this problem.
7 CONCLUSION
In this paper we considered the facility location problem related to the placement of a network of three observation cameras as part of the MeerKAT sub-project of the large SKA project currently underway near Carnarvon in South Africa. We used a novel MO GIS-based facility location framework to compute high-quality trade-off solutions for this facility location problem, and compared the results thus obtained with the actual sites that were selected by SKA systems engineers. The suitability of the actual camera sites compared very favourably with our solutions, although we obtained solutions that (very slightly) outperform the actual configuration with respect to the two visibility objectives: 1) to maximise the number of antennas visible to the network, and 2) to maximise the visible terrain surface area. Two of these superior solutions would require small physical perturbations of the actual camera locations, while a third solution was considered rather impractical.
Whereas the actual camera sites were selected without consideration of possible interference of SKA antennas in respect of visibility computations, an advantage of our research is the ability to evaluate placement solutions before the construction of any physical structures that may affect facility performance with respect to the visibility objectives. This advantage follows from including the estimated heights of the SKA antennas in the visibility analyses.
Feedback on our research by the decision-maker tasked with finalising the camera sites was positive, and has led to the possibility of further collaboration in respect of SKA facility location sub-projects.
ACKNOWLEDGEMENTS
The financial assistance of the Armaments Corporation of South Africa (ARMSCOR) and the South African National Research Foundation (NRF) towards this research is hereby acknowledged. Opinions expressed and conclusions arrived at are those of the authors and are not necessarily to be attributed to ARMSCOR or the NRF. Finally, we thank Mr Thomas Kusel and Mr Caxton Magazore of the SKA for the valuable contribution they made to the writing of this paper.
REFERENCES
[1] Agarwal, P.K., Bereg, S., Daescu, O., Kaplan, H., Ntafos, S., Shrir, M. & Zhu, B. 2005. Guarding a terrain by two cameras. Proceedings of the Twenty-First Annual Symposium on Computational Geometry, pp. 346-355. [ Links ]
[2] ArcGIS. 2015. Retrieved from http://www.arcgis.com. Accessed on 11 February 2015. [ Links ]
[3] Chaudhari, P.M., Dharaskar, P.V. & Thakare, V.M. 2010. Computing the most significant solution from Pareto front obtained in multi-objective evolutionary. International Journal of Advanced Computer Science and Applications, 1(4), pp. 63-68. [ Links ]
[4] Deb, K., Pratap, A., Agarwal, S. & Meyarivan, T. 2002. A fast and elitist multi-objective genetic algorithm: NSGA-II. IEEE Transactions on Evolutionary Computation, 6(2), pp. 182-197. [ Links ]
[5] Dresner, Z. 2012. Facility location: A survey of applications and methods. New York: Springer. [ Links ]
[6] Farahani, R.Z., SteadieSeifi M. & Asgari, N. 2010. Multiple criteria facility location problems: A survey. Applied Mathematical Modelling, 49(7), pp. 1689-1709. [ Links ]
[7] Glover, F.W. & Laguna, M. 1998. Tabu search. Volume 1, Norwell: Kluwer Academic Publishers. [ Links ]
[8] Google Earth. 2015. Retrieved from http://www.google.com/earth. Accessed on 11 February 2015. [ Links ]
[9] Heyns, A.M. & van Vuuren, J.H. 2013. Terrain visibility-dependent facility location through fast dynamic step-distance viewshed estimation within a raster environment. Proceedings of the 2013 Annual Conference of the Operations Research Society of South Africa, pp. 112-121. [ Links ]
[10] Heyns, A.M. & van Vuuren, J.H. 2015. A multi-resolution approach towards discrete multi- objective GIS-based facility location. Computers, Environment and Urban Systems, Submitted. [ Links ]
[11] Heyns, A.M. & van Vuuren, J.H. 2015. Multi-objective optimisation of discrete GIS-based facility location problems. Optimization and Engineering, Submitted. [ Links ]
[12] Heyns, A.M. 2015. MO GIS-based facility location GUI demonstration video. OGV file. Retrieved from http://www.vuuren.co.za/photos/LOCVideo.ogv [ Links ]
[13] Kiani Sadra, M., Nassiri P., Hosseini, M., Monavari, M. & Gharagozlou, A. 2014. Assessment of land use compatibility and noise pollution at Imam Khomeini International Airport. Journal of Air Transport Management, 34, pp. 49-56. [ Links ]
[14] Kim, Y., Rana, S. & Wise, S. 2004. Exploring multiple viewshed analysis using terrain features and optimisation techniques. Computers and Geosciences, 30(9-10), pp. 1019-1032. [ Links ]
[15] Kusel, T. 2015. System Engineering Manager, SKA SA [personal communication]. [ Links ]
[16] Klose, A. & Drexl, A. 2005. Facility location models for distribution system design. European Journal of Operational Research, 162(1), pp. 4-29. [ Links ]
[17] Knowles, J.D., Thiele, L. & Zitler, E. 2006. A tutorial on the performance assessment of stochastic multiobjective optimizers. TIK Report 214, Computer Engineering and Networks Laboratory (TIK), ETH Zurich. [ Links ]
[18] Magazore, C. 2015. Systems Engineer, SKA SA [personal communication]. [ Links ]
[19] Nagy, G. 1994. Terrain visibility. Computers and Graphics, 18, pp. 763-773. [ Links ]
[20] Puzicha, J., Hofmann, T. & Buhmann, J.M. 1999. A theory of proximity based clustering: Structure detection by optimization. Pattern Recognition, 33, pp. 617-634. [ Links ]
[21] Sanchez-Lozano, J.M., Teruel-Solano, J., Soto-Elvira, P.L. & Socorro Garcia-Cascales, M. 2013. Geographical Information Systems (GIS) and Multi-Criteria Decision Making (MCDM) methods for the evaluation of solar farms locations: Case study in south-eastern Spain. Renewable and Sustainable Energy Reviews, 24, pp. 544-556. [ Links ]
[22] Serrano-González, J., Burgos-Payàn, M. & González-Longatt, F. 2013. A review and recent developments in the optimal wind-turbine micro-siting problem. Renewable and Sustainable Energy Reviews, 30, pp. 133-144. [ Links ]
[23] Square Kilometre Array Africa. 2015. Retrieved from http://www.ska.ac.za. Accessed on 11 February 2015. [ Links ]
[24] Tabik, S., Zapata, E.L. & Romero, L.F. 2013. Simultaneous computation of total viewshed on large high resolution grids. International Journal of Geographical Information Science, 27(4), pp. 804-814. [ Links ]
[25] Uyan, M. 2013. GIS-based solar farms site selection using Analytic Hierarchy Process (AHP) in Karapinar region, Konya/Turkey. Renewable and Sustainable Energy Reviews, 28, pp. 11-17. [ Links ]
[26] Zitzler, E., Deb, K. & Thiele, L. 2000. Comparison of multiobjective evolutionary algorithms: Empirical results. Evolutionary Computation, 8(2), pp. 173-195. [ Links ]
* Corresponding author
1 Author is enrolled for a PhD (Operations Research) at Stellenbosch University
APPENDIX A: ALGORITHMIC SOLUTION PROCESS
The purpose of this appendix is to provide a brief description of the solution process of the NSGA-II, followed by examples of candidate solution representations and modification operations as performed by the NSGA-II in the context of our problem.
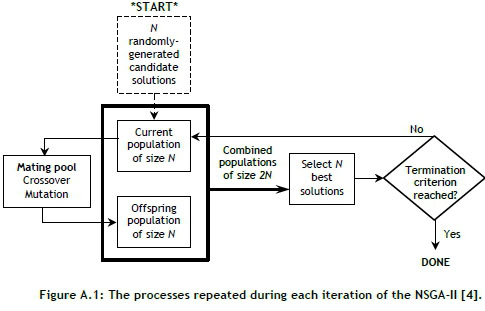
Figure A.1 contains a graphical illustration of the NSGA-II solution process. Initially, the NSGA-II stochastically generates a population of candidate solutions of size N. This population is called the 'current' population, and from this population a number of solutions are selected stochastically and entered into a 'mating pool'. The solutions in the mating pool undergo 'crossover' and 'mutation' operations in order to generate new solutions that proceed to the 'offspring population'. The combined current and offspring populations are evaluated and the N best solutions from the combined populations are selected to continue as the new current population. The process is repeated until some termination criterion is reached; this generally depends on a fixed maximum iteration counter or, alternatively, is measured according to the rate of convergence of solution quality. More detailed descriptions of the above-mentioned processes are provided by Deb et al. [4].
The representation of candidate solutions and the crossover and mutation operations of the NSGA-II are illustrated in Figure A.2. For our problem, a candidate solution combination comprises three site locations, and the string representation of these sites is called a 'chromosome'. The first two sites in the chromosome are two candidate sites for short-range camera placement within the core search zone, while the third site is a candidate site for the placement of a long-range camera within the high-elevation search zone. In order to generate offspring solutions, the NSGA-II performs 'crossover' and 'mutation' operations on candidate solutions from the mating pool.
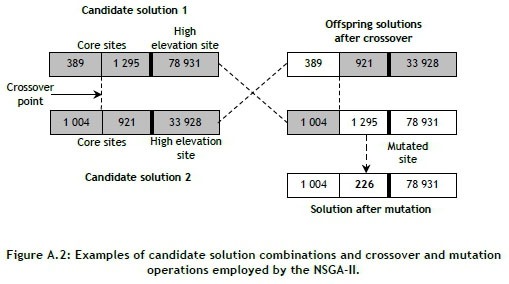
An example of crossover between two solutions and their resulting offspring solutions is also provided in the Figure A.2. A 'crossover point' is selected (in our implementation the point was selected randomly from the two points separating the three sites), the two strings are cut at this point, and the heads and tails of these strings are exchanged. The crossover operator explores new solution combinations, but does not alter the constituent sites of solutions. The crossover operator is particularly effective, since the solutions that are selected to undergo the procedure are typically chosen from those that perform well with respect to the objective functions. Therefore the offspring solutions inherit some of the strong properties of their 'parents', while simultaneously exploring new solution combinations.
Mutation is introduced after the crossover stage in order to promote solution diversity in the sense of introducing new sites into the site combinations of solutions (as opposed to the crossover operator merely exchanging these locations from an existing collection of sites in the entire set of candidate solutions). This is achieved by randomly selecting a site from the chromosome and replacing it with a randomly-selected site from the search zone associated with the site to be replaced.
Not all parent solutions selected from the mating pool undergo crossover or mutation. The operations are performed subject to crossover and mutation probabilities. The interested reader is referred to [4,17,26] for more detailed information about the solution process of the NSGA-II and similar algorithms.
APPENDIX B - MATHEMATICAL MODEL FORMULATION
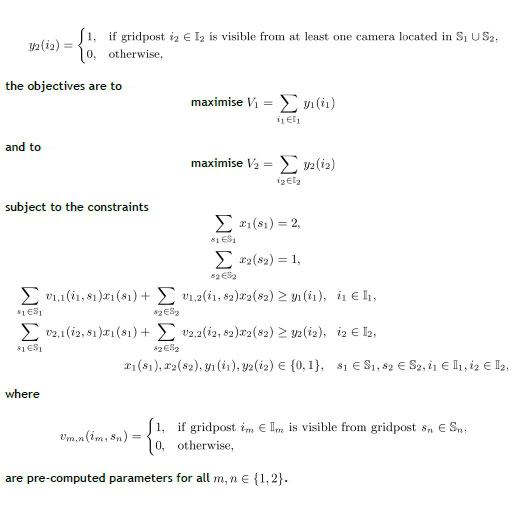
Denote the set of candidate site locations within the core search zone by S1, and denote the set of candidate site locations in the high-elevation search zone by S2· Furthermore, define the binary decision variables

and
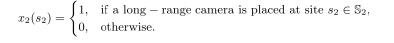
Denote the set of gridposts at which antennas are located by I1and denote the set of terrain surface gridposts requiring observation by I2.Upon defining the auxiliary variables