


Serviços Personalizados
Artigo
 Inglês (pdf)
 Artigo em XML
 Referências do artigo
Indicadores

Links relacionados
-
 Citado por Google
 -
 Similares em Google
Compartilhar

 Permalink
South African Journal of Industrial Engineering
versão On-line ISSN 2224-7890
versão impressa ISSN 1012-277X
S. Afr. J. Ind. Eng. vol.26 no.1 Pretoria Mai. 2015
CASE STUDIES
Assignment of stock keeping units to parallel unidirectional picking
J. Matthews; S.E. Visagie
Department of Logistics University of Stellenbosch, South Africa. jmatthews@sun.ac.za, svisagie@sun.ac.za
ABSTRACT
An order picking system consisting of a number of parallel unidirectional picking lines is investigated. Stock keeping units (SKUs) that are grouped by product type into distributions (DBNs) are assigned daily to available picking lines. A mathematical programming formulation and its relaxations is presented. A greedy insertion and a greedy phased insertion are further introduced to obtain feasible results within usable computation times for all test cases. The walking distance of the pickers was shown to decrease by about 22 per cent compared with the current assignment approach. However, product handling and operational risk increases.
OPSOMMING
'n Stelsel vir die samestelling van bestellings wat uit 'n aantal parallelle, eenrigting uitsoeklyne bestaan, word ondersoek. Voorraadeenhede wat in distribusies gegroepeer word, word op 'n daaglikse basis in opmaaklyne toegewys. 'n Wiskundige programmeringsformulering en verslappings daarvan word aangebied. 'n Gulsige invoegings-en 'n gefaseerde gulsige invoegingsheuristiek word voorgestel om die probleem in 'n prakties uitvoerbare tyd op te los vir alle toetsgevalle. Die stapafstand van die werkers wat bestellings opmaak kon met ongeveer 22 persent verbeter word in vergelyking met die huidige benadering, maar daar was 'n toename in produkhantering en operasionele risiko.
1 INTRODUCTION
Order picking is the process of retrieving products from storage (or buffer areas) in response to a specific customer request [22]. It is estimated that the cost of order picking can be more than 55 per cent of all warehousing costs, and can become the bottleneck in a supply chain due to its labour intensive nature [4]. Optimising the order pick operation therefore has the potential to improve overall supply chain efficiency, as well as to reduce costs.
The order picking system used in a distribution centre (DC) operated by PEP Stores Ltd (PEP) is investigated in this paper. PEP is the largest single brand retailer in Southern Africa [20]. PEP mainly sells apparel that is distributed from three DCs located on the west coast (Cape Town), east coast (Durban), and mainland (Johannesburg), and services more than 1,500 retail outlets across Southern Africa. All three DCs have structural differences, but perform order picking using the same fundamental picking system. The DC on the east coast has the highest throughput - as most of the suppliers are situated in Asia - and therefore forms the focus of this paper. However, the models presented in this paper could equally be applied to the other two DCs.
Due to the nature of the market and the physical characteristics of the apparel (size and shape), a large proportion of PEP's picking is piece-picking, where individual units of stock are handled by pickers. The DC is designed to handle both carton and piece picking, but the piece-picking operation forms the largest proportion in the DC and is the focus of the study. In the remainder of this paper, the term 'order picking' will refer to the 'piece picking' operation.
The DC uses a unique variation of a forward pick area - described by Bartholdi and Hackman [2] - consisting of unidirectional picking lines. This system has evolved to manage the large number of different stock keeping units (SKUs) sold annually by PEP (in excess of 40,000). Each picking line has 56 locations with the capacity to hold five pallets of the same SKU. These picking lines are managed in waves of picking (sets of SKUs placed in a picking line and picked together in a single operation) that are independent of all other SKUs not on that picking line. There are also enough pickers available so that picking lines can be operated in parallel. Once all the store requirements for all the SKUs in a wave have been picked, the excess stock (if any) is removed, and all the locations in the picking line become available for a new wave of picking.
Orders - typically defined as all stock requirements for a store across the entire DC - are defined for each specific wave of picking. An order is thus defined by the store requirements for SKUs in a specific wave. In this way, each store may have multiple orders associated with it at any given time, each one associated with a different wave. This segmentation of orders is possible because there are frequent shipments of stock to each store (at least weekly).
Figure 1 shows the general layout of the picking line area. There are six picking lines on either side of a main conveyor. The main conveyor is elevated, and the smaller picking line conveyors rise to create a bridge, allowing pickers to circumvent the picking line completely by walking under the bridge. Figure 2 illustrates a functioning picking line with pickers walking around the conveyor belt picking orders. While picking, pickers interact via a headset to a voice recognition system (VRS) that directs them in a clockwise direction around the picking line. The VRS tracks the location of the last pick made by a picker, and so always directs the picker to the nearest required SKU for the active order. Once an order has been completed, a new order will be assigned to the picker independent of the position or number of other pickers in the picking line. The VRS can therefore assign or remove pickers at any time between the completion of an old order and the assignment of a new one.

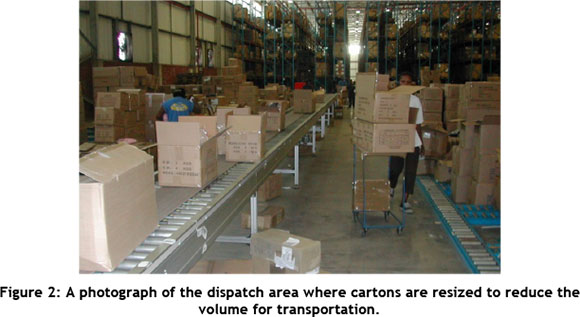
Figure 3 shows a typical location populated with stock. In some cases, SKUs may require more space to accommodate all the stock. Management then either uses the floor space behind the location, or uses additional adjacent locations to store this excess stock. Due to the level of safety stock at each location, stock outs rarely occur during a wave of picking, as all the stock required for all the orders associated with that wave are known and may be stored on the line before picking starts.

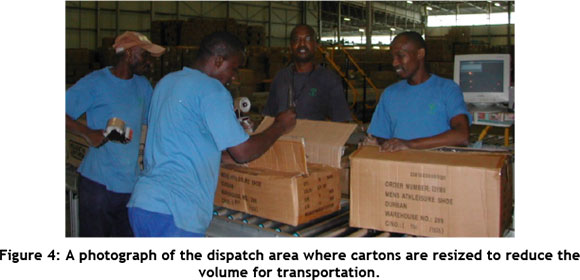
Pickers do not use totes, but instead pack items directly into cartons, as shown in Figure 2. This reduces material handling, as waves are picked independently, allowing for the cartons to be shipped as-is. The DC also reuses the cartons that held the bulk stock received from suppliers; these cartons become available as picking takes place, thus reducing packaging costs. Pickers place unique bar code stickers on each carton, and may be required to use multiple cartons for a single order, depending on the number and size of the SKUs in that order. Once an order has been completed or a carton is full, it is placed on the conveyor belt that conveys the carton to the dispatch area via the main conveyor. Each carton holds stock from a single picking line only, and thus may have excess capacity, as neither the cartons used by the pickers nor the volume of stock required by a store from a line are uniform. Cartons are therefore resized, if necessary, before being stapled at the dispatch area, as shown in Figure 4.
Before a SKU can be assigned to a wave, its picking instructions must be released by the Central Planning Department at the central office. The Planning Department calculates the store requirements and assigns an out-of-DC date to it. To achieve this, SKUs of the same product type, but of different sizes, are grouped together as a distribution (DBN) and are planned collectively.
At the start of each day, the DC schedules the available DBNs for processing for that day, based on the out-of-DC date, the number of available picking lines, and the location of the physical stock in the DC. Once the DBNs have been scheduled, all SKUs in the same DBN are placed in the same wave, and therefore on the same picking line. PEP forces DBNs to be placed on the same picking line to ensure that all the SKUs for a DBN will arrive at a store on the same day. This enables the store to pack out all the sizes of a product type on the shelves in one batch.
The picking line area considered here may be described as a synchronised zone picking system (described by de Koster et al. [4]) as each picking line runs independently of, and in parallel to, the other. The pickers assigned to a picking line may join any other picking line when a wave of picking is completed, because the picking lines run independently. In this way, the challenge of empty capacity in a single picking line (zone) due to work imbalance between picking lines (zones) is not a major problem, as is typically the case in zone picking systems [2]. However, some balancing is required, as too many pickers on a single line cause congestion, and there are a limited number of forklifts available to build picking lines [7]. This balancing revolves around the rate at which picking lines are picked and the rate at which new picking lines are built, and therefore falls beyond the scope of this study.
The focus of this paper is on the assignment of already-scheduled DBNs into specific waves for a given day while minimising the total walking distance of pickers in the picking lines. The remainder of this paper is structured as follows: A brief discussion of related work in the literature is given in Section 2, followed by a more detailed exposition of the problem and solution approaches in Section 3. The results are discussed in Section 4, and the paper is concluded in Section 5.
2 LITERATURE REVIEW
A picking line is similar to carousel systems due to the cyclical paths that pickers walk. A carousel is an automated storage and retrieval system, and typically consists of a number of shelves that rotate to present required stock to a stationary picker [12]. Hassini [8] has composed an extensive literature review on both the applications and the generalisations of carousel systems. He discusses multiple carousel configurations with reference to both the order sequencing and the storage locating problems. He mentions that, in almost all cases, SKUs have been assumed to have independent demand, and that storage policies for demand-correlated SKUs have received little attention. He further suggests that demand-correlations between SKUs may play a role in both the location of SKUs in carousels and the carousel to which the SKU is assigned in a multi-carousel case.
Litvak & Maia [12] expand on carousel systems with multiple carousels, and discuss several configurations. In most cases, the problem statement consisted of multiple carousels and a single picker. Emerson & Schmatz [5] considered a carousel configuration consisting of 22 carousels, where each pair of carousels has its own picker (11 pickers in total). They used simulations to test three storage schemes: a random storage scheme, a sequential alternating storage scheme, and a scheme that stores SKUs in the carousel with the largest number of openings. Moreover, the effects of a floating operator who moved between pairs of carousels were included in the simulation. Litvak & Maia [12] noted that Emerson & Schmatz [5] neither addressed the problem of optimally assigning items to carousel bins, nor discussed any analytical results.
In all cases, carousels are modelled with the assumption that demand is stochastic, with the probability of an order requiring a SKU used as a measure of demand. The deterministic nature of the orders in picking lines considered in this paper therefore limits the direct use of the carousel approaches found in the literature.
Having multiple picking lines, PEP's order picking system also resembles a zone-based system. SKU assignment in zone-based order picking has received some attention, but zone-based order picking designs often differ significantly. Jane & Laih [10] considered the assignment of SKUs to locations in a warehouse using a synchronised pick-by-light zone picking system. Here an order is simultaneously picked in each zone, and only once the order has been completed in all zones can a new order begin. Therefore the time required to complete an order is equal to the maximum time required to pick all the SKUs from one of the zones. Due to this zone structure, the objective of the SKU assignment was to balance the workload between zones by reducing the maximum pick time in each zone. To achieve this, Jane & Laih [10] used a similarity measure between SKUs (calculated as the number of orders that require both SKUs) in conjunction with a natural clustering approach to minimise the similarity of SKUs within zones. By minimising the similarity within zones, the amount of work required for orders is spread more evenly over all zones.
Garfinkel [6] focused on minimising the number of zones visited (both sequential and synchronised zones) when picking all orders by assigning SKUs to storage locations. Walking distance is normally minimised, but it was suggested that minimising the number of zones visited is beneficial when orders require few SKUs, batching is not desirable, and sorting is expensive.
Chian et al. [3] used data mining techniques to create similarity measures between SKUs for use in a storage assignment model. The model was applied to a DC with an S-shape picking strategy within parallel aisles. Both complementary and substitutable relationships2 between SKUs were calculated. Using these relationships, an association index was developed between every available storage location and the new SKUs. A generalised assignment model, which was shown to reduce the number of aisles over which orders were required to pick and therefore the total picking time, was then used to assign the SKUs.
Pan & Wu [18] considered the storage assignment problem for a single aisle pick-and-pass picking line. Markov chains were used to estimate the walking distances of pickers based on the probability that SKUs are requested by the same order. Storage assignments to single-sized, multiple equal-sized, and multiple different-sized zones were considered. Three optimal storage assignment policies were proposed, taking into account the total distance travelled as well as the balance of work between zones. Both the dependence of pickers on each other and the physical layout of the linear zones limit the use of these approaches on picking lines.
Although picking lines may be seen as different zones, an order is defined for a single wave of picking only. Pickers can also freely switch between picking lines that run in parallel. Approaches that seek to manage the spread of orders across zones, by either balancing or minimising the spread, are not suited to the picking line system investigated in this paper.
There has also been some attention given to the assignment of SKUs to non-zoned order picking systems. Accorsi et al. [1] simultaneously considered both the storage allocation (inventory levels for each SKU) and the storage assignment (location of the SKU in the DC) problems. Using a case study with forward and reserve areas, they extensively compared combinations of different forward storage allocation strategies, storage assignment rules, SKU clustering algorithms, percentile threshold cut-offs for SKU similarity, and picker routing policies. Relevant combinations were tested and compared, based on the travel distances of picking and restocking and the total cost of restocking. The results demonstrated that the issues related to allocation and assignment are correlated, and both should be taken into account when designing and managing an order pick system.
Although Accorsi et al. [1] suggest considering both SKU allocation and SKU assignment simultaneously, SKU allocation falls outside the scope of the problem considered in this paper. The volume of stock for a SKU for a wave of picking is predetermined by the planning department. In addition, the number of required locations for a SKU is predetermined by the DC, as all the stock required for a wave of picking will be stored at the picking line before picking starts.
Manzini [13] compared allocation algorithms for correlated products in a 'less than unit load picker to parts' order picking system. A correlation measure between SKUs is calculated as the number of orders requiring both SKUs. Three algorithms that use this correlation measure are proposed. A case study is presented that compares these algorithms to a cube-per-order index (COI), a frequency based approach, and a random approach. The case study consisted of parallel and orthogonal aisles where a picking vehicle of finite capacity used a composite routing strategy. All approaches significantly reduced overall picking costs compared with the random approach, while the approaches using correlation measures showed a marginally better performance compared with the COI approach. Due to the cyclical nature of the picking lines and the ability of pickers to pick directly into cartons, these approaches cannot be directly applied to the order picking system considered in this paper.
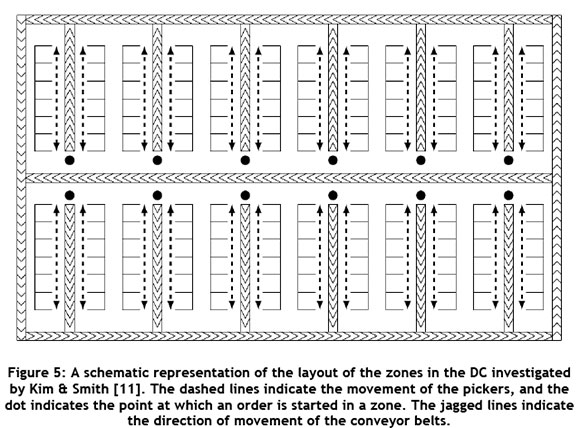
The multiple picking line system considered at PEP shows many similarities to a study by Kim & Smith [11] that focused on a dynamic warehouse slotting problem, where SKUs are re-slotted daily in a zone-based carton picking DC. After the completion of a day's scheduled orders (or pick wave), the orders required for the next pick wave are known, which creates a deterministic planning environment for re-slotting. During each night shift, SKU re-slotting takes place based on the SKU correlations created by the orders scheduled for the next pick wave. The objective of the re-slotting is to reduce the overall picking time of each pick wave.
The order picking configuration considered by Kim & Smith [11] consisted of multiple zones comprising a single shelf with uniform slots. Each zone is serviced by a single picker who walks between the shelf and a parallel conveyor belt. Pickers collect pending orders from one end of the zone (the start) and pick all required SKUs for the order before placing the carton on the conveyor belt and returning to the start of the zone to begin a different order. In this way, the distance travelled by a picker to complete an order for a zone is twice the distance from the start of the zone to the furthest SKU. The conveyor belt conveys cartons either to the dispatch area for completed orders, or to another zone for further picking, thus allowing cartons to hold stock from multiple zones. A schematic representation of this layout is given in Figure 5.
Kim & Smith [11] used a mixed integer programming (MIP) formulation to assign SKUs to slots while minimising the overall distance travelled. Due to the nature of the order picking configuration, the distance travelled could be determined with a linear system of constraints. The MIP was not solvable due the size of the problem. They therefore investigated four further heuristic approaches:
- a steepest descent neighbourhood slotting (SD) heuristic that, given an initial solution based on a heuristic using the COI, compares all pairwise interchanges sequentially, selects the best interchange in terms of total pick distance, and implements it until no improvements are possible;
- a correlated slotting (CS) heuristic that uses a similar pairwise comparison approach, except that correlations (number of orders requiring both SKUs) are considered; and
- two simulated annealing approaches based on either the SD or the CS heuristics that were used to aid in the movement away from local optima. They showed that the simulated annealing approaches yielded the best results, and the worst-performing heuristic was the SD heuristic.
Although the order picking system they considered is similar to PEP's system, the cyclical paths walked by pickers creates a more complex environment to calculate walking distance.
3 MODEL
The focus of this study is on the assignment of scheduled DBNs to available picking lines (as waves) for a single day while minimising the walking distance of pickers. Because the scheduling of DBNs takes into account the number and capacity of available picking lines, all the DBNs that are scheduled for a day will be assigned to a picking line. This problem, which will be referred to as the picking line assignment problem (PLAP), can therefore be described as a generalised assignment problem (GAP), with a set of available picking lines (or knapsacks) to which a set of DBNs (or items) must be assigned. Each DBN requires a number of locations (or weight) in a picking line, and each DBN must be assigned to a picking line with a limited number of available locations.
Two further problems must be solved to calculate the walking distance of pickers once DBNs have been assigned to a picking line. SKUs must be assigned to specific locations in their respective picking lines using an assignment model; and then the orders defined by the DBNs within each picking line must be sequenced for pickers using a clustered travelling salesman model. All three problems must therefore be solved to solve the PLAP.
Matthews & Visagie [15] focused on the sequencing of orders in a unidirectional picking line with fixed SKU locations while minimising total walking distance. Their approach is based on a maximal cut formulation that calculates a solution within one walking cycle of a lower bound. A cycle is the distance walked by a picker to go around the picking line once. In other words, a cycle is the distance that a picker walks to pass all the locations once. The solution determines the preferred order to assign to a picker given his/her current location, and is suitable for the current VRS.
Matthews & Visagie [17] showed that the scope for optimisation by arranging the SKUs assigned to a picking line is limited. Several heuristics were tested against a lower bound and a set of random arrangements. It was shown that there is no significant difference in performance between any of the approaches, including random arrangements. These algorithms included the Greedy and Organ pipe heuristics that are known from the literature to be optimal for carousel systems with a stochastic set of orders [8]. It was also shown that integer programming approaches to a SKU arrangement in a single picking line -while minimising walking distance - were too computationally complex to solve. The conclusion, therefore, was to use greedy approaches to allocate SKUs to locations within a picking line.
The mathematical structure of the PLAP consists of simultaneously solving a GAP as DBNs are allocated to picking lines, an assignment problem as SKUs are assigned to specific locations in their picking line, and a clustered travelling salesman problem to sequence the orders defined within each picking line. All three problems are intractable on their own, resulting in the PLAP being intractable as well. A less complex objective function or estimator for total walking distance is therefore presented here to solve the GAP, and only after DBNs have been assigned to picking lines is the actual walking distance calculated by arranging the SKUs and sequencing the orders.
Matthews & Visagie [17] proposed a lower bound for the number of cycles traversed in a picking line by considering the SKU with the greatest number of stores requiring it -referred to as a maximal SKU. A picker will need to walk at least once around the picking line for each store requiring a maximal SKU and thus the maximal SKU constitutes a lower bound on the number of cycles walked by pickers. The number of stores requiring a maximal SKU (or size of a maximal SKU) for each picking line could therefore be considered an estimate of the total walking distance in terms of the number of cycles traversed. An integer programming (IP) formulation is proposed with an objective function that seeks to minimise the sum of the sizes of the maximal SKUs. Once the DBNs have been assigned to picking lines using this formulation, the exact number of cycles traversed is calculated. This is achieved by arranging SKUs in the picking line using a greedy approach proposed by Matthews & Visagie [17], after which the orders are sequenced using the maximal cut formulation by Matthews & Visagie [15].
To model the assignment of DBNs to picking lines, the following parameters are set:
£ be the set of all picking lines with elements l,
|l| be the number of SKU locations available for picking line l,
£ be the set of all DBNs with elements d,
|d| be the number of locations required by DBN d,
[d] be the size of a maximal SKU associated with DBN d.
To assign DBNs initially using this objective, define

and
yi as the size of the maximal SKU for picking line I.
In terms of these symbols, the objective is to

subject to
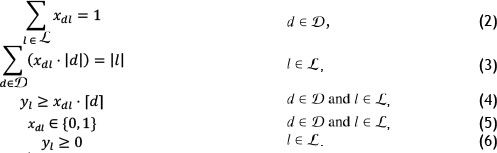
The objective function (1) minimises the sum of the sizes of all maximal SKUs for each picking line. Constraint set (2) assigns each DBN to a single picking line, while constraint set (3) ensures that the number of locations needed by the DBNs assigned to a picking line should be equal to the number of locations available in that picking line. The size of the maximal SKU for each picking line is determined by constraint set (4).
Experiments showed that formulation (1)-(4) was not solvable in a reasonable time (within 10 minutes) for instances with five or more picking lines. A further relaxation of the formulation is therefore introduced. The computational complexity is reduced by adjusting the value for the size of all maximal SKUs by rounding to the nearest multiple of a parameter a. These adjusted sizes, which are minimised, lead to a reduced number of possible objective function values during the optimisation procedure, and a potentially faster convergence to an optimal solution. To model this relaxed formulation (IPa), constraint set (4) is replaced with

where [d]ais the adjusted size of the maximal SKU for DBN d.
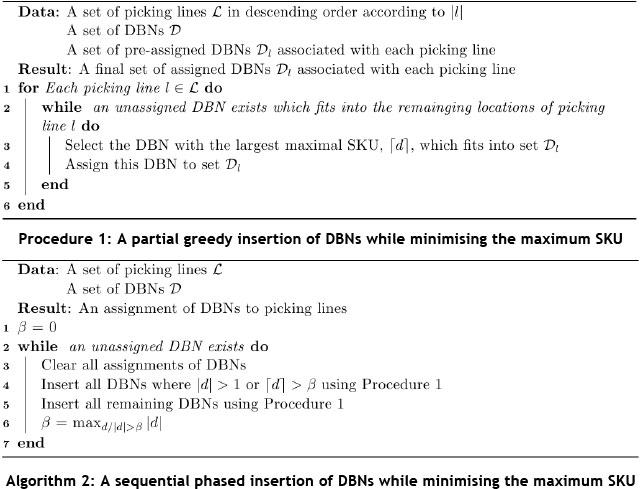
Although the use of adjusted sizes as an objective function significantly reduced computational times, the formulations were still not solvable within a reasonable time for instances with seven or more lines. A further heuristic was developed, based on an insertion heuristic for GAPs developed by Martello & Toth [14], whose approach ranks all unassigned items in decreasing order - based on the difference between each item's best and second best possible assignment into a knapsack - and assigns the top item to its best knapsack. This process is repeated until all items have been assigned, or until there is insufficient space for an item to be assigned to a knapsack, resulting in an infeasible solution. Using this framework as a starting point, a greedy insertion algorithm (GI) for the PLAP is introduced in Algorithm 1.
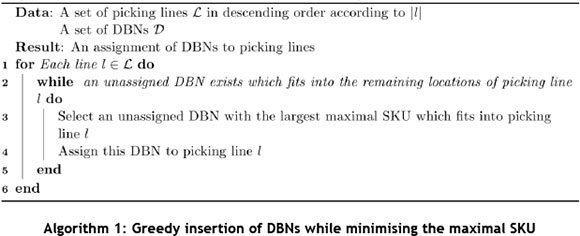
After experimenting with real life data it was found that, for rare instances, Algorithm 1 does not yield feasible results, as some DBNs remain unassigned. In an attempt always to find feasible solutions, Algorithm 1 was adjusted to have two phases, resulting in a phased greedy insertion heuristic (GP). The first phase would assign all DBNs that require more than one location, or that are required by more than β stores, to a picking line using Procedure 1. After this initial assignment, the remaining DBNs (each requiring a single location) are then assigned in the same fashion. A feasible solution can always be found by removing enough DBNs requiring only one location from the initial insertion. By choosing a good value for β, the effects on the size of a maximal SKU may also be reduced. In an effort to keep β as small as possible and thus to reduce the effects on a maximal SKU, β is incrementally increased (line 2, Algorithm 2) until a feasible solution is found. This phased approach is described by Algorithm 2.
4 DATA AND RESULTS
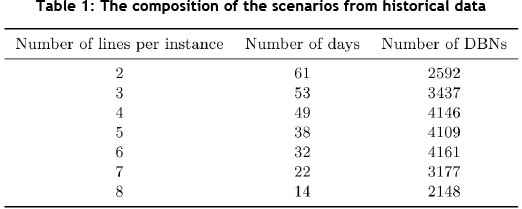
To test the approaches introduced in the previous section, historical data from PEP was captured over a three month period and made available on-line [16]. The data consisted of 353 picking lines over 61 work days, with the number of parallel picking lines operating per day ranging from two to 11. The dataset contained 7,354 unique DBNs and 7,510 unique SKUs3. Due to the wide range of the number of lines scheduled for a day, the master data was reorganised into seven scenarios. This allowed for a more comprehensive comparison between algorithms. Each scenario consisted of a more uniform set of instances (days) where each instance in a scenario had the same number of picking lines. These scenarios were constructed by taking each historical instance with η picking lines and removing picking lines to create additional instances with η - 1, η- 2 ... 2 picking lines. Each of these new instances still comprised a set of historical picking lines that were scheduled for the same day, thus allowing solution approaches to be compared with the historical case. The composition of these adjusted scenarios is given in Table 1.
All tests were performed on an Intel i7 2GHz processor with 8 GB ram running the Windows 7 operating system. All mathematical formulations were solved with CPLEX 12.3 and coded in AlMMS 3.12 [9, 19]. Each instance was run for a maximum of two hours, after which the best solution obtained was reported on.
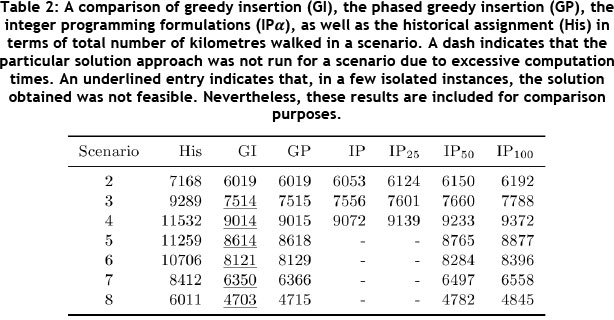
A summary of the total walking distance by pickers for each scenario is shown in Table 2. It is clear that all the solution approaches significantly improve on the current assignment approach used by PEP. As expected, the reduction in the accuracy with which the size of maximal SKUs is calculated reduces the solution quality. However, this is not a significant reduction relative to the improvement on the historical case. It is noted that the GI and GP approaches appear to outperform the IP approaches. This small improvement is attributed to the sequence in which picking lines are populated, which is more suited to the greedy approach to the SKU arrangement and final order sequencing.
To illustrate the loss of accuracy when using the size of the maximal SKU as an estimate of total walking distance, the sum of the maximal SKUs for each picking line was converted to distance and summarised in Table 3. This conversion was achieved by taking the maximal SKU as the final number of physical cycles walked, and converting this to kilometres in the same fashion as in Table 2. The actual walking distance is, on average, five per cent greater than the distance estimator calculated using the size of the maximal SKUs for the historical case. The difference between the actual walking distance and the distance estimation (calculated using the maximal SKU) is significantly larger for the proposed solution approaches, and ranges from 25 per cent to 60 per cent, depending on the size of the scenario. This suggests that the sum of the maximal SKUs is only an accurate measure of the total walking distance for poor SKU to picking line assignments. This occurs when the size of the maximal SKUs within each picking line, which is a lower bound, tends towards the total number of orders in the picking line, which is an upper bound. Although this measure does not accurately estimate the final walking distance, it is effective in reducing the total walking distance when used as an estimate in the objective function.
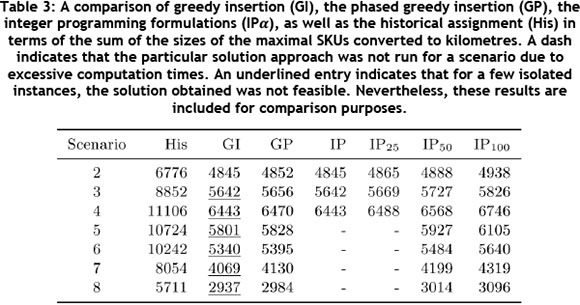
The GP approach shows similar results to the IP approach with respect to the sum of the sizes of the maximal SKUs for scenarios with four or fewer picking lines. In many cases, after determining the actual walking distances by arranging the SKUs in the picking line and sequencing the orders, the GP outperforms the IP approach. This suggests that improving solution methods for solving the exact MIP approach in (1)-(6) would have an insignificant effect on the final walking distance for scenarios with more picking lines.
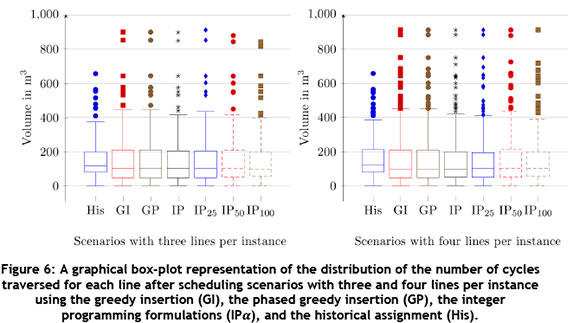
A box-plot representation of the number of cycles traversed for each picking line in scenarios with three and four lines per instance, respectively, is given in Figure 6. This representation illustrates the median (50th percentile), Q1 (25th percentile), and Q3 (75th percentile) as the horizontal lines in the closed box. The individually-plotted coordinates are associated with the outliers in terms of cycles traversed. These outliers are all picking lines either one-and-a-half times the inter-quartile range (IQR) smaller than Q1, or larger than Q3. The whisker lines indicate the minimum and maximum number of cycles for non-outlier picking lines. From the results in Figure 6, it is clear that the overall distribution of cycles traversed when minimising the sum of the sizes of the maximal SKUs is more spread towards a smaller numbers of cycles. It is clear that the current assignment methodology at PEP creates a distribution that is skewed towards larger lines. This pattern was also observed for all other scenarios.
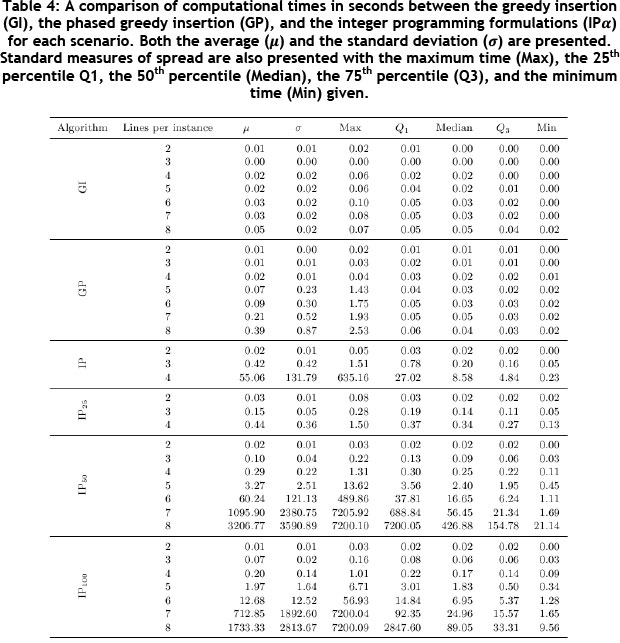
A summary of the computational times for all the approaches is given in Table 4. These computational times do not include the time required to arrange SKUs and to solve the order sequencing problems ranging from 0 to 40 seconds. It is clear that the computation times for the exact approaches decrease significantly as the accuracy of the adjusted sizes of the maximal SKUs decreases. It is also clear that, even if the size of the maximal SKUs is rounded to the nearest multiple of 100, the computational times are excessive for scenarios consisting of seven or more picking lines. The Greedy insertion heuristics consistently require less than a second to solve, which suggests that the insertion approach is preferred overall.
It is clear from the results presented in Table 2 that all the proposed solution approaches significantly improve on the total walking distance required by pickers to pick all the SKUs. Further analysis was also performed to evaluate the effects on other areas in the DC. One of these areas is carton utilisation. Should a carton be under-utilised, this will require additional material handling to resize it. To evaluate poor carton utilisation, PEP supplied a threshold carton size of 0.006 m3(the size of a typical shoe box) [21]. Orders with a volume less than that were considered undesirable. Should an order require less than this threshold of stock in a picking line, it would be identified as a small order. Table 5 summarises the effect of small orders that are generated by each solution approach. It is clear that the number of small orders is increased when using any one of the proposed solution approaches. The total volume of stock that is packaged in small orders is very small, suggesting no significant impact on transportation costs; however, the increased number of cartons increases carton handling in the DC. Although this increase is undesirable, the operations management at PEP has agreed that it is manageable.

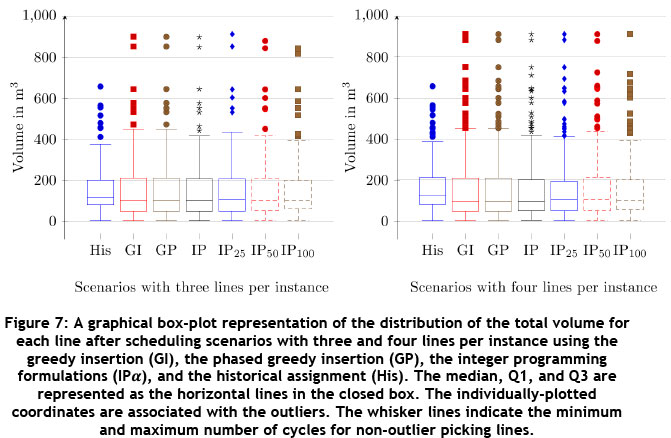
A further area of concern is the distribution of total volume over picking lines. Picking lines with large volumes require long building and picking times that may become an operational risk. Figure 7 illustrates distribution of volume (in m3) to picking lines for the scenarios with three and four lines per instance respectively. It is clear that when assigning DBNs to minimise the sum of the maximal SKUs, the size and number of the large picking lines increases in volume. This pattern was also observed for the other scenarios. These large picking lines are undesirable, both in the historical data and in the proposed assignments, but they are all manageable at these low occurrences.
All solution approaches showed significant improvements in walking distance compared with the historical case. The two heuristic insertion approaches consistently obtained better solutions in less than one second of computational time. Moreover, the GP approach achieved feasible solutions for all instances. It is therefore recommended that the GP approach should be used by PEP when assigning DBNs.
5 CONCLUSION
An order picking operation in a DC owned by PEP was investigated. The system functions with unidirectional cyclical picking lines to process waves of SKUs. These SKUs are grouped together into DBNs (if they differ only by size), and are planned and scheduled as a group. The objective is to minimise the total walking distance of pickers by assigning the DBNs to available picking lines for picking.
Several approaches to SKU assignment in the literature were studied, but the cyclical nature of the routes of the pickers around the picking lines created a unique system that renders existing approaches unusable. An IP formulation was therefore suggested and tested using historical data from PEP. It was shown that this approach reduced the walking distance of pickers on average by 22 per cent, but it was not solvable in a reasonable time for scenarios where there are five or more picking lines in a day. A further relaxation of this IP approach was introduced that adjusted the size of the maximal SKUs by rounding. This relaxed formulation showed similar results in terms of cycles with a computation time 50 times faster. However, scenarios with seven or more picking lines could still not be solved within a reasonable time.
To solve larger instances, a heuristic approach was introduced, based on an algorithm for GAPs by Martello & Toth [14] that greedily inserted DBNs. This approach yielded good results, but in some cases not all the DBNs were assigned to a picking line. A further phased greedy insertion approach was developed that held back smaller DBNs for later insertion to achieve feasibility. The approach showed good results and achieved a feasible solution for all test instances.
Following the improvement in picker walking distance, the effects of the DBN assignments on other factors were investigated. Carton utilisation was measured by determining the number of orders that consisted of a small volume of stock. These small orders would require additional material handling to resize their cartons. The number of these small orders increased when minimising walking distance. This increase was considered manageable by PEP, although undesirable.
The second factor was the distribution of volume over different picking lines. Picking lines with too-large volumes are considered an operational risk. The proposed algorithms increased the number and volume of these large picking lines compared with the historical case. Once again, these large picking lines from both the historical case and the proposed assignments are manageable, but undesirable.
It is proposed that PEP use an assignment approach that minimises the sum of the maximal SKUs. The GP approach is recommended because its solution quality is good and its computational times short. Future studies should consider the trade-offs seen here between walking distance, small orders, and large volumes of stock on picking lines. Future work could also include developing assignment strategies that reduce the number of small orders generated, and control the occurrences of large lines with respect to volume, while still reducing the most important factor - the walking distance of the pickers.
ACKNOWLEDGEMENT
The financial assistance of the National Research Foundation (NRF) towards this research is hereby acknowledged. Opinions expressed and conclusions arrived at, are those of the author and are not necessarily to be attributed to the NRF.
REFERENCES
[1] Accorsi, R., Manzini, R. & Bortolini, M. 2012. A hierarchical procedure for storage allocation and assignment within an order-picking system: A case study, International Journal of Logistics: Research and Applications, 15(6), pp 351-364. [ Links ]
[2] Bartholdi, J.J. & Hackman, S.T. 2011. Warehouse and distribution science, The Supply Chain and Logistics Institute School of Industrial and Systems Engineering, Georgia Institute of Technology, Atlanta, GA 30332-0205 USA. Available from http://www.warehouse-science.com. [ Links ]
[3] Chiang, D.M.H., Lin, C.P. & Chen, M.C. 2011. The adaptive approach for storage assignment by mining data of warehouse management system for distribution centres, Enterprise Information Systems, 5(2), pp 219-234. [ Links ]
[4] De Koster, R., Le-Duc, T. & Roodbergen, K.J. 2007. Design and control of warehouse order picking: A literature review, European Journal of Operational Research, 182(2), pp 481-501. [ Links ]
[5] Emerson, C.R. & Schmatz, D.S. 1981. Results of modelling an automated warehouse system, Industrial Engineering, 13(8), pp 28-32. [ Links ]
[6] Garfinkel, M. 2005. Minimizing multi-zone orders in the correlated storage assignment problem, PhD, Georgia Institute of Technology. [ Links ]
[7] Hagspihl, R. & Visagie, S.E. 2014. The number of pickers and stock-keeping unit arrangement on a unidirectional picking line, The South African Journal of Industrial Engineering, 25(3), pp 169183. [ Links ]
[8] Hassini, E. 2009. One-dimensional carousel storage problems: Applications, review and generalizations, INFOR, 47(2), pp 81-92. [ Links ]
[9] IBM. 2012. CPLEX. Available from www.ibm.com. [ Links ]
[10] Jane, C.C. & Laih, Y.W. 2005. A clustering algorithm for item assignment in a synchronized zone order picking system, European Journal of Operational Research, 166(2), pp 489-496. [ Links ]
[11] Kim, B.S. & Smith, J.S. 2012. Slotting methodology using correlated improvement for a zone-based carton picking distribution system, Computers & Industrial Engineering, 62(1), pp 286-295. [ Links ]
[12] Litvak, N. & Maia, V. 2010. A survey on performance analysis of warehouse carousel systems, Statistica Neerlandica, 64(4), pp 401-447. [ Links ]
[13] Manzini, R. 2006. Correlated storage assignment in an order picking system, International Journal of Industrial Engineering, 13(4), pp 384-394. [ Links ]
[14] Martello, S. & Toth, P. 1990. Knapsack problems: Algorithms and computer implementations, John Wiley & Sons, West Sussex, England. [ Links ]
[15] Matthews, J. & Visagie, S.E. 2013. Order sequencing on a unidirectional cyclical picking line, European Journal of Operations Research, 231(1), pp 79-87. [ Links ]
[16] Matthews, J. & Visagie, S.E. 2014. Picking line data. Available from http://scholar.sun.ac.za/handle/10019.1/86110. [ Links ]
[17] Matthews, J. & Visagie, S.E. 2015. SKU arrangement on a unidirectional picking line (submitted). [ Links ]
[18] Pan, J.C.H. & Wu, M.H. 2009. A study of storage assignment problem for an order picking line in a pick-and-pass warehousing system, Computers & Industrial Engineering, 57(1), pp 261-268. [ Links ]
[19] Paragon Decision Technology. 2012 AIMMS. Available from www.aimms.com. [ Links ]
[20] Pep Stores Ltd. 2013. PEP. Available from www.pepstores.com. [ Links ]
[21] Serdyn, H. 2013. Personal communication. Contactable at: HENNIESE@pepkorit.com. [ Links ]
[22] Tompkins, J.A. 2010. Facilities planning, 4th edition, John Wiley & Sons, Hoboken, NJ. [ Links ]
* Corresponding author
1 The author was enrolled for a PhD (Operations Research) degree in the Department of Logistics, University of Stellenbosch
2 Complementary SKUs have a high probability of being required together, and substitutionary SKUs have a low probability of being required together.
3 Some SKUs are present in multiple DBNs due to replenishment cycles.

