


Servicios Personalizados
Articulo
 Inglés (pdf)
 Articulo en XML
 Referencias del artículo
Indicadores

Links relacionados
-
 Citado por Google
 -
 Similares en Google
Compartir

 Permalink
South African Journal of Industrial Engineering
versión On-line ISSN 2224-7890
versión impresa ISSN 1012-277X
S. Afr. J. Ind. Eng. vol.25 no.2 Pretoria ago. 2014
GENERAL ARTICLES
Quantifying Quality Management System performance in order to improve business performance
R.A. SmithI, *; A. BesterII; M. MollIII
IThe author was enrolled for an MTech (Quality) in the Department of Industrial and Systems Engineering at the Cape Peninsula University of Technology. Department Industrial and Systems Engineering Cape Peninsula University of Technology, South Africa.I richard.smith@eskom.co.za
IIDepartment Industrial and Systems Engineering Cape Peninsula University of Technology, South Africa. bestera@cput.ac.za
IIIDepartment Industrial and Systems Engineering Cape Peninsula University of Technology, South Africa. MollCM@cput.ac.za
ABSTRACT
This study investigates current methods of measuring quality management system (QMS) performance. It introduces a methodology to quantify QMS performance in order to provide a reference point for improved QMS performance and, in turn, the business's performance. By introducing metadata into historical or current QMS internal audit data, the study shows that it is possible, over time, to extract various levels of value-adding data, ranging from high-level, strategic, direction-oriented insight, to process effectiveness and implementation-level guidance. This is accomplished by a repeatable process of infusing cause and effect theming data and process-consequence severity data into the QMS audit-findings data, and subsequently analysing the additional metadata.
OPSOMMING
Die huidige metodes om gehaltebestuurstelsels se prestasie te beoordeel word ondersoek. 'n Metode om gehaltebestuurstelsels se prestasie te kwantifiseer word bekendgestel om as 'n verwysing vir verbeterde gehaltebestuurstelsels op te tree. Die studie toon dat, deur metadata in historiese of huidige gehaltebestuurstelsels se interne oudit data in te voer, dit moontlik is om, met die verloop van tyd, waardevolle data te onttrek. Hierdie data strek van hoë vlak, strategiese, rigting-georiënteerde insig tot proses doeltreffendheid en implementasievlak leiding. Dit is vermag deur 'n herhaalbare proses van oorsaak-en-gevolg data en prosesgevolg data in die gehaltebestuurstelsel in te voer en gevolglik die addisionele metadata te analiseer.
1 INTRODUCTION
Many top-performing businesses that achieve superior levels of success and sustainability have also implemented a sound and well-maintained Quality Management System (QMS). The correlation between business success and an implemented QMS is presented in numerous papers [7, 17]. By presenting a quantifiable measure of an organisation's QMS performance, this research provides a reference point for gauging QMS performance, and a definitive measure that will help businesses to improve their performance.
Although this research was conducted at Eskom's Koeberg Nuclear Power Station (KNPS), the applied findings may be used, with minor adjustments, by any business that implements QMS internal audits as a business improvement tool. The study was performed on data produced over three years (2008 to 2010) from a programme of QMS internal audits, and was based on KNPS's quality and safety manual and the national regulatory licensing requirements. The audit monitoring programme, which was implemented over three years, considers all the management system processes that impact on nuclear safety and business performance. The individual audits each consider ISO 9001 criteria [12] within the context of the business area audited. Each major business area (e.g., design, maintenance) within the power station adheres to all generic ISO 9001 QMS clauses and considerations, such as documentation management, records management, and so on. Each process or business area audit is effectively a QMS audit. The combined audit results are therefore a representative measure of the organisation's overall QMS performance.
The research question seeks to determine how the performance measurement capability of the QMS can be improved in order to assist management in identifying business risk resulting from QMS deficiencies, and thus to improve business performance. This research reviews the literature to identify which quality management methods are currently used to measure and improve business performance. This study shows how deconstructing and analysing QMS performance measurements can provide the necessary insight for management decision-making.
2 LITERATURE REVIEW
2.1 Quality management methods and philosophies
According to Kellen [13], business performance measurement and control systems are the formal information-based routines and procedures that managers use to maintain or alter patterns in organisational activities. Kellen [13] notes that a typical performance measurement can help businesses to set business goals regularly, and subsequently provide managers with feedback on the progress towards meeting those goals. Kellen [13] cites Lebas and Euske (2002) when defining performance: "Doing today what will lead to measured value outcomes tomorrow". Kellen [13] concludes that business performance measurements are concerned with measuring this performance relative to some benchmark, be it a competitor's performance or a pre-set target.
Ghalayini and Noble [9] note that, in order for companies to ensure that they achieve their goals and objectives, performance measures are used to evaluate, control, and improve production processes. A variety of quality management methods and philosophies such as Business Excellence Models, Balanced Scorecards, and QMS Standards have been employed to measure performance. Choosing a specific quality management method depends on the market situation, product strategies, and the competitive environments to which the business is exposed. Van der Wiele et al. [22] conclude that quality management strategies such as certification to ISO 9000 series, and self-assessment against excellence models, can help companies move toward higher levels of excellence and improve overall business performance[23, 24].
Eskom has embarked on an ISO 9001 certification programme for all of its business units. Quality management within Eskom is seen as the overriding consideration that impacts on plant safety and reliability. KNPS attained SABS ISO 9001 certification during August 2012. A sound QMS is recognised as essential for providing sustained customer-focused process outputs that contribute to improved business performance [7]. The nuclear power generation industry has additional safety considerations and standards that need to be considered in conjunction with ISO QMS standards, in order to provide a more specific measure of QMS health and performance.
2.2 The role of QMS audits and process prioritisation
Ramly et al. [16] note that the need to improve organisational performance is a key issue to consider due to competitive pressure in manufacturing industries. The authors state that, in order to achieve a higher competitiveness level, these organisations must be able to identify their current quality performance and re-align their strategies, operations, and processes in order to improve it. Ramly et al. [16] go on to state that 'an audit' is one of the many useful tools for identifying the current quality performance: an audit helps to diagnose the opportunities for improvement, and to plan how to make improvements.
The Nuclear Energy Institute's (NEI) Standard Nuclear Performance Model (SNPM) provides guidance on how organisations can prioritise the more important processes from a safety perspective. This prioritisation guide is considered in the audit programme's planning phase so that resources may be re-directed more efficiently to provide the greatest value to the organisation, while still adhering to regulatory requirements.
The NEI's SNPM [14] has been considered extensively within the management systems of the Koeberg Operating Unit (KOU), of which KNPS is one business area. The NEI's SNPM is used as a guide for describing the process relationships and the method for grading ('severity grading') the various elements of the KOU management system processes.
The NEI's SNPM [14] notes how business outcomes can be established from both the core processes and the enabling processes. In nuclear generation, these business outcomes include the safe and reliable generation of electricity:
- Core processes: they are most directly-related to nuclear safety, and accomplish a key business function [14]. The core processes are 'Operate Plant', 'Work Management', 'Manage Configuration', 'Equipment Reliability', and 'Materials and Services'.
- Enabling processes: they are applied in support of one or more core processes [14]. The enabling processes are 'Management Processes and Support Services', 'Training', 'Nuclear Fuel', and 'Loss Prevention'.
The graded definitions noted in the NEI's SNPM (for core and enabling processes) will be used as a weighting criterion in Sections 4 and 5 to provide a significance dimension to the QMS health indicator for a nuclear QMS. The enabling processes have been further subdivided into 'management and support areas' in order to differentiate the significance between nonconformities.
2.3 Quality measurement instruments
When attempting to manage quality, the context of the environment needs to be taken into account and measured. Recent research has shown that a universalist approach is inappropriate because quality management is in fact context-dependent [20]. The management control discipline can provide important insights for quality management, because this acknowledged the importance of the business's context more than a decade ago. It is thus proposed that the criteria for the quality measurement instrument will adopt the context of its quality objectives. Two instruments, with different quality objectives and measurements, have been developed:
- Pan et al. [15] notes that the SERVQUAL instrument, developed by Parasuraman (1988), is widely used for measuring quality in the service industry;
- Saraph et al. [18] have developed an instrument that measures the 'critical factors of quality'.
Saraph et al's [8] paper identified eight critical factors (areas) of quality management in a business unit. These factors' operational measures were developed by using data collected from 162 general managers and quality managers of 89 divisions in 20 companies. They argue that researchers can use such measures to improve their understanding of quality management practice, and build theories and models that use the critical factors of quality management to improve the organisation's quality performance and environment.
2.4 Quality performance measurement inputs
To enable a reliable measurement of quality performance, quality data collected from audits must be rationalised, simplified, and questioned via complementary quality methodologies. Pan et al. [15] imply that methods such as the use of performance indicators enable conversion of the qualitative data into a quantitative domain; this makes it easier to uncover more meaningful information. This research proposes that using performance indicators and segregating data into cause-and-effect domains provides additional context to the information for management reporting.
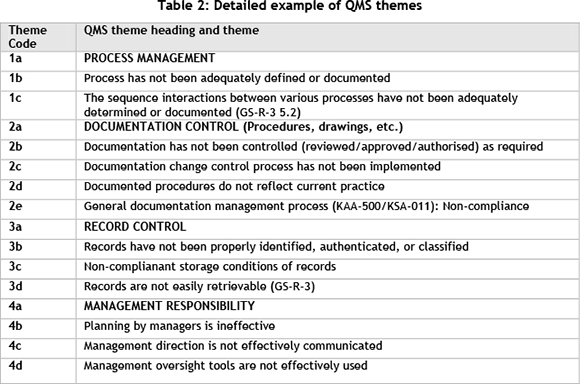
Every measurement is subject to some uncertainty [2]. Bell [2] notes that a measurement result is only complete if it is accompanied by a statement of the uncertainty in the measurement. Measurement uncertainties can come from the measuring instrument, from the item being measured, from the environment, from the operator, and from other sources. This paper argues that such uncertainties can be estimated by using statistical analysis of a set of measurements, and by using other types of information about the measurement process. To categorise qualitative audit data, this research used a QMS themes table (an example is shown in Table 2). This list of themes was derived from a combination of functional decomposition and thematic analysis.
2.5 Standard themes produced using functional decomposition and thematic analysis
Fink [6] notes that the decomposition method is well known in the information systems and computer science disciplines. This technique is commonly applied during the systems analysis phase, when flow diagrams are produced of the system that have been broken down into increasingly smaller pieces. During the systems design phase, it is common practice that data is normalised to reduce redundancy, and that structure charts are constructed to reduce complexity in the cohesion and coupling of the data [6]. Fink [6] argues that the decomposition technique is essentially a top-down approach to solving a complex problem. This methodology was used to create the list of QMS themes presented in Table 2.
Guest et al. [8] note that thematic analysis methods such as grounded theory and cultural models require more involvement and interpretation from the researcher. They state that thematic analysis moves beyond counting explicit words or phrases, and focuses on identifying and describing both implicit and explicit ideas within the data - that is, themes. The authors explain that codes are typically developed to represent the identified themes, and then applied or linked to raw data as summary markers for later analysis. Thematic analysis methods may include the following: comparing code frequencies, identifying code co-occurrence, and graphically displaying relationships between codes within the data set.
Guest et al. [8] note that reliability is generally of greater concern in thematic analysis than in word-based analysis methods, because more interpretation goes into defining the data items (e.g., codes) and applying the codes to chunks of text. The authors argue that this issue is even more pronounced when working in teams with multiple analysts. To maintain rigor, strategies for monitoring and improving intercoder or rater agreement, and therefore reliability, should be implemented in the analytic process. The authors feel that, despite the few issues related to reliability, a thematic analysis is still the most useful method for capturing the complexities of meaning within a textual data set. Functional decomposition and thematic analysis [6, 8] was used to produce the comprehensive list of QMS themes shown in Table 2.
3 RESEARCH METHODOLOGY
The literature review provided the theoretical foundation and reasoning for why this research selected the particular QMS performance measurement and quantification methodology. The research approach is considered to be inductive because the theory emerged from the data collection and analysis, and not the other way around [19]. Saunders et al. [19] argue that the defining feature of applied research is that it is driven by the need to answer practical questions related to the research topic. In this study, therefore, applied research is considered to be the most appropriate research approach. This study is based on the need to answer practical questions around the methods that may be employed to measure QMS performance. Section 4.0 on 'Environment and modelling' continues this discussion of the research methodology with its focus on the considerations for research modelling.
3.1 Secondary and primary data
Archival research provided the initial data population for this study, collected from the programme of QMS internal audits produced over the three years from 2008 to 2010. Saunders et al. [19] argue that archival research makes use of administrative records and documents as the principal source of data. They note that, although the term 'archival' has historical connotations (e.g., historical documents), it can also refer to recent documents. Saunders et al. [19] argue that all research that uses data contained in administrative records is inevitably secondary data analysis, because that data was originally collected for a different purpose. However, when this data is used in an archival research strategy, it is analysed for the value it provides to the current research.
Saunders et al. [19] caution researchers, explaining that archival research data may not contain the precise information required to answer the research question(s) or meet the research's objectives. Using an archival research strategy therefore necessitates establishing what data is available, and designing the research to make the most of it. Figure 1 shows the two main data types used in this study. The audit process produced secondary data (grey elements) in the context of the research method chosen.
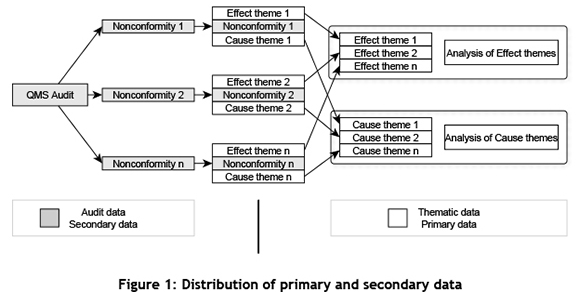
The primary data in this study was obtained by introducing metadata to historical internal audit data (secondary data). The metadata comprises two themes assigned to each nonconformity, as shown at the data boundary in Figure 1 (discussed further in Section 4.4.).
The objective of introducing additional theming data into the audit findings (secondary) data is to provide locating tags related to the QMS, and to enhance the severity information embedded within audit findings collected over a defined period.
3.2 Data sets and sources
The data that will be analysed to support the research (Figure 1) comprises the following: Secondary data:
- Audit findings data collected over three years (2008 to 2010), comprising 254 nonconformities, that includes a severity grading of each nonconformity. The entire population was used. Table 3 shows a sample of the data set.
Primary data:
- Pilot study of a small sample of nonconformities, allowing themes to be assigned independently to support directing methodology; this helped to establish reliability for this study and for future research (data triangulation).
- Data resulting from assigning cause and effect theming by the researcher to the historical audit findings; this produced QMS process deficiency locating information on the audit findings.
- Data resulting from the researcher inserting quantitative generic severity information into QMS process areas related to the historical audit findings.
4 ENVIRONMENT AND MODELLING
4.1 The QMS monitoring and reporting environment
A nuclear operating license was given to Eskom with the expectation that Eskom's KNPS would consistently comply with the licence's requirements. One element of the nuclear operation licence requires that KNPS give an assurance that they are implementing a QMS. To realise this assurance, a series of audits and reviews (monitoring activities) have to be implemented over a three-year period. This series of monitoring activities has to incorporate all process areas of the QMS.
Figure 2 is adapted from Eskom's internal audit process procedure [21] and shows the multiple monitoring activities (1 through n) that should take place over time. These monitoring activities result in findings or nonconformities (NCs) being raised where QMS deficiency is noted. The NCs are graded according to their potential consequences for the business. This specific severity grading takes place in accordance with procedures [21], and is aligned to pre-set criteria. This relates to the potential effects or consequences of the nonconformity within the context where the nonconformity manifested itself, graded as a High (H), Medium (M), or Low (L) consequence.

A report of the audit results is then provided to the auditee. This takes place during audit closing meetings and via an official written audit report. Overview reports are presented to senior management on a bi-annual basis or as required. All monitoring activity output data for the reporting period is collected and analysed to make up the overview report. Any actions in addition to the individual audit finding actions may be prescribed by management as a result of trends observed over the reporting period.
4.2 Dimensions of the QMS performance measuring instrument
The dimensions and value of the QMS performance measuring instrument are:
- The benefits of a cause-and-effect theming philosophy.
- Providing a QMS process deficiency locator/identifier.
- Providing the ability to extract a quantitative measure of the management system's performance or health.
4.2.1 QMS process deficiency locator
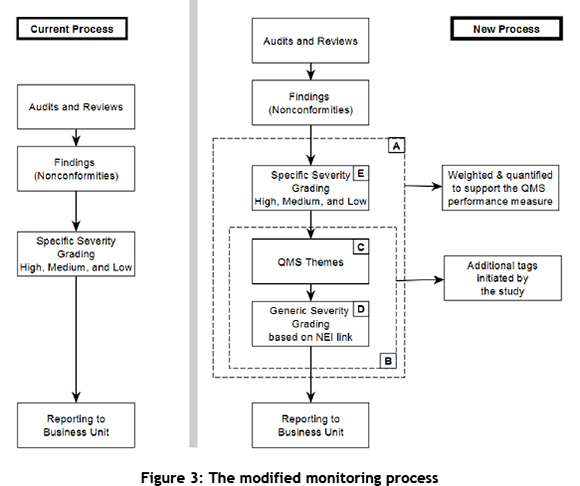
The 'current process' shown in Figure 3 [21] is derived from the existing audit process implemented at KNPS. This study proposes the 'new process' in Figure 3, which introduces elements 'C' and 'D' to support the objective of this research. The QMS process deficiency locating capability is achieved by assigning QMS themes (see Block 'C' in Figure 3) to audit findings. The themes are selected from a standard controlled list of themes (see Table 2) aligned and linked to accepted QMS process areas. The QMS process deficiency locator (or identifier) provides the following benefits:
- Identifies the peaks of the common processes where the QMS is deficient across monitoring periods (using Pareto methodology).
- Identifies the major effects on the business related to the QMS.
- Identifies the major causes of those effects.
4.2.2 QMS 'quantitative measure' tag
The 'quantitative measure' tag is made up of two components: the specific severity grading measure (see Block 'E' in Figure 3), and the generic severity grading measure (see Block 'D' in Figure 3). The specific indicator (High, Medium, and Low) is assigned to a nonconformity by the QMS auditor at the time of the audit, while the generic severity grading will already have been assigned to the process area, or may be assigned to the finding at the same time. All generic severity gradings of the findings in this research were assigned by the researcher as the analysis was conducted on historical data.
4.2.3 Resultant finding metadata
The qualitative theme and severity data is associated with the quantitative data, as shown in Figure 4, by assigning the value-adding metadata Y and Z to each finding (NC).
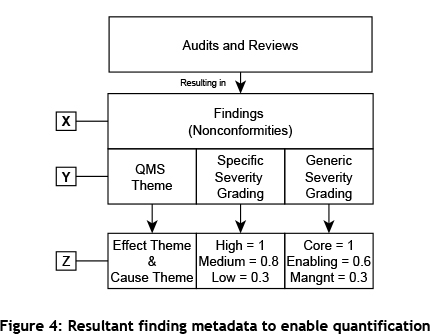
The QMS theme serves as the QMS process deficiency locator/identifier, while the two severity gradings serve as input to the quantitative measure of the management system's health. Arbitrary values were used for the specific and generic severity grades in order to obtain a representative output measure of QMS health. Hubbard [10] defines 'measurement' as "a quantitatively expressed reduction of uncertainty based on one or more observations". Even though additional research may be performed to approach more accurate severity values, this research proposes that the values used will provide sufficient reduction of uncertainty to show the viability of the philosophy. The application of the association of the quantitative data is expanded on in Section 5.3.2.
4.2.4 Creating the list of QMS process themes
The aim of theming audit findings such as nonconformities and observations is to provide timeous information on the nature and location of deficiencies within the QMS process landscape. It enables us to extract credible insight and trends from the QA findings, and also to provide traceability pathways between recommendations to management and the low level process implementation anomalies.
The list of QMS themes shown in Table 2 was used to assign themes to the findings from the monitoring activity. To develop the list, a wide range of applicable documents were used as a guide. The main documents referred to are:
- 36-188: Quality Management Manual for Nuclear Generation.
- LD1023: Quality Management Requirements for KNPS.
- IAEA GSR-3: Management System for Facilities and Activities.
- NEI's SNPM Revision 4: Standard Nuclear Performance Model.
- RD-034: Quality and Safety Management Requirements for Nuclear Installations.
- ASME NQA-1: Quality Assurance Requirements for Nuclear Facility Applications.
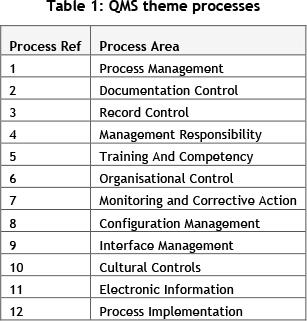
Common areas and categories were extracted from the above-mentioned documents to provide the major theme headings noted in Table 1:
Each theme heading was then expanded to accommodate requirements and expectations extracted from the source documents, to produce the example shown in Table 2.
The comprehensive list used for this study consists of twelve major theme headings and 121 separate themes (including the major theme headings). The high number of separate themes required an extensive data population (three years' worth) in order to obtain useful research results.
4.3 Cause and effect chain philosophy
Ciardiello [3] implies that events, referred to as 'nonconformities' in this research, are all located within a 'cause and effect' chain of events (as shown in Figure 5). This implies that the nonconformity problem statement can be located dynamically within the 'cause and effect' chain. This introduces the difficulty that different auditors may position the same nonconformity effect or consequence in a different location on the chain. This potentially results in variations in local- and overview-reporting based on the overall variance due to auditor bias.
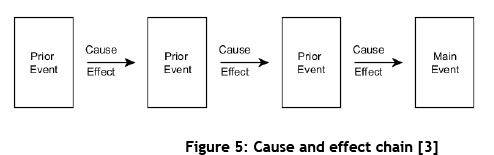
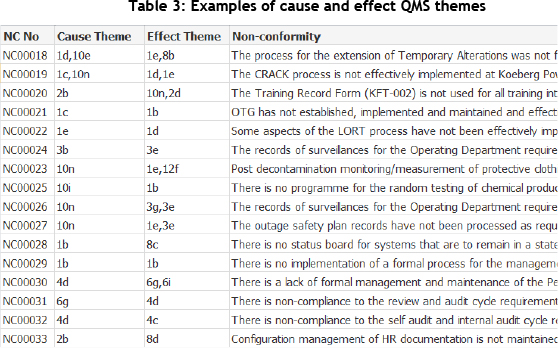
At least one cause and one effect QMS theme is assigned to each monitoring activity nonconformity; this results in a data format, as shown in Table 3.
4.4 Cause and effect theming and the severity grading philosophy
Davies and Davis [5] state that causal relationships are cause and effect links between deliverables, drivers, and benefits (consequences). The relationships are generally many-to-many: a deliverable can influence several drivers, and/or any one driver can be changed by the effect of several deliverables.
The QMS cause and effect theme and specific severity selection options are shown in Figure 6. The tags are assigned using the following criteria:
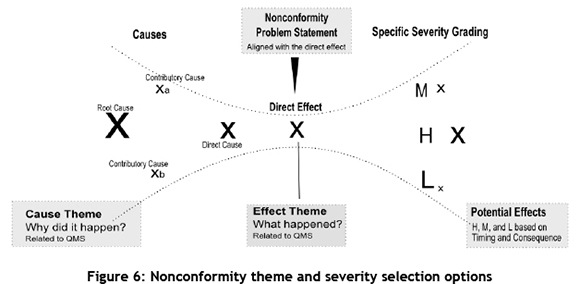
- Effect Theme: Relating to the problem statement - Answering the question "What was the issue?" or "What was discovered?"
- Cause Theme: Relating to the issue or what was discovered. - Answering the question "Why did this happen?" or "What was the main cause?" of what happened in the problem statement.
- Potential Effects: The potential effects are those effects or consequences that have not occurred, but that might potentially occur at various levels of severity, depending on the circumstances of the NC.
- Specific Severity Grading (SSG) - Relating to the potential effects or consequences of the nonconformity, taking into consideration the context in which the nonconformity manifested itself - graded as a High (H), Medium (M), or Low (L) consequence.
In contrast with the SSG, the Generic Severity Grading (GSG) only considers the process area as dictated by the NEI's SNPM [14].
4.5 QMS performance measurement inputs relationship
Figure 7 shows the relationship between the various components in order to produce the QMS health measure. The effect theme is the theme on which the quantitative elements act to produce the measurement. The cause theme is used to inform the action and strategy for corrective and preventative action, which ultimately causes improvement in the QMS health measurement.
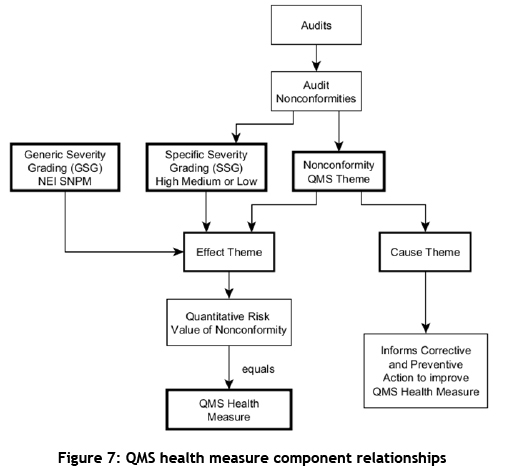
The QMS health measure is considered to be a dynamic measure that will indicate QMS implementation improvement as nonconformities are closed, and will indicate weakening of the QMS implementation as more nonconformities are raised. The performance or health measurement is thus related directly to all open nonconformities and their individual severity grading. This research assumes that all nonconformities considered for this study are 'open'; this implies that no corrective action has been applied.
4.5.1 QMS deficiency location
The assignment and analysis of QMS themes helped to locate the management system deficiencies within the overall QMS context. This location happens at various data levels, such as the individual finding level and the process level. Various levels of action are therefore possible, depending on where management would like to apply corrective action. The corrective action can address only the nonconformity or a more generic process issue that affects wider influences.
4.5.2 QMS theme coding notation
Table 4 shows an excerpt from the list of QMS themes. The theme code consists of a numeric prefix and an alpha suffix (e.g., '1c'). In the example shown in Table 4, QMS theming notation '1c' would be assigned to a nonconformity that had a process or interface flavour.
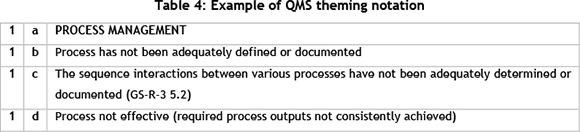
The numeric prefix '1' in the above example indicates that the theme is a component of a 'process management' set, while the 'c' in this example denotes a specific descriptor related to 'process management'. This multi-layered methodology allows for reporting at various levels of detail. When the coding process is repeated over the entire population of nonconformities, a new relational data layer is available for analysis and reporting.
5 RESULTS
5.1 Pareto analysis of the cause and effect themes
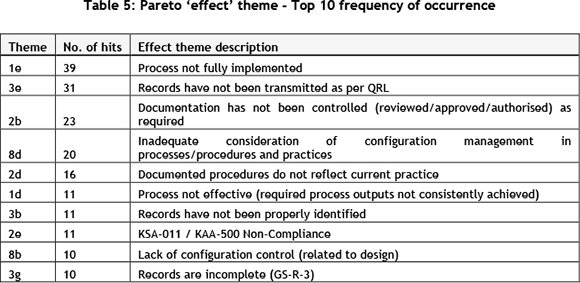
When assigning themes, the coder must consider the same nonconformity from two different perspectives: the 'effect' and the 'cause' perspectives. The 'effect' question that must be answered is, "What is the effect of the nonconformity?" and the 'cause' question is, "What was the likely cause of the nonconformity?"
Table 5 shows the collective totals of each QMS theme assigned per nonconformity. Analysis of the data at a theme-specific level provides the detail of the common nonconformity within the business. As noted previously, the effect theme is the indicator of current nonconformity, which could be seen as the current business risk related to QMS deficiency. Theme '1e' (Process not fully implemented) is related to procedure noncompliance, and management thus has some indication of where further investigation needs to take place and corrective action needs to be taken.
The collective summary of allocated 'cause' themes is shown in Table 6. The 'cause' theme data provides management a guide to where corrective action and preventive action must be directed to reduce the effects or consequences of management system nonconformity.
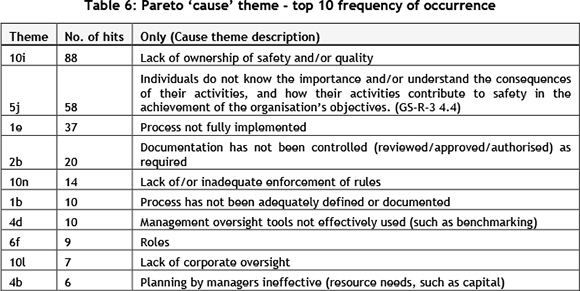
From the results seen in Table 6, the major causes over the period are related to 'cultural controls' and 'training and competency' issues.
5.2 Pareto analysis at QMS process level
High level trends are observed from the analysis at the process level. To obtain the process level information, the individual themes are counted if they are associated with the same process heading - e.g., Process Management, Records Management, or Interface Control. Process level information may then be dissected as required to expose information that may direct action. Figure 8 shows the summary of themes collected for the period 2008 to 2010 from the 'effect' themes.
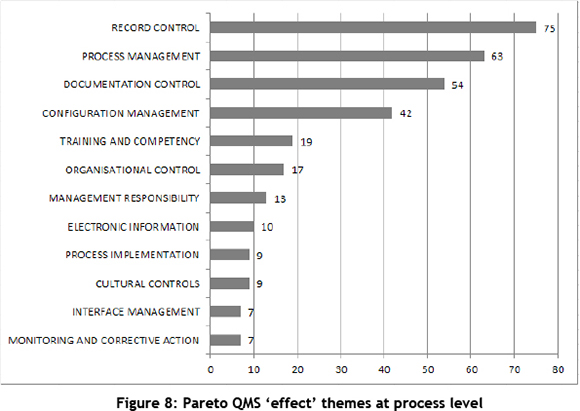
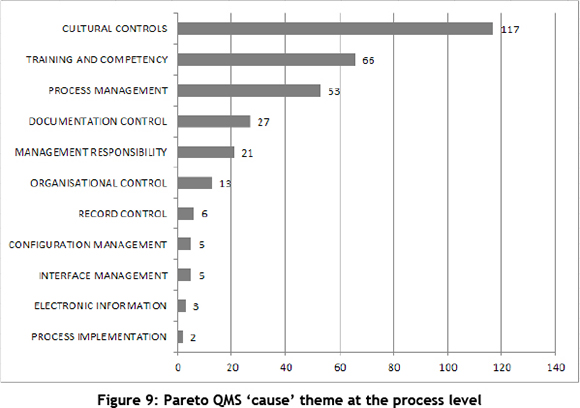
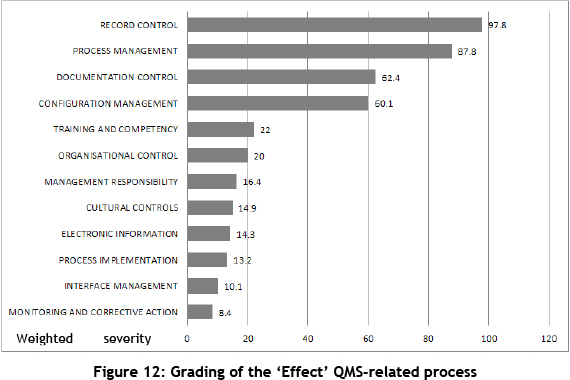
The 'effect' theme shows the consequence of the nonconformity. Records management is crucial in the nuclear environment, and the results will direct management to attend to this larger process area. Figure 9 shows the summary of 'cause' themes; the major contributor over the three-year period is 'cultural controls'.
A link can be made between the increase of nonconformity in the 'cultural control' area (cause NC) and the 'records control' area (effect NC) (in Figure 8); this will, however, require a more detailed analysis.
A similar analysis of 'cause' themes would then direct management to areas where the most value can be obtained by implementing corrective and preventive action that addresses the causes.
5.3 QMS-related performance measurement
As opposed to providing only the locating information (as seen in Section 4.2.1), the QMS-related performance measurement provides an additional dimension, 'severity'. This allows management to prioritise better where the more urgent action is required. The severity component is obtained by considering both the specific severity grading and the generic or process severity grading.
5.3.1 The NEI's coding value
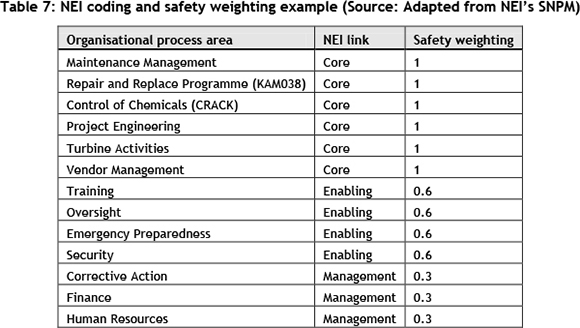
The NEI's generic severity grading is assigned to the organisational process while taking the NEI's SNPM process [14] into consideration. The sample of process areas given in Table 7 shows the alignment with their respective organisational process areas, as aligned with the NEI's SNPM [14]. All nonconformities have a direct relationship with an organisational process area. The nonconformities thus inherit the NEI's process coding and its associated quantitative value. This enables extrapolation, as shown in Figure 10.
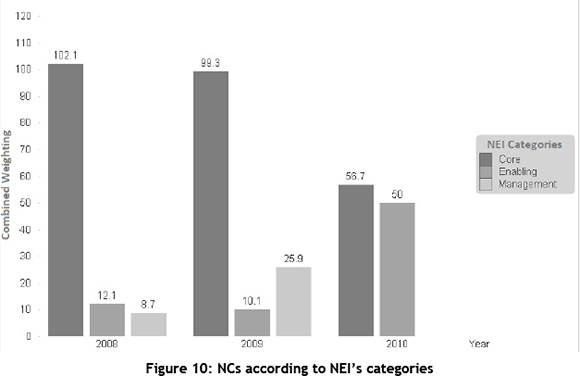
Arbitrary values were assigned to the three main clusters of the NEI model (as noted in the next section):
- Core processes are assigned '1'.
- Enabling processes are assigned '0.6'.
- Management processes are assigned '0.3'.
5.3.2 Assignment of NEI coding
Table 7 shows the weighting assigned to the NEI codes, based on the NEI's SNPM. The organisational process areas were extracted from the population of nonconformities, and might vary if additional data were added to the population. This is seen as an area for improvement in future studies to enhance the reliability of the study.
To obtain a quantitative severity value per nonconformity, the sum of the values assigned to the SSG (High, Medium, and Low) and the GSG (Core, Enabling, and Management) is used. The sum of the Nonconformity Severity Gradings (NSGs) within each process area makes up the Process Severity Grading (PSG). For each of the nonconformities and QMS process areas, the equation to obtain a quantitative value is as follows:
SSG = {High =1; Medium = 0.8; and Low = 0.3}
GSG = {Core = 1; Enabling = 0.6; and Management = 0.3}
Nonconformity Severity Grading (NSG):
NSG = SSG + GSG, hence
Process Severity Grading,
PSG = Σ NSG (severity grading related to the process area)
The example below shows the total PSG for the 'Documentation Control' process area for 2008, equalling 10.8, and made up of the sum of NSGs within the process area for 2008.
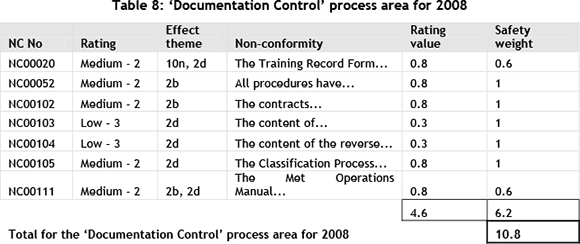
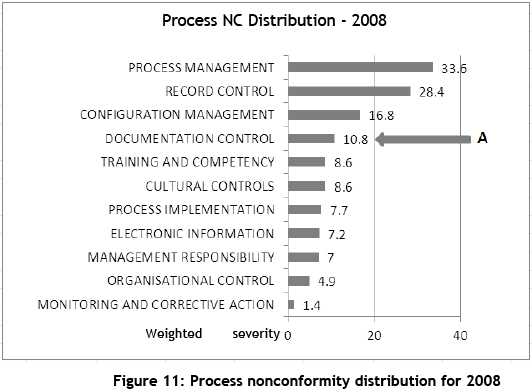
Figure 11 shows the overall process nonconformity value distribution in 2008. The identifier 'A' in Figure 11 shows the 'documentation control' area within the context of the other process areas for 2008.
The overall QMS performance measure over a period of time equates to the sum of the quantitative value of the PSGs within that time period. This allows us to see the 'cause vs. effect' at various levels of detail, namely:
- Nonconformity level.
- Process/System level.
- Organisational level.
5.4 QMS performance measure results
The quantitative outputs will also be visible at the above levels, and as a result we may be able to see some of the following:
- The nonconformities that carry the most risk to the business, while taking cognisance of the various facets of organisational risk: e.g., nuclear safety, regulatory noncompliance, plant health, etc.
- The process area where the most energy needs to be expended to reduce the overall risk (again taking cognisance of the various facets of risk).
- The organisational area that requires the most attention to reduce risk on business reliability.
Figure 13 shows the distribution of QMS process anomalies, and includes severity data by year. This figure highlights a decrease in 'process management' severity over the three year period: i.e., from 33.6 (2008) to 31.6 (2009) to 22.6 (2010).
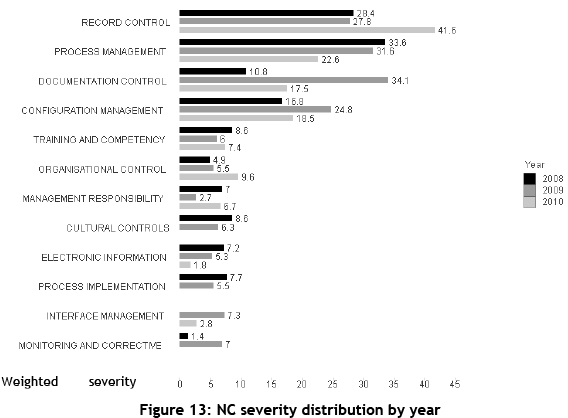
The severity data informs the urgency of action by providing management with additional risk-oriented data. This might require different or additional actions than if only the QMS deficiency location data were considered.
5.5 Quantitative measure of the QMS performance.
To arrive at a quantitative QMS performance measure, the collective nonconformity data is analysed, processed, and aggregated. Figure 14 shows a summary of the 'severity informed' nonconformity data by year. The aggregation of the data shows the amount of QMS deficiency observed in each year. To provide a more conventional generic reference, the deficiency data (Figure 14) is converted into a positive percentage value (Figure 15).
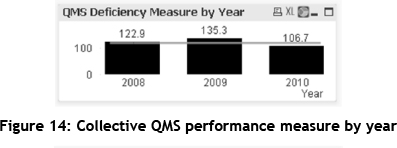
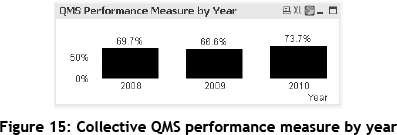
The methodology to attain this value is encapsulated in the derived formula:
QMS performance measure % = 1-(Σ (SSG+GSG))/K
The constant 'K' should vary from organisation to organisation in order to obtain an appropriate reference point from which to gauge improvement. The value would be chosen to challenge the organisation and not to discourage it.
The value 405 is a variable used in this study to obtain a visual representation of the average QMS deficiency measure over three years to indicate 70% QMS performance.
A value of 100% QMS performance would indicate that zero open or unresolved nonconformity exists within the management system. Management can thus give its attention to, and act on, the 'cause' data in order to improve on the 73.7% QMS performance seen in 2010.
5.6 Validation and reliability of results
A survey was performed with a sample of three QMS lead auditors, including the author. The aim of this survey is to show a plausible methodology that could be used to support the validity and reliability of this research and any subsequent applications. The research constraints noted below, however, do not make an extensive reliability exercise viable. The reduced scale results provide positive encouragement for the success capability of this methodology.
5.7 Limitations of the study
To obtain the aggregated QMS performance value, a level of subjectivity is embedded in the inputs of various entry points to the model, contributing to the uncertainty noted in the final QMS performance measurement. These include elements such as:
- Auditor bias, competency, and experience.
- The quality and reliability of the comprehensive theme lists.
- The understanding and application of the nonconformity-specific severity grading.
Sufficient confidence is claimed to allow management to act on the QMS measurement and Pareto analyses data. The subjective inputs in the model will decrease as uncertainties are reduced.
6 CONCLUSION
This research has shown that QMS performance can be measured using quantitative analysis that deconstructs the elements making up the QMS: the process areas and nonconformity noted within those process areas.
By applying the methodology noted in this research, which includes overlaying QMS themes within audit data and analysing that data, management is presented with two information sources they can consider in different ways. When the extracted 'effect' data is analysed, it provides a measurement of the status that the 'effect' QMS deficiency has on the business. The 'cause' data provides management with a target that could reduce the negative results of the effects noted, if appropriate action is taken.
When the individual monitoring activity elements (such as nonconformities and their associated process areas) are aggregated and analysed, they culminate in a quantitative QMS performance measurement.
This paper argues that a positive impact on business performance can be seen if management is provided with a quantitative reference for improving their overall QMS implementation compliance, and if this compliance is then improved.
Further research is recommended in the following areas:
- Refinement of the criteria used to grade nonconformities, and a methodology for improving the understanding and application of the nonconformity-specific severity grading.
- Reduction of the level of uncertainty in auditor bias, competency, and experience.
- Refinement of the QMS process theme lists, with exposure for influence being opened to a much wider audience.
REFERENCES
[1] ASME NQA-1. 2008. Quality assurance requirements for nuclear facility applications (QA). The American Society of Mechanical Engineers. [ Links ]
[2] Bell, S. 2001. A beginner's guide to uncertainty of measurement. Measurement Good Practice Guide No. 11. United Kingdom: Crown Press. [ Links ]
[3] Ciardiello, A.V. 2002. Helping adolescents understand cause/effect text structure in social studies. The Social Studies (February), pp.31-36. [ Links ]
[4] Creswell, John W. 2009. Research design: Qualitative, quantitative, and mixed methods approaches. ,3rd edition, Sage Publications. [ Links ]
[5] Davies, R. & Davis, A. 2011. Value management: Translating aspirations into performance. Gower Publishing, Ltd. [ Links ]
[6] Fink, D. 2006. Value decomposition of e-commerce performance. Benchmarking: An International Journal, 13(1/2), pp.81-92. [ Links ]
[7] Fons, S. 2011. Measuring economic effects of quality management systems. The TQM Journal, 23(4), pp.458-474. [ Links ]
[8] Guest, G., MacQueen, K. & Namey, E. 2012. Applied thematic analysis. California: SAGE Publications. [ Links ]
[9] Ghalayini, A.M. & Noble, J.S. 1996. The changing basis of performance measurement. International Journal of Operations & Production Management, 16(8), pp.63-80. [ Links ]
[10] Hubbard, D.W. 2010. How to measure anything: Finding the value of 'intangibles' in business. New Jersey: John Wiley & Sons, Inc. [ Links ]
[11] IAEA GS-R-3. 2006. The management system for facilities and activities. International Atomic Energy Agency. [ Links ]
[12] ISO 9001. 2008. Quality management systems - requirements. The International Organisation for Standardisation (ISO). [ Links ]
[13] Kellen, V. 2003. Business performance measurement, At the crossroads of strategy, Decision Making, Learning and Information Visualisation. 1(312), pp. 1-36. [ Links ]
[14] NEI SNPM. 2004. The standard nuclear performance model - A process management approach. Revision 4, Nuclear Energy Institute. [ Links ]
[15] Pan, J., Kuo, T. & Bretholt, A. 2010. Developing a new key performance index for measuring service quality. Industrial Management & Data Systems, 110(6), pp.823-840. [ Links ]
[16] Ramly, E.F., Ramly, E.S. & Yusof, M. 2007. Effectiveness of quality management system audit to improve quality performance - A conceptual framework. Paper presented at The Fifth International Conference on Quality and Reliability (ICQR 2007), Chiang Mai, Thailand. [ Links ]
[17] Rusjan, B. & Alic, M. 2010. Capitalising on ISO 9001 benefits for strategic results. International Journal of Quality & Reliability Management, 27(7), pp.756-778. [ Links ]
[18] Saraph, J.V., Benson, G. & Schroeder, R.G. 1989. An instrument for measuring the critical factors of quality. Decision Sciences, 20(4), pp.810-829. [ Links ]
[19] Saunders, M., Lewis, P. & Thornhill, A. 2009. Research methods for business students. 5th edition, England: Pearson Education Limited. [ Links ]
[20] Van der Wiele, T. 2002. A context dependent approach to quality management, pp. 1-6. (paper read at 54th EOQ Congress. October 2010. Izmir, Turkey. [ Links ])
[21] Eskom Internal Procedure, KAA-832. 2009. Quality assurance monitoring processes. Eskom, Koeberg Nuclear Power Station, Internal Process Document. [ Links ]
[22] Van der Wiele, T., Dale, B. & Williams, R. 1999. Business improvement through quality management systems. Management Decision, 38(1), pp.19-23. [ Links ]
[23] Dick, G.P.M. 2009. Exploring performance attribution: The case of quality management standards adoption and business performance. International Journal of Productivity and Performance Management, 58(4), pp.311-328 [ Links ]
[24] Su, Q., Li, Z., Zhang, S., Liu, Y. & Dang, J. 2008. The impacts of quality management practices on business performance: An empirical investigation from China, International Journal of Quality and Reliability Management, 25(8), pp.809-823. [ Links ]
* Corresponding author

