


Services on Demand
Article
 English (pdf)
 Article in xml format
 Article references
Indicators

Related links
-
 Cited by Google
 -
 Similars in Google
Share

 Permalink
South African Journal of Industrial Engineering
On-line version ISSN 2224-7890
Print version ISSN 1012-277X
S. Afr. J. Ind. Eng. vol.25 n.2 Pretoria Aug. 2014
GENERAL ARTICLES
Optimising invesment in asset management using the multivariate asset management assessment topography
W.G. Bam; P.J. Vlok*
Department of Industrial Engineering Stellenbosch University, South Africa. pjvlok@sun.ac.za
ABSTRACT
The multivariate asset management assessment topography (MAMAT) was developed to quantify, and represent graphically, development, adoption, and performance of a business' asset management (AM) systems, as described by standards such as PAS 55. The MAMAT provides a way to visualise clearly the strengths and weaknesses of a business' asset management system. Building on MAMAT, a model describing the relationship between the commitment of resources and the corresponding improvement in the MAMAT assessment outcome is proposed. The goal is to develop an optimisation model that will maximise financial benefits by improving the MAMAT assessment score achieved by a business, while minimising the investment required to attain this improvement. This is achieved by determining the optimal allocation of resources to the different subcategories of the MAMAT assessment framework. The multi-objective cross-entropy method (MOO CEM) is used to find the Pareto set of solutions for this problem. In order to showcase the intended industry application and use of the optimisation model, a hypothetical case study is executed and described in this paper. From this application, it was found that the MOO CEM finds useful solutions that can support the implementation of standards such as PAS 55 by prioritising and assigning resources to implementation activities.
OPSOMMING
Die meerveranderlike batebestuur evalueringstopografie (MBE) is ontwikkel om 'n besigheid se prestasie te kwantifiseer en grafies voor te stel. Dit word gedoen aan die hand van 'n volwassenheid-, gebruiklikheids- en prestasie indeks van die batebestuur stelsel soos beskryf deur internasionale standaarde soos PAS 55. Die MBE bied 'n manier om duidelik die sterk- en swakpunte van 'n besigheid te visualiseer en te identifiseer met betrekking tot die batebestuur stelsel. Gebaseer op die MBE word 'n model voorgestel wat die verhouding tussen die gebruik van hulpbronne en die ooreenstemmende verbetering in die MBE assesseringsuitkomste beskryf. Die fokus van hierdie studie is om 'n optimeringsmodel te ontwikkel wat die finansiële voordele van die verbetering van die MBE assesseringstellings maksimeer, terwyl dit die finansiële belegging wat benodig word om dit teweeg te bring minimeer. Dit word gedoen deur die bepaling van die optimale toewysing van hulpbronne aan die verskillende onderafdelings van die MBE assesseringsraamwerk. Die veeldoelige kruis-entropie metode (VD KEM) word gebruik om die Pareto stel van oplossings vir hierdie probleem te vind. Ten einde die voorgenome nywerheidstoepassing ten toon te stel, is 'n hipotetiese gevallestudie uitgevoer en beskryf in hierdie artikel. Vanuit hierdie aanwending is bevind dat die MD KEM nuttige oplossings vind wat die implementering van standaarde soos PAS 55 ondersteun deur die prioritisering en toewysing van hulpbronne aan implementeringsaktiwiteite.
1 INTRODUCTION
Physical asset management (PAM) can be defined as "systematic and coordinated activities and practices through which an organization optimally and sustainably manages its assets and asset systems, their associated performance, risks and expenditures over their life cycles for the purpose of achieving its organizational strategic plan" [1]. As a business area, PAM has lately been receiving more attention [2], [3], [4]. This is evident from the recent development and publishing of new asset management standards such as PAS 55 and ISO 55000. PAM can thus be implemented in alignment with PAS 55, ISO 55000, or any other industry- or company-specific standard.
Though the existing asset management standards provide guidance for the implementation of PAM, they tend to be non-prescriptive and outcome-based [5], [6]. This can be a challenge to businesses when they decide how to prioritise the improvement of their asset management systems. The business essentially wants to apply its limited financial, human, and other resources to achieve the greatest benefit at a minimal investment [5]. Furthermore, most interventions start with an assessment of the status quo and track progress by means of assessment [7]. A thorough assessment methodology that measures the key asset management system drivers can support and direct improvement interventions [8], [6], [9].
This paper presents a recently developed model (the multivariate asset management assessment topography) that analyses a business' asset management system. A hypothetical assessment is presented; based on this assessment, the multi-objective cross-entropy method (MOO CEM) meta-heuristic is applied to prioritise PAM investment. This prioritisation is achieved by optimising potential gain versus required investment for each activity. This methodology can be used to assist decision-makers and businesses to get the most out of their asset management activities and practices.
2 THE MULTIVARIATE ASSET MANAGEMENT ASSESSMENT TOPOGRAPHY (MAMAT)
The multivariate asset management assessment topography (MAMAT) was recently developed by the Asset Care Research Group (ACRG) at Stellenbosch University [10]. It is based on the Institute of Asset Management's (lAM's) PAS 55 assessment methodology (PAM) [11], but extends its one-dimensional structure to a more thorough multi-dimensional assessment tool that serves as a guide for effective improvement action [10].
To visualise assessment data, the PAS 55 assessment methodology makes use of radar/spider graphs. An example is given in Figure 1, where the maturity values that are used later in this paper are represented. Spider graphs promote comparison across multiple dimensions, unlike line or bar graphs; but they may lead to visual confusion [12]. Furthermore, such a chart cannot display additional assessment dimensions, and can become difficult to interpret [12].

Each MAMAT assessment area, is assessed in three-dimensions i.e. development, adoption, and performance. When the three dimensional results for each assessment area are plotted on the same graph, this results in a four-dimensional graph, with the assessment area constituting the fourth dimension. Time can be added as an additional dimension where snapshots from different periods of the MAMAT assessment are compared. For the hypothetical case study considered in this paper, the development, adoption, and performance of 27 assessment areas based on PAS 55 were considered. The resulting 81 variables were arbitrarily assigned values between 0 and 10 to reflect the anticipated 'as-is' values of a real business. An example of the input required for a MAMAT assessment is presented in the first column of Table 1.

The other two columns of Table 1 respectively represent the return associated with improvement and the investment required to achieve it. These are referred to later in the paper. In the table, the 'D' column represents the business' development, the 'A' column the adoption, and the 'P' column the performance for each of the assessment areas.
From these inputs it is possible to create a PAM-type diagram of the development assessment (D) for each assessment area. Such a representation is shown in Figure 1. It is also possible to create a three dimensional MAMAT topography based on all three assessment criteria (D, A, and P). Such a representation is shown in Figure 2.

The MAMAT representation encapsulates more information at a glance. It also presents a clearer and more thorough picture of the state of an asset management system. In the MAMAT representation, the assessment areas represented by peaks that are towards the back, red, and high are those that are in the best condition, while those that are at the front, blue, and low still have a lot of room for improvement.
3 THE RETURN/INVESTMENT RELATIONSHIP
Based on the inputs of the MAMAT shown in Table 1, one can determine return/investment ratios for each of the 81 variables. These ratios are contained in Table 2.

From these ratios it is possible to determine which areas would yield the highest return when they are invested in. For smaller businesses, this level of analysis may be sufficient. A business could now prioritise its investment based on the highest return/investment ratio. However, these ratios do not indicate the total amount that should be invested in each assessment area. They also do not take the law of diminishing returns into account. To account for these factors, it is necessary further to analyse the return-investment characteristics of a company's asset management system.
4 MODELLING THE RETURN/INVESTMENT RELATIONSHIP
The optimisation problem to improve this hypothetical MAMAT position is two-dimensional, as it contains two objectives that have to be optimised. The financial return expected from the improvement must be maximised, while the financial investment to attain this improvement must be minimised. This yields the maximum total investment/return ratio that the business needs to effect.
It would also be possible to add extra dimensions to the model, such as human resources, if required. This could be necessary where the productivity per worker is used as a key performance indicator (KPI). This is distinct from the return on investment [13] due to increasing complexity, legislation, labour-related problems, and other constraints that may limit the number of workers that a company or business may want to employ.
The decision variables for the model were chosen to be the increases in each of the 81 MAMAT variables for any 'to-be' state. These increases then implicate financial investments as well as an associated return from the improved asset management system. It is assumed that sufficient resources are already allocated to sustain the current level of asset management system performance, and only further improvements are considered.
To model the application of financial resources, it is assumed that each of the 81 variables of the MAMAT assessment areas can be improved. These variables have values ranging from zero to 10. A monetary investment is then associated with the first 0.1 absolute improvement in each of these variables. The monetary investment associated with the improvement in each of the variables is shown in Column 1 of Table 1.
Furthermore, it is assumed that the law of diminishing returns applies, with similar incremental improvements becoming more and more expensive as the rating of any one of the 81 variables increases towards the maximum value of 10. This phenomenon is modelled by using the shape of a cumulative Weibull distribution to approximate the increasing investments incurred when increasing the MAMAT assessment values.
The distribution is used with a shape parameter of 1, but this can be individually adapted for each of the 81 financial resources variables. This allows the decision-maker easily to tweak the shape of the diminishing returns curve for each of the variables to approximate most closely the behaviour of the business environment.
The scaling factor is adapted according to the difference between the maximum level of the assessment value (10) and the current level of the value. The return curve is thus scaled to produce a 1 per cent absolute improvement for the investment level specified by the user. A graphical representation of the diminishing returns curve before this scaling for the return specified is shown in Figure 3.

To attain the return on investment of any proposed solution (combination of variables), a certain return on investment is determined and specified for a 1 per cent absolute improvement for all of the 81 MAMAT variables. This is shown in Column 3 of Table 1. For simplicity, this return is assumed to be linearly related to the increase in the variable, as opposed to the financial resources required for the increases of the variables. However, if required, the return could also be modelled by a particular mathematical expression.
In summary, the input variables for the model are the absolute improvements for each of the 81 MAMAT assessment criteria, while the output variables are the financial resources required to attain these improvements and the return on investment resulting from these improvements. The return on investment for each assessment criterion is linearly related to the improvement for that specific criterion, while the financial resources required are non- linearly related to the input variables, according to the law of diminishing returns as modelled by the Weibull distribution.
5 OPTIMISING THE RETURN/INVESTMENT MODEL
In the proposed model, each of the 81 decision variables representing the MAMAT assessment improvements has an infinite number of possible real values. These values range from zero to 10, minus the current value of the associated assessment variable. Furthermore, the optimisation problem of determining the optimal improvements in each of the 81 criteria is two-dimensional. A single global optimum value is therefore not expected, but rather a two-dimensional Pareto front with an infinite number of 'equally optimal' solutions. To attain an approximation of the Pareto front for the model in the case study, a meta-heuristic - an adaptation of the multi-objective cross-entropy method (MOO CEM) proposed by Bekker [14] - was applied to the problem using Matlab® R2009b. The number of objective function evaluations was limited to 10,000.
The resulting Pareto front is shown in Figure 4. Each point on this front thus represents a solution where it is not possible to increase the return without increasing the required investment. The decision-maker can select a point on this front that represents the most desirable position for the business. As expected, the curve also has a diminishing returns nature - i.e. the marginal investment to increase the return achieved increases with increasing base values of return.
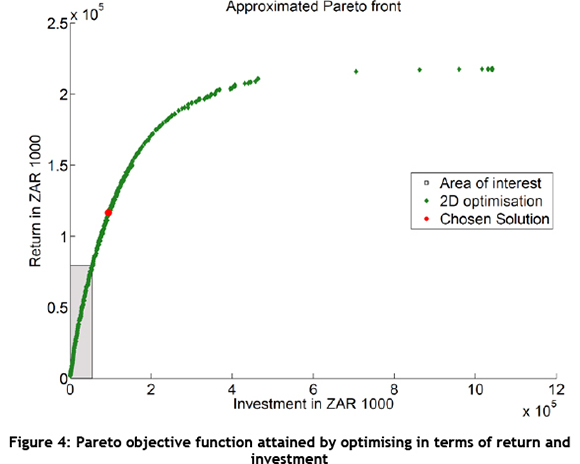
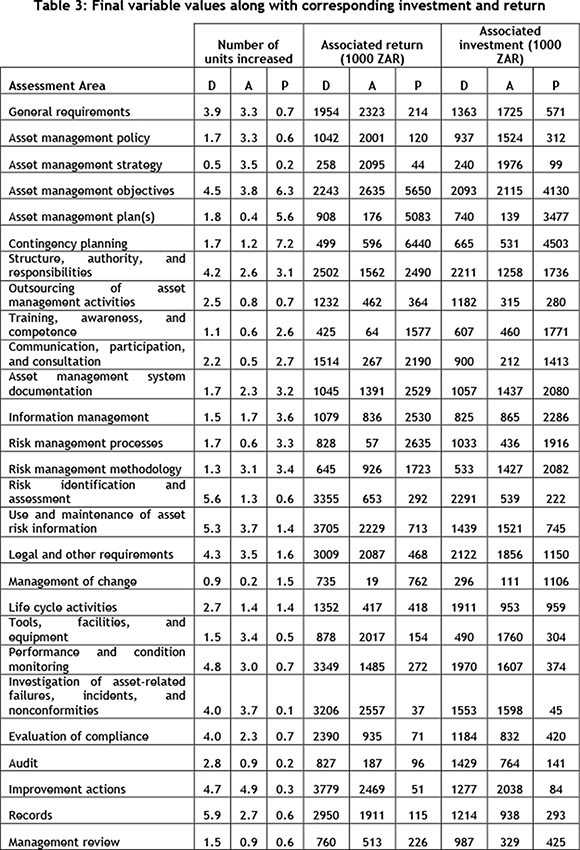
To illustrate the concept, a point that might seem like a good solution is indicated on the Pareto front. The improvement variables that generated this point on the objective value plot, along with the investment and return for each, are shown in Table 3. The corresponding MAMAT assessment is shown in Figure 5. The solution leads to a total return of ZAR116,6 mil and requires an investment of R94,7 mil. This represents an overall return/investment ratio of 1.23.

Theoretically, any chosen point on the Pareto front should be taken where the derivative of the front is still more than one - i.e. where the marginal investment to increase return attained is still less than the return attained. Otherwise the business is investing more without getting a positive return on its investment. However, the eventual choice of the point depends on the budget, strategy, and other requirements of the business. As an illustration, the area where the return increases at a higher rate than the investment is indicated by the shaded region in Figure 4. On closer inspection we can thus determine that our initially chosen point does not seem to be such a good choice; it falls outside the shaded region, and thus includes certain investments that do not increase the return at a higher rate.
6 CONCLUSION
The MAMAT is a flexible assessment tool that can capture and visually display a business' current asset management system performance. The model proposed in this paper enables the application of the MOO CEM to find a Pareto optimal set of resource allocations that maximise the value attained from improving a business' MAMAT assessment, and that can consequently be used to prioritise asset management system improvements. The model is also flexible enough to use in any industry where asset management plays a major role, as several aspects can be modified to reflect more closely the realities in a given industry. It is envisioned that the model will be applied to maximise the value that companies gain from the asset management activities and practices that form part of their asset management systems.
REFERENCES
[1] British Standards Institution. 2008. PAS 55-1:2008. Asset management. [ Links ]
[2] Campos, M.A. & Márquez, C.A. 2011. Modelling a maintenance management framework based on PAS 55 standard, 6, s.l. Quality and Reliability Engineering International,27, pp. 805-820. ISSN 1099-1638. [ Links ]
[3] Davies, R., Dieter, J. & McGrail, T. 2011. The IEEE and asset management: A discussion paper. Power and Energy Society General Meeting, 2011 IEEE, pp. 1-5. [ Links ]
[4] Woodhouse, J. 2006. Putting the total jigsaw puzzle together: PAS 55 standard for the integrated, optimized management of assets. International maintenance conference. [ Links ]
[5] Bender, J. 2011. The Business Case For PAS 55: An emerging global standard for asset management. Maintenance Technology. [Online]. [Cited: 11 April 2013.] http://www.mt-online.com/june2011/the-business-case-for-pas-55-an-emerging-global-standard-for-asset-management. [ Links ]
[6] Willia, A. 2007. Experiences with asset management assessment and benchmarking. 2007 IET Seminar on PAS 55 and Measuring Asset Management, pp. 123-132. ISSN 0537-9989. [ Links ]
[7] Williams, L., Jami, I. & Argent, S. 2007. Good practice asset risk management: A regulator's tale. 19th international conference and exhibition on electricity distribution, Vienna, Austria. [ Links ]
[8] Simoes, J.M., Gomes, C.F. & Yasin, M.M. 2011. A literature review of maintenance performance measurement: A conceptual framework and directions for future research. Journal of Quality in Maintenance Engineering, 17, pp. 116-137. [ Links ]
[9] Gibbons, P.M., Kennedy, C., Burgess, S.C. & Godfrey, P. 2012. Developing an asset management value improvement model (α-VIM) approach for an airport operational engineering environment. International Journal of Quality & Reliability Management, 29, pp. 797-819. [ Links ]
[10] Vlok, P.J. & Fogel, A.G. 2012. Assessing asset management maturity. Unpublished lecture notes: Stellenbosch University. [ Links ]
[11] The Institute of Asset Management. 2008. PAS 55 Assessment Methodology (PAM). [Online]. [Cited: 11 April 2013.] http://theiam.org/products-and-services/pas55-methodology/download-pam. [ Links ]
[12] Goldberg, J.H. & Helfman, J.I. 2010. Comparing information graphics: A critical look at eye tracking. Proceedings of the 3rd BELIV'10 Workshop: Beyond time and errors: Novel evaluation methods for information visualization, pp. 71-78. ACM: Atlanta, Georgia. [ Links ]
[13] INTRAFOCUS. 2011. Key performance indicators. [Online]. [Cited: 11 April 2013.] http://www.intrafocus.co.uk/documents/. [ Links ]
[14] Bekker, J. 2012. Applying the cross-entropy method in multi-objective optimisation of dynamic stochastic systems. PhD dissertation [Online]. [Cited: 11 April 2013.] http://hdl.handle.net/10019.1/71717. [ Links ]
* Corresponding author

